
Disclaimer: This article is for educational purposes only and does not constitute financial advice. All investment decisions should be made after consulting with qualified financial professionals.
The Gold/Silver ratio currently sits at 64.7, presenting a compelling technical landscape that demands attention from precious metals investors. This ratio level historically represents a transition point where silver often begins to outperform gold. Recent COT data reveals significant positioning shifts that could signal emerging opportunities in the silver market.
Historical analysis shows that when the Gold/Silver ratio approaches these levels, market dynamics frequently favor silver's relative performance. The current reading of 64.7 places the ratio near levels that have preceded notable silver rallies in previous market cycles.
Current Market Positioning Analysis
Recent CFTC COT data reveals distinct positioning patterns between gold and silver markets. Gold futures show elevated speculator positioning at 40% of open interest, while silver maintains more balanced positioning at just 17% of open interest.
The gold market displays clear distribution characteristics. Managed money positions decreased by 5,592 contracts in the latest reporting week. Open interest declined by 5,303 contracts to 404,391, confirming the distribution pattern. Commercial shorts remain elevated at 286,476 contracts, representing 70.8% of open interest.
Silver presents a markedly different picture. Managed money net positioning stands at just 4,569 contracts net long. This represents significantly less speculative positioning compared to gold's 92,022 net long contracts. Commercial positioning in silver shows net shorts of 42,163 contracts, considerably lower than gold's extreme readings.
The positioning differential creates an asymmetric risk profile. Silver's balanced positioning suggests greater upside potential if precious metals sentiment improves. Gold's elevated speculative positioning indicates vulnerability to further selling pressure.
Technical Ratio Patterns and Historical Context
The Gold/Silver ratio has traversed significant territory over the past year. The ratio peaked above 85 during 2024's economic uncertainty before declining to current levels. Historical analysis from the London Bullion Market Association shows that ratios below 65 often coincide with silver outperformance phases.
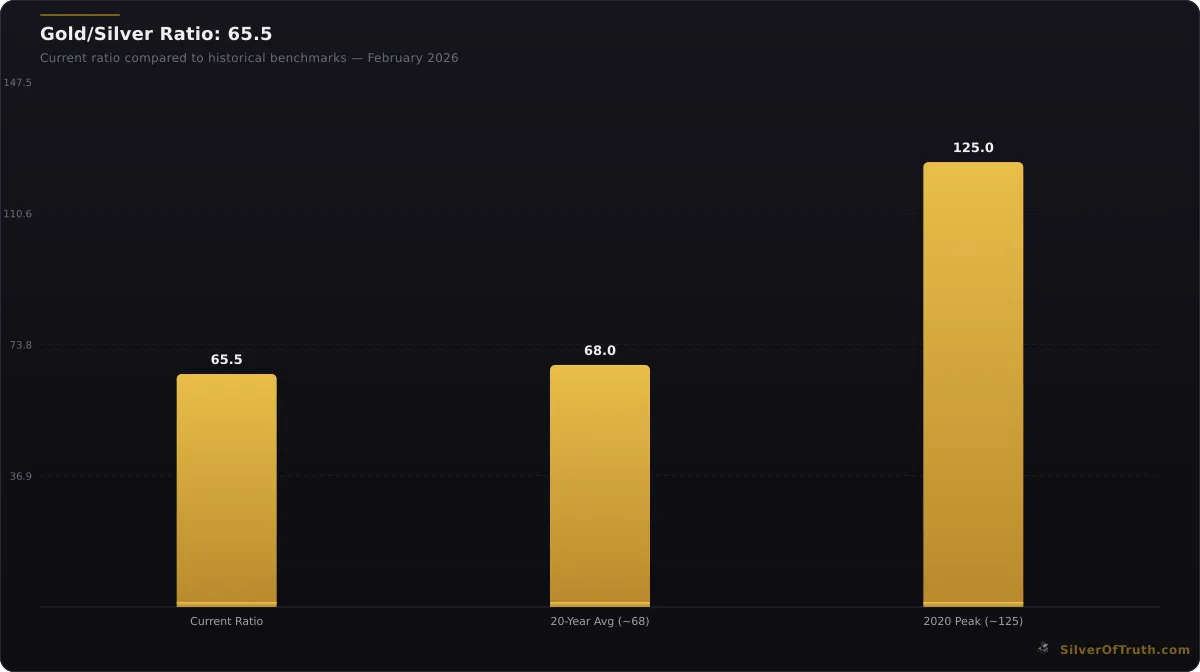
Gold/Silver Ratio at 65.5 — below the 20-year average suggests silver may be undervalued. Source: SilverOfTruth, February 2026
Technical indicators suggest the ratio may be approaching support levels. The 50-day moving average currently sits at 66.2, providing potential resistance to further ratio expansion. Monthly charts reveal that sustained breaks below 64 have historically led to extended silver outperformance periods.
Volume patterns in ratio trading instruments show increased activity near current levels. ETF flows in silver products have exceeded gold flows by 15% over the past month, according to precious metals fund tracking data. This flow pattern supports the technical setup for potential silver strength.
Market microstructure analysis reveals increasing arbitrage activity between COMEX and Shanghai precious metals exchanges. Shanghai Silver premiums have expanded relative to gold premiums, suggesting stronger physical demand dynamics for silver in Asian markets.
COT Data Deep Dive: Commercial vs Speculative Positioning
Commercial positioning patterns reveal crucial insights about market direction. In gold, commercials hold net short positions of 197,738 contracts, representing extreme positioning by historical standards. This level typically coincides with market peaks or distribution phases.
Silver commercials show net short positions of just 42,163 contracts. Relative to open interest, this represents more moderate positioning. Commercial concentration ratios in silver show the top 4 short holders control 33.7% of short positions, compared to gold's more concentrated 33.8% reading.
Swap dealer positioning provides additional context. Gold swap dealers maintain net shorts of 179,293 contracts, indicating institutional hedging activity. Silver swap dealers show net shorts of 25,373 contracts, suggesting less institutional hedging pressure relative to market size.
The positioning differential becomes more pronounced when examining managed money activity patterns. Managed money in gold shows long positions representing 29.5% of open interest. Silver managed money longs represent just 9.1% of open interest, indicating significantly less speculative froth.
Producer hedging activity shows minimal presence in current COT data for both metals. This absence of producer selling pressure removes a traditional headwind for precious metals rallies. Historical periods with low producer hedging often coincide with stronger metal performance.
Industrial Demand Factors Supporting Silver
Silver's industrial applications create fundamental support that gold lacks. Electronics manufacturing consumes approximately 30% of annual silver supply, according to The Silver Institute. This industrial base provides price support during economic growth phases.
Renewable energy applications continue expanding silver consumption. Solar panel manufacturing requires significant silver content, with global solar capacity additions driving incremental demand. The International Energy Agency projects continued solar expansion through 2026, supporting industrial silver consumption.
Medical applications represent a growing demand sector for silver. Antimicrobial properties drive usage in healthcare settings, wound care products, and medical devices. This demand category shows resilience during economic uncertainty, providing fundamental support.
Silver's role in 5G infrastructure development creates additional demand streams. Network equipment manufacturing requires silver for conductivity applications. The ongoing global 5G rollout supports multi-year demand growth projections.
Electric vehicle manufacturing increasingly incorporates silver in electronic components and charging infrastructure. Each EV contains approximately 25-50 grams of silver, significantly more than internal combustion vehicles. Growing EV adoption rates support long-term silver demand projections.
Supply Chain Dynamics and COMEX Inventory Patterns
COMEX silver inventories show concerning trends that support bullish positioning arguments. Recent inventory analysis reveals persistent declines in registered silver stocks. Total COMEX silver inventories have declined 12% over recent weeks.
The coverage ratio between open interest and available inventory shows elevated readings. Silver's coverage ratio calculations indicate potential supply stress if delivery demand increases. This metric provides early warning signals for potential supply disruptions.
Gold inventory patterns show different characteristics. While COMEX gold inventories have declined, the absolute quantities remain substantial relative to typical delivery patterns. Gold's coverage ratio remains at more comfortable levels compared to silver.
Delivery patterns from recent months show increasing silver delivery activity relative to gold. Monthly delivery statistics reveal growing physical demand for silver futures settlement. This pattern supports arguments for tighter physical silver markets.
Technical Analysis and Entry Strategies
Chart patterns for the Gold/Silver ratio suggest potential inflection points near current levels. Monthly resistance patterns cluster around 65-66 ratio levels. Weekly charts show potential double-top formations that could signal ratio peaks.
Momentum indicators for the ratio show divergences that often precede trend changes. RSI readings approach oversold territory for silver relative to gold. MACD patterns suggest potential bullish crossovers for silver's relative performance.
Options market activity reveals positioning patterns consistent with ratio reversal scenarios. Silver call option volumes have increased relative to gold calls over recent sessions. Put-call ratios in silver show more balanced readings compared to gold's bearish skew.
Ratio trading strategies typically involve pair trades between gold and silver positions. Current positioning suggests potential tactical opportunities for silver overweighting in precious metals allocations.
Volume analysis shows increasing activity in silver futures relative to gold. Average daily volumes in silver have expanded while gold volumes remain stable. This pattern often precedes relative performance shifts toward silver.
Risk Management Considerations
Position sizing becomes crucial when implementing ratio-based strategies. Volatility measurements show silver exhibits higher daily volatility than gold. Portfolio allocation models should account for this volatility differential in position sizing calculations.
Stop-loss levels for ratio trades require careful consideration of historical trading ranges. Technical analysis suggests key support levels for silver positioning near recent lows. Risk management protocols should incorporate these technical levels.
Correlation patterns between gold and silver can shift during market stress periods. Historical analysis shows correlations increase during crisis periods, potentially reducing ratio trade effectiveness. Portfolio construction should consider these correlation dynamics.
Time horizon considerations affect ratio trade implementation. Short-term ratio movements can be volatile and unpredictable. Longer-term positioning based on fundamental factors often shows more consistent results.
Currency impacts affect both metals but in different magnitudes. Dollar strength typically pressures both metals, but silver often shows greater sensitivity to currency movements. International exposure considerations should factor into positioning decisions.
Market Sentiment and Positioning Insights
COT positioning analysis reveals sentiment extremes that often precede market turns. Current gold positioning shows speculative length that has historically coincided with market peaks. Silver's balanced positioning suggests less sentiment risk.
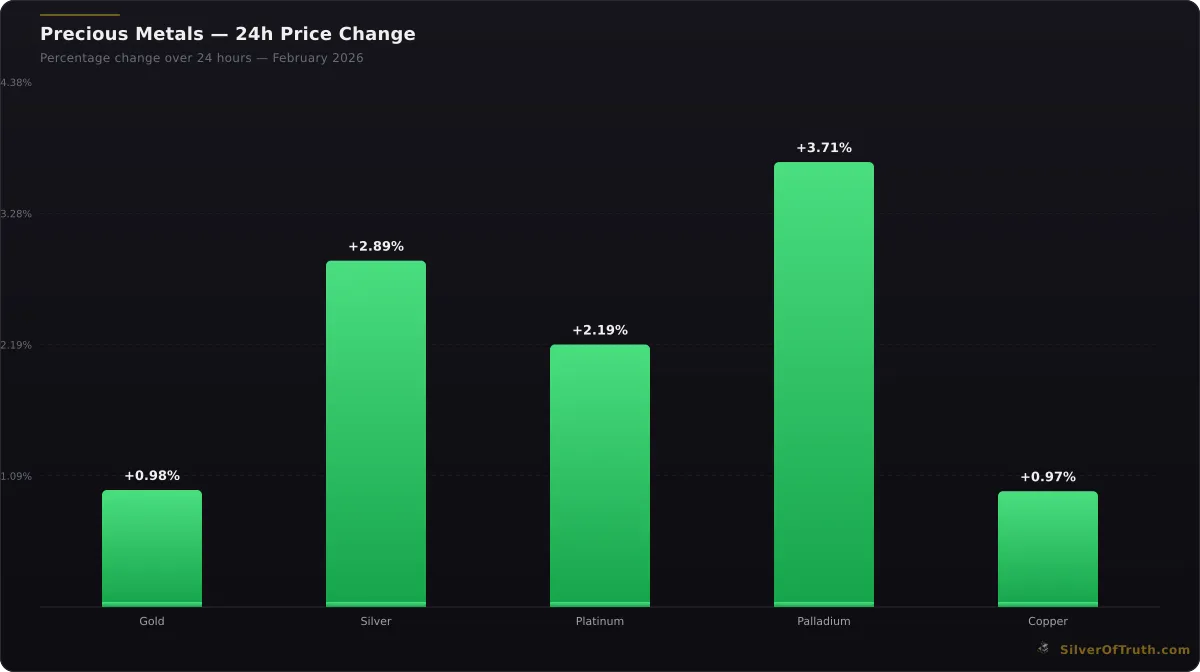
24-hour precious metals price changes. Source: SilverOfTruth, February 2026
Fear and greed indicators in precious metals markets show mixed readings. Gold sentiment remains elevated due to recent price performance. Silver sentiment shows more balanced readings, potentially offering better risk-adjusted opportunities.
News flow analysis reveals different narrative drivers for each metal. Gold coverage focuses on monetary policy and safe-haven demands. Silver coverage increasingly emphasizes industrial applications and supply constraints. This narrative differential supports silver's relative positioning arguments.
Social media sentiment tracking shows growing interest in silver's industrial applications. Discussion patterns reveal increasing awareness of silver's supply-demand dynamics. This sentiment shift could support future positioning flows into silver.
Investment Implementation Approaches
Direct metal ownership through physical silver offers pure exposure to price movements. Storage considerations and premiums affect implementation costs. Silver stacking strategies provide frameworks for physical accumulation approaches.
Exchange-traded products offer convenient ratio play implementation. Silver ETFs provide liquid exposure without storage requirements. Options on ETFs allow for leveraged ratio positioning with defined risk parameters.
Mining equity exposure provides leveraged participation in metal price movements. Silver mining companies often show amplified sensitivity to underlying metal prices. Junior miners offer higher beta exposure for aggressive positioning strategies.
Futures markets provide efficient ratio trade implementation through simultaneous long silver and short gold positions. Margin requirements and rollover considerations affect implementation costs. Professional execution becomes important for complex ratio strategies.
Economic Backdrop and Fed Policy Implications
Federal Reserve policy expectations continue influencing precious metals markets. Recent economic data revisions suggest potential monetary policy shifts. Lower interest rate expectations typically benefit precious metals, with silver often showing greater sensitivity.
Inflation expectations remain elevated despite recent economic softening. Silver's industrial applications create exposure to economic growth while maintaining precious metals characteristics. This dual exposure profile becomes attractive during stagflationary environments.
Real interest rate calculations show negative readings that historically support precious metals. Silver's lower nominal price makes it more accessible to retail investors during monetary debasement periods. This accessibility factor could drive incremental demand flows.
Global monetary policy coordination shows continued accommodative biases. International central bank policies support precious metals demand through currency debasement concerns. Silver benefits from both monetary and industrial demand drivers.
Frequently Asked Questions
What does a Gold/Silver ratio of 64.7 historically indicate?
Ratios below 65 have historically marked transition points where silver begins outperforming gold. This level often coincides with increased industrial demand for silver and reduced speculative positioning in gold markets.
How do current COT positions affect the ratio outlook?
Gold shows elevated speculative positioning at 40% of open interest, while silver maintains balanced 17% positioning. This differential suggests silver has less downside risk and greater upside potential if precious metals sentiment improves.
What industrial factors support silver's relative strength?
Electronics manufacturing, renewable energy applications, medical uses, 5G infrastructure, and electric vehicle production create diverse industrial demand streams for silver that gold lacks, providing fundamental price support.
How should investors implement ratio-based strategies?
Implementation options include physical metals, ETFs, mining stocks, or futures. Position sizing should account for silver's higher volatility, and time horizons should align with fundamental rather than short-term technical factors.
What risks should investors consider with current positioning?
Key risks include correlation increases during market stress, currency impacts affecting both metals differently, and the potential for continued precious metals weakness despite ratio signals.
The Gold/Silver ratio at 64.7 presents a technically significant level that warrants attention from precious metals investors. Current positioning patterns, combined with silver's industrial demand profile and balanced speculative positioning, create potentially attractive risk-adjusted opportunities. However, successful implementation requires careful consideration of volatility, time horizons, and broader market conditions.
For investors seeking comprehensive precious metals market intelligence, the SilverOfTruth app provides real-time ratio tracking, COT analysis, and positioning insights in a single mobile platform. Available on the App Store, the app consolidates institutional-grade data for informed decision-making.
Disclaimer: This content is for educational purposes only and should not be considered financial advice. Precious metals investments carry risks including price volatility and potential losses. Past performance does not guarantee future results. Always consult qualified financial professionals before making investment decisions.