
The Commitment of Traders (COT) report for silver provides essential insights into futures market positioning that can help traders understand market sentiment and potential price movements. This comprehensive analysis framework breaks down how to interpret CFTC positioning data, decode the relationship between commercial hedgers and speculative traders, and identify key signals within silver's unique market structure. Unlike other precious metals, silver exhibits distinct positioning patterns that require specialized interpretation techniques to extract actionable trading intelligence from weekly COT releases.
Understanding Silver COT Report Components
The CFTC's Commitment of Traders report breaks down silver futures positioning into distinct categories, each representing different market participants with varying motivations and time horizons. Commercial traders, primarily mining companies, industrial users, and dealers, typically hedge their physical exposure and appear as net short on the COT report. Non-commercial traders include hedge funds, money managers, and other large speculators who trade for profit rather than hedging purposes.
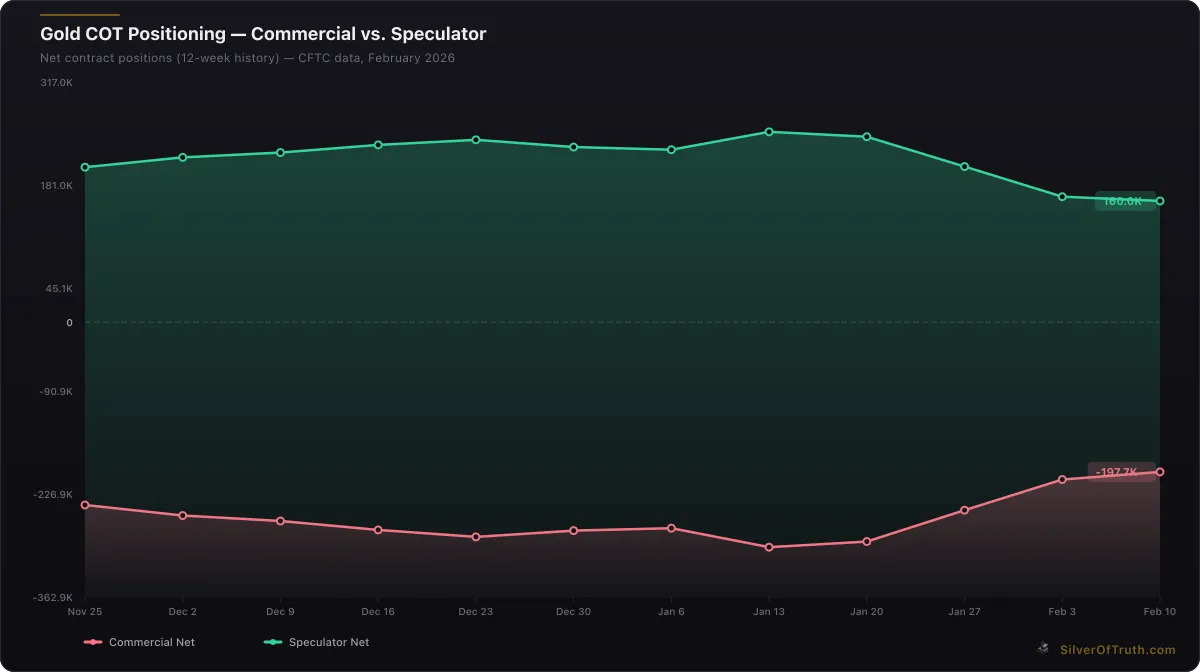
Gold COT positioning: commercial hedgers (red) vs. speculators (green). Source: CFTC via SilverOfTruth, February 2026
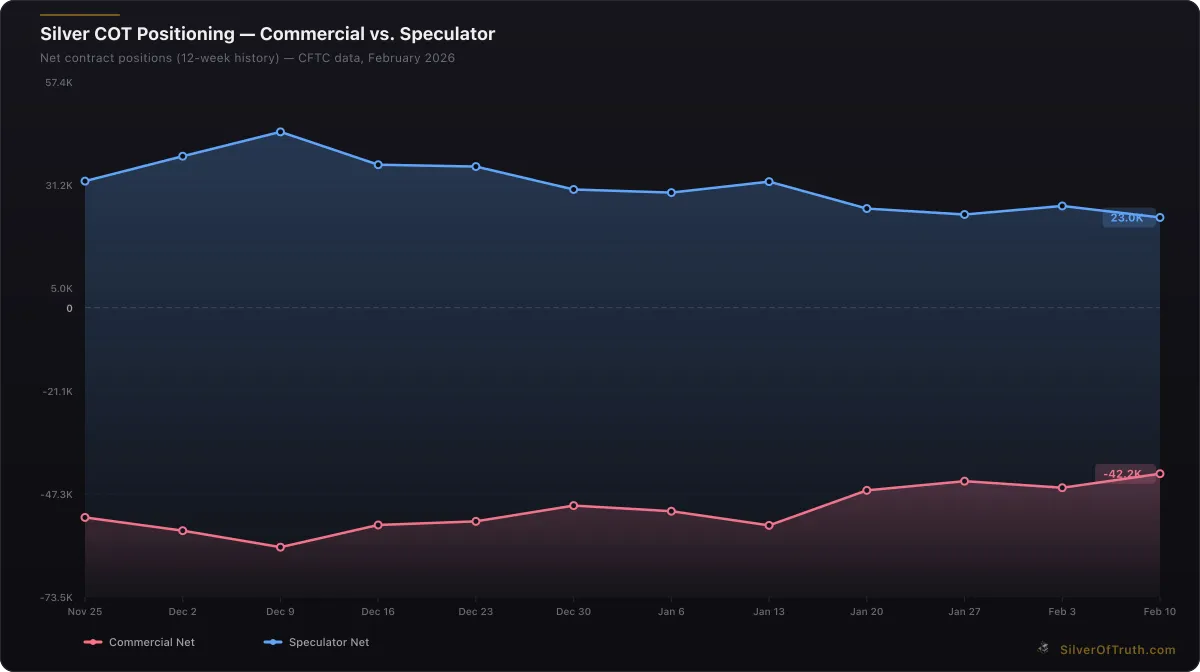
Silver COT positioning: commercial hedgers (red) vs. speculators (blue). Source: CFTC via SilverOfTruth, February 2026
Current silver positioning shows commercials with 37,295 long contracts and 79,458 short contracts, resulting in a net short position of -42,163 contracts. This represents 27.9% of total open interest on the long side and 59.5% on the short side, indicating strong commercial hedging activity. The commercial net position improved by +3,562 contracts week-over-week, suggesting reduced hedging pressure or profit-taking on previous short positions.
Non-commercial traders hold 36,660 long contracts against 13,705 shorts, netting +22,955 contracts with longs representing 27.4% of open interest and shorts just 10.3%. This balanced positioning contrasts sharply with gold's often extreme speculative bullishness. Managed money specifically shows 12,222 longs versus 7,653 shorts for a net long of +4,569 contracts, indicating relatively modest institutional participation compared to other precious metals.
The disaggregated COT data provides additional insights through swap dealers, who hold 21,652 longs and 47,025 shorts for a net position of -25,373 contracts. Swap dealers often facilitate over-the-counter transactions and their positioning can indicate institutional demand or hedging activity outside traditional commercial categories. Their 16.2% long participation and 35.2% short participation suggests significant intermediary activity in silver markets.
Commercial Positioning Analysis Framework
Commercial traders in silver futures represent the backbone of fundamental supply and demand dynamics. Mining companies use futures to hedge forward production, while industrial users hedge input costs for manufacturing processes ranging from electronics to solar panels. Dealers and refiners hedge inventory exposure and basis risk between physical and paper markets.
The current commercial net short position of -42,163 contracts sits at moderate levels compared to historical extremes. When commercial shorts exceed -60,000 contracts, it often indicates strong hedging demand from producers taking advantage of higher prices or industrial users securing supply. Conversely, commercial net positions approaching zero or turning positive typically coincide with market bottoms as hedgers reduce short exposure or add long positions.
Commercial positioning changes provide crucial market timing signals. The recent +3,562 contract improvement in commercial net position (becoming less short) through increased longs (+2,047) and reduced shorts (-1,515) suggests either reduced producer hedging or commercial accumulation. This pattern often precedes price stabilization or modest upward pressure as commercial traders typically have superior market intelligence regarding physical supply and demand conditions.
Concentration data reveals that the top 4 traders hold 20.2% of long positions and 33.7% of short positions, with top 8 traders controlling 31.3% of longs and 47.6% of shorts. This moderate concentration suggests a relatively distributed market without excessive concentration risk, though the higher concentration in short positions indicates large commercial hedgers dominate the short side of the market.
Speculative Positioning Patterns
Non-commercial positioning in silver futures exhibits different characteristics than gold, typically showing less extreme positioning and more frequent reversals. Current speculative net longs of +22,955 contracts represent moderate bullish sentiment without the crowded positioning often seen in gold futures. This balanced approach reflects silver's dual nature as both precious metal and industrial commodity.
The recent -2,922 contract reduction in speculative net positioning came through both long liquidation (-2,223) and new short establishment (+699). This suggests profit-taking rather than panic selling, as specs maintain constructive positioning while trimming exposure. Managed money specifically reduced net longs by just -414 contracts, indicating institutional money remains relatively stable in silver positioning.
Speculative positioning as a percentage of open interest provides crucial context for market sentiment. At 17% of total open interest, current speculative net positioning sits in neutral territory. Historical analysis shows speculative net longs above 30% of OI often coincide with market tops, while net shorts exceeding -10% of OI frequently mark bottoms. The current moderate positioning suggests silver markets aren't yet at sentiment extremes that typically precede major reversals.
The relationship between speculative positioning and price momentum reveals important trading signals. Silver's current neutral COT sentiment aligns with balanced positioning, suggesting the market is likely to follow fundamental price drivers rather than positioning-based reversals. This environment often favors technical analysis and supply/demand fundamentals over contrarian COT signals.
Open Interest Dynamics
Total open interest declined -9,539 contracts to 133,641, representing significant position liquidation across trader categories. This reduction coincided with speculative selling and commercial covering, suggesting mutual profit-taking rather than distressed liquidation. Open interest changes provide crucial context for understanding whether position changes represent new money entering or existing positions being unwound.
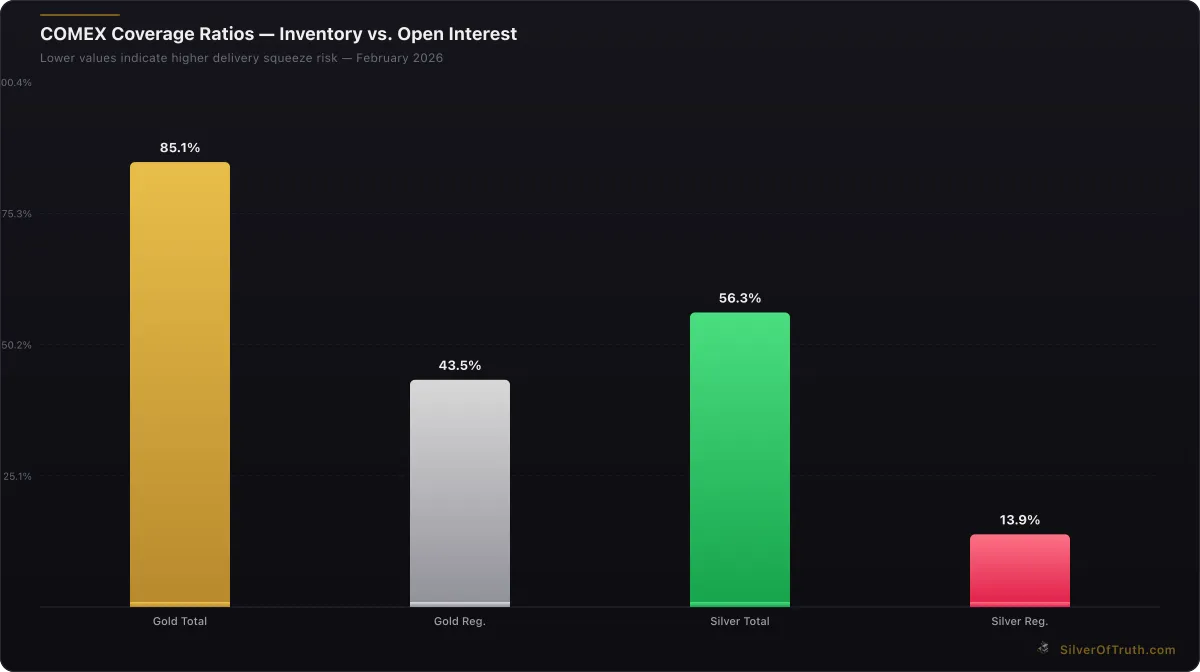
COMEX coverage ratios — lower values indicate higher delivery squeeze risk. Source: SilverOfTruth, February 2026
The relationship between open interest and price movements offers insights into market health and sustainability of trends. Rising prices with increasing open interest suggest healthy trend development with new participants joining the move. Falling open interest during price advances often indicates short covering rather than new buying, potentially limiting sustainability of rallies.
Current open interest of 133,641 contracts represents 668.2 million ounces of silver exposure, compared to COMEX registered inventory of 92.9 million ounces. This 7.2:1 ratio of paper to registered physical metal highlights the leverage inherent in futures markets and potential for delivery squeezes if significant contract holders demand physical settlement.
Weekly open interest changes provide trend context for positioning adjustments. The -9,539 contract decline represents a 6.7% reduction, indicating significant position unwinding. When combined with modest price strength, this suggests the reduction came primarily from profit-taking rather than stop-loss selling, maintaining underlying market structure integrity.
Historical Context and Extremes
Silver COT positioning exhibits cyclical patterns that provide valuable market timing signals when analyzed over multiple years. Historical extremes in commercial positioning often coincide with major turning points, though the timing can be imprecise due to markets' ability to remain at extreme positioning levels for extended periods.
The most significant commercial short positions typically exceed -80,000 contracts and often occur during price rallies as producers hedge increased production and industrial users secure supply. The March 2020 commercial short extreme of -95,000 contracts preceded silver's subsequent rally to above $28/oz. Conversely, commercial net positions approaching zero or turning positive often mark major bottoms, as seen in March 2020 and September 2022.
Speculative positioning extremes provide contrarian signals, though timing remains challenging. Speculative net longs exceeding +50,000 contracts typically coincide with near-term tops, while net shorts below -20,000 often mark bottoms. The August 2020 speculative extreme of +55,000 contracts preceded silver's peak near $30/oz, while the September 2022 extreme of -28,000 marked the cycle low near $17/oz.
Current positioning at moderate levels suggests silver markets aren't approaching extremes that typically precede major reversals. This neutral positioning environment often favors fundamental analysis and technical trading over contrarian COT signals, as the market becomes more responsive to supply/demand developments and less influenced by positioning imbalances.
COT Analysis Integration with Market Fundamentals
The COT report provides positioning insights that gain additional significance when combined with fundamental supply and demand analysis. Silver's industrial demand continues growing particularly in electronics and renewable energy applications, while mine supply faces constraints from declining ore grades and project development challenges.
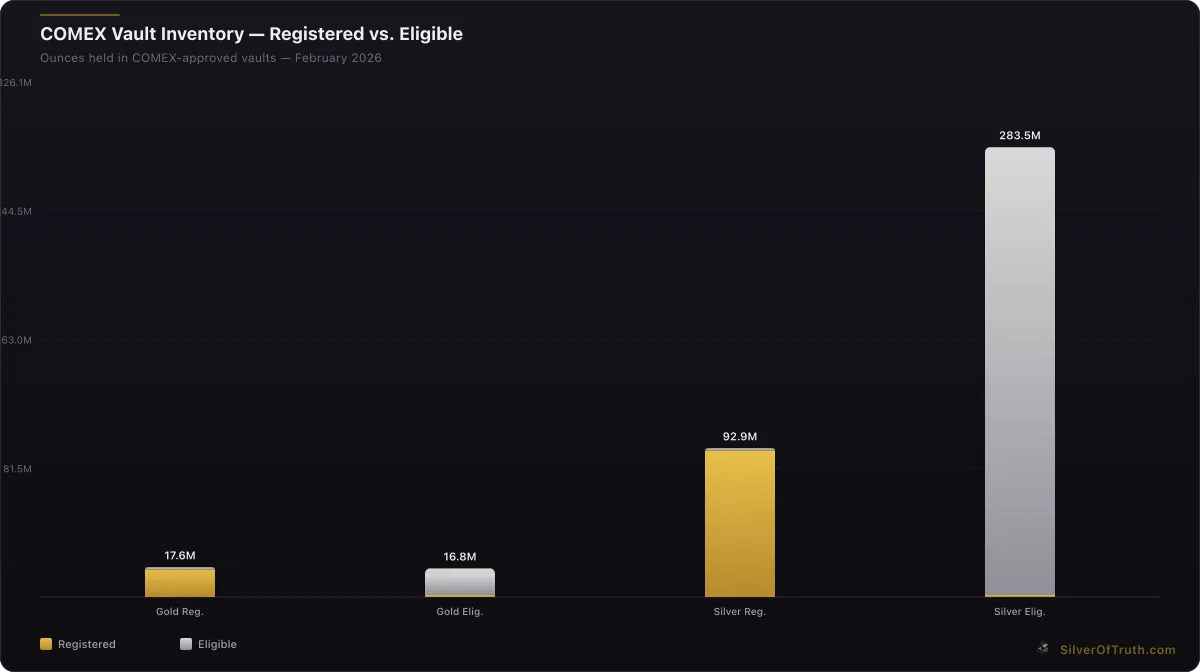
Source: SilverOfTruth COMEX data, February 2026
Current COMEX inventory dynamics show registered stocks at 92.9 million ounces with coverage ratios indicating potential delivery stress if significant contract holders demand physical settlement. The combination of moderate commercial short positioning and declining registered inventory creates a setup where physical supply constraints could impact paper market positioning.
Mining sector fundamentals provide additional context for commercial positioning changes. Rising all-in sustaining costs and project development challenges may limit producer hedging flexibility, potentially reducing commercial short positioning as mines prioritize cash flow over price risk management. This structural shift could alter traditional COT patterns over time.
The relationship between physical and paper silver markets becomes increasingly important as industrial demand grows and retail investment continues. COT positioning reflects paper market dynamics, but physical supply constraints can override positioning signals when delivery demands exceed warehouse capacity or when basis relationships become dislocated.
Trading Applications and Signal Generation
COT data serves multiple trading applications from timing entry and exit points to managing portfolio risk and understanding market structure. Commercial positioning provides the strongest contrarian signals, while speculative positioning offers insight into trend development and potential exhaustion points.
For timing applications, commercial positioning extremes historically provide better signals than moderate levels. When commercial shorts exceed -70,000 contracts, it often indicates approaching market tops as producers maximize hedging and industrial users secure supply. Conversely, commercial shorts below -20,000 contracts or net long positions typically coincide with major bottoms.
Speculative positioning momentum provides trend-following signals complementing contrarian commercial analysis. Rising speculative longs during uptrends confirm trend development, while speculative selling during advances suggests potential trend exhaustion. The key is distinguishing between healthy profit-taking and sentiment shifts that precede major reversals.
Risk management applications include position sizing based on positioning extremes and hedging strategies using COT patterns. Extreme positioning levels warrant reduced position sizes due to increased reversal probability, while moderate positioning allows larger allocations as markets become more responsive to fundamental developments.
Comparing Silver COT to Gold Patterns
Silver COT patterns differ significantly from gold COT dynamics, reflecting silver's dual role as precious metal and industrial commodity. Gold positioning typically shows more extreme speculative bullishness and commercial short positions due to its pure monetary role and investment demand patterns.
Current silver positioning at 17% of open interest contrasts with gold's often elevated speculative positioning above 30-40% of open interest. This difference reflects silver's industrial demand component, which provides fundamental support that moderates speculative positioning extremes. Industrial users provide natural buying demand that limits speculative bearish positioning.
Commercial positioning patterns also differ between metals. Silver commercials include significant industrial users who provide buying demand at lower prices, moderating commercial short extremes. Gold commercials consist primarily of producers and dealers, leading to more pronounced short positioning during rallies as hedging demand increases.
The correlation between COT patterns across precious metals provides additional market intelligence. When both gold and silver show extreme positioning in the same direction, it often indicates broad precious metals sentiment extremes. Divergent positioning suggests metal-specific factors may be driving relative performance.
Integration with Technical Analysis
COT positioning analysis gains enhanced value when combined with technical analysis, as positioning extremes often coincide with technical support and resistance levels. Commercial accumulation near technical support provides additional confirmation of potential bottoms, while speculative extremes at technical resistance suggest increased reversal probability.
Current silver positioning at moderate levels suggests technical factors may dominate near-term price action rather than positioning-based reversals. This environment favors traditional technical analysis tools including trend lines, moving averages, and chart patterns over contrarian COT signals.
Volume analysis provides additional confirmation of COT signals. Rising volume during commercial accumulation or speculative distribution confirms positioning changes reflect genuine sentiment shifts rather than temporary adjustments. Current declining open interest suggests position unwinding rather than new trend development.
Seasonal patterns interact with COT positioning to create enhanced timing signals. Silver's traditional strength in January-February often coincides with commercial covering and speculative accumulation, while weakness in June-July typically sees increased commercial hedging. Understanding these seasonal overlays improves COT signal interpretation.
Risk Factors and Limitations
COT analysis carries inherent limitations that traders must understand to avoid misinterpretation. Positioning extremes can persist longer than expected, leading to premature position entries when relying solely on contrarian signals. Markets can remain at extreme positioning levels for weeks or months before reversing.
The three-day reporting delay means COT data reflects Tuesday positions but isn't published until Friday afternoon, creating a gap where significant positioning changes may occur. During volatile periods, this delay can reduce signal effectiveness as markets move before positioning adjustments appear in reports.
Classification changes can distort positioning analysis when traders move between categories or new participants enter markets. The CFTC occasionally reclassifies traders, creating artificial positioning changes that don't reflect actual market sentiment shifts. Long-term analysis helps identify such distortions.
External factors including regulatory changes, margin adjustments, and market structure evolution can alter traditional COT relationships. The growing importance of ETF flows and algorithmic trading may be changing how positioning patterns relate to price movements, requiring ongoing adaptation of analysis frameworks.
Current Market Assessment
Silver's current COT positioning suggests balanced market dynamics without extreme positioning that typically precedes major reversals. Commercial net shorts of -42,163 contracts represent moderate hedging activity, while speculative net longs of +22,955 contracts indicate constructive but not excessive bullish sentiment.
The recent position adjustments through reduced speculative longs and improved commercial positioning suggest mutual profit-taking rather than directional sentiment shifts. Combined with declining open interest, this indicates consolidation following previous moves rather than new trend development.
With positioning at neutral levels and silver prices at $77.27 showing recent strength, the market appears positioned to respond to fundamental developments rather than positioning-based reversals. This environment favors analysis of industrial demand, mine supply, and broader economic factors over contrarian COT signals.
The combination of moderate positioning, declining inventory, and ongoing industrial demand growth creates a constructive backdrop for silver, though the lack of extreme positioning reduces the probability of major moves driven purely by position covering or liquidation.
FAQ Section
How often is the COT report published for silver? The CFTC publishes COT reports every Friday at 3:30 PM ET, reflecting positions held as of the previous Tuesday's close. This three-day delay means the data may not capture the most recent positioning changes, especially during volatile market periods.
What constitutes an extreme reading in silver COT positioning? Historical analysis shows commercial net shorts exceeding -70,000 contracts often coincide with market tops, while positions approaching zero or turning positive frequently mark bottoms. Speculative net longs above +50,000 contracts typically indicate crowded positioning that precedes corrections.
How do silver COT patterns differ from gold? Silver positioning typically shows less extreme readings due to industrial demand providing fundamental support. Silver commercials include industrial users who provide natural buying demand, moderating positioning extremes compared to gold's primarily producer-driven commercial category.
Can COT data predict silver price movements? COT data provides sentiment and positioning context but doesn't predict precise price movements or timing. Extreme positioning increases reversal probability but markets can remain at extremes longer than expected. COT analysis works best when combined with technical and fundamental analysis.
How does declining open interest affect COT signal reliability? Declining open interest during position changes suggests unwinding rather than new trend development. This reduces the reliability of contrarian signals as position changes may reflect profit-taking rather than sentiment shifts that precede major moves.
Conclusion
Understanding silver's COT report provides essential insights into market structure and positioning dynamics that complement fundamental and technical analysis. Current balanced positioning at moderate levels suggests the market will likely respond to supply/demand developments rather than positioning-based reversals, creating an environment where comprehensive analysis becomes particularly important.
The framework for analyzing silver COT data requires understanding the unique characteristics that differentiate silver from other precious metals, including industrial demand patterns and commercial participant diversity. Track these positioning patterns alongside inventory data and fundamental developments in the SilverOfTruth app — available on the App Store.
Disclaimer: This article is for informational and educational purposes only and does not constitute financial, investment, or trading advice. Past performance is not indicative of future results. Always conduct your own research and consult with a qualified financial advisor before making investment decisions. SilverOfTruth provides market data and analysis tools — it does not provide personalized financial advice.