
How do professional traders decode the massive COMEX gold market? The COT report gold analysis provides the most reliable window into institutional positioning, revealing the true sentiment behind gold's price movements. With current gold futures showing 404,391 contracts in open interest and commercials holding a net short position of -197,738 contracts, understanding these positioning dynamics has never been more critical.
The Commitment of Traders (COT) report, published weekly by the CFTC, dissects gold futures positioning into distinct trader categories. This framework transforms raw positioning data into actionable market intelligence, helping investors identify potential turning points before they appear in price action. Current gold COT analysis reveals elevated speculative positioning at 52.6% of open interest, while commercial hedgers maintain heavy short positions—a classic setup for market volatility.
This comprehensive guide will teach you to read COT reports like a professional, interpret positioning signals, and integrate this analysis into your precious metals strategy. Whether you're tracking commercial hedging patterns or speculative extremes, mastering gold positioning analysis provides a crucial edge in timing market entries and exits.
Understanding the COMEX Gold COT Report Structure
The CFTC divides gold futures traders into three primary categories, each revealing different market dynamics. Commercial traders represent the physical gold industry—miners, refiners, jewelry manufacturers, and dealers who use futures contracts to hedge actual gold exposure. These participants typically hold opposite positions to their physical inventory, creating the backbone of futures market liquidity.
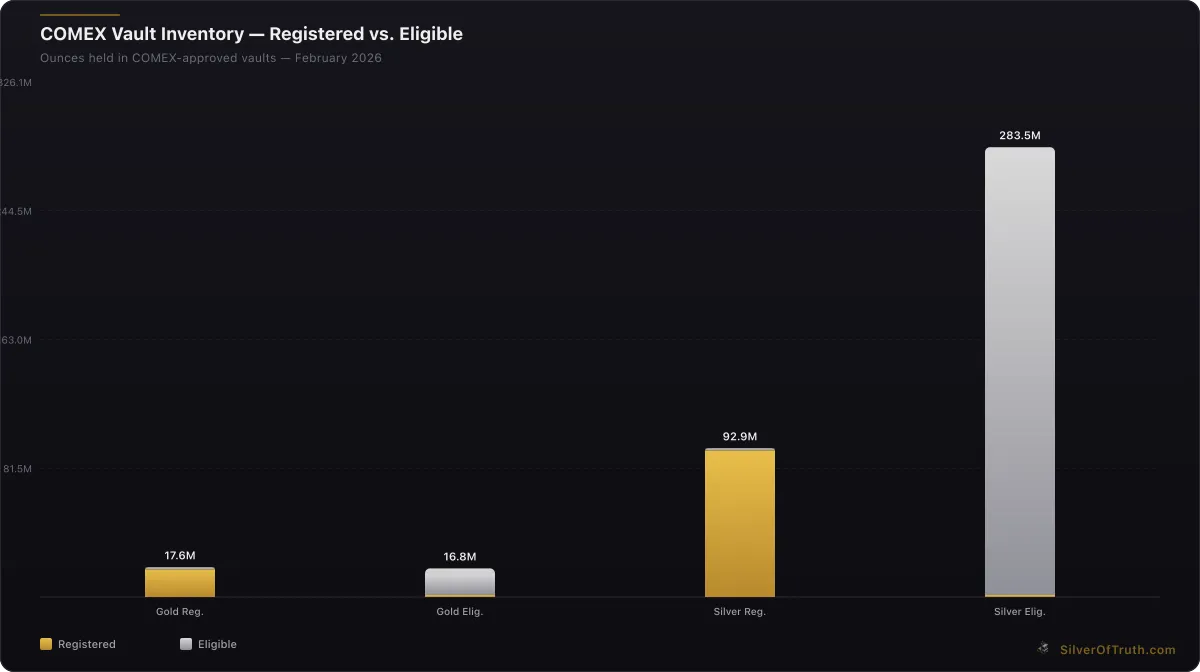
Source: SilverOfTruth COMEX data, February 2026
Non-commercial traders include hedge funds, pension funds, and commodity trading advisors who trade gold futures for speculative profit rather than hedging physical positions. This category captures the "smart money" trend-following institutions whose positioning often precedes major price moves. Their net positioning provides crucial insights into institutional sentiment and potential market direction.
Non-reportable traders encompass smaller participants whose individual positions fall below CFTC reporting thresholds. While their collective impact can be significant, their diffuse nature makes them less reliable for directional signals compared to the concentrated positions of large commercials and non-commercials.
The disaggregated COT report further separates commercial traders into Producer/Merchant, Swap Dealers, and Managed Money categories. Producer/Merchants represent actual gold producers and physical dealers, while Swap Dealers facilitate over-the-counter transactions and often hedge customer exposure in futures markets. Managed Money captures commodity index funds and systematic trading strategies.
Current positioning shows commercials long 88,738 contracts and short 286,476 contracts for a net position of -197,738 contracts. This heavy short bias reflects the natural hedging behavior of gold producers and dealers who sell futures to protect against price declines in their physical inventory. Understanding this structural dynamic is essential for accurate COT interpretation.
Commercial Positioning: The Foundation of COT Analysis
Commercial traders provide the most reliable contrarian signals in gold COT analysis because their positions reflect actual supply and demand fundamentals rather than speculative sentiment. When commercials increase their net short positions, they're typically responding to elevated prices by selling futures to hedge increased physical inventory values. Conversely, commercial buying often occurs near price bottoms when physical demand strengthens or speculative selling creates attractive hedging opportunities.
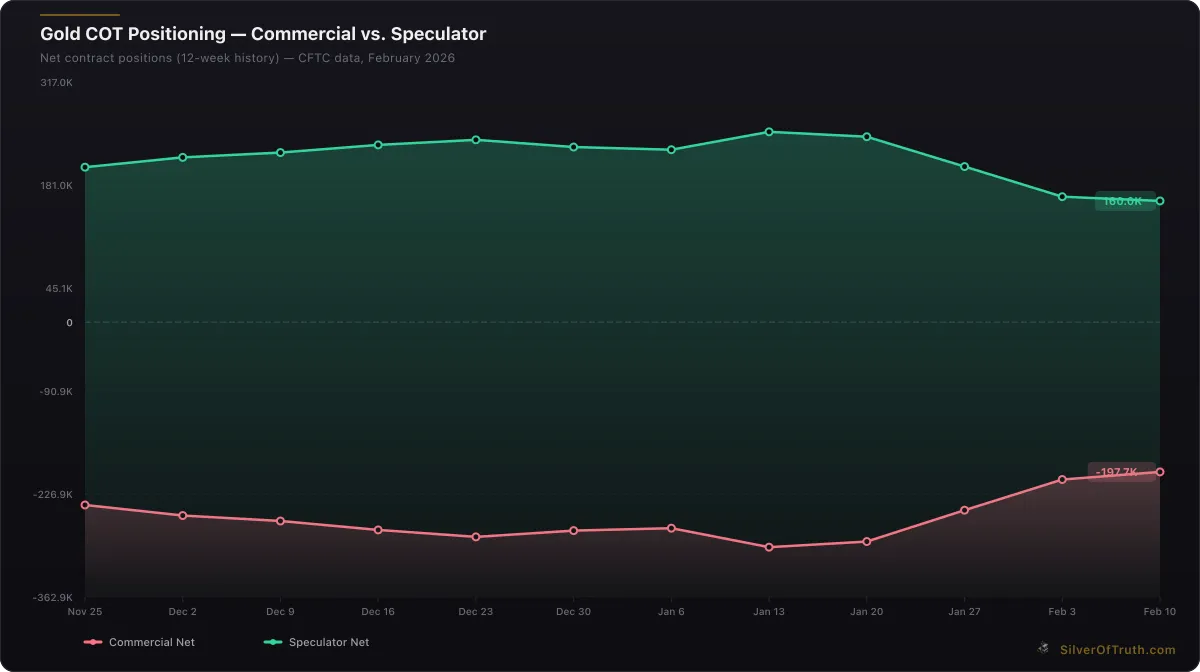
Gold COT positioning: commercial hedgers (red) vs. speculators (green). Source: CFTC via SilverOfTruth, February 2026
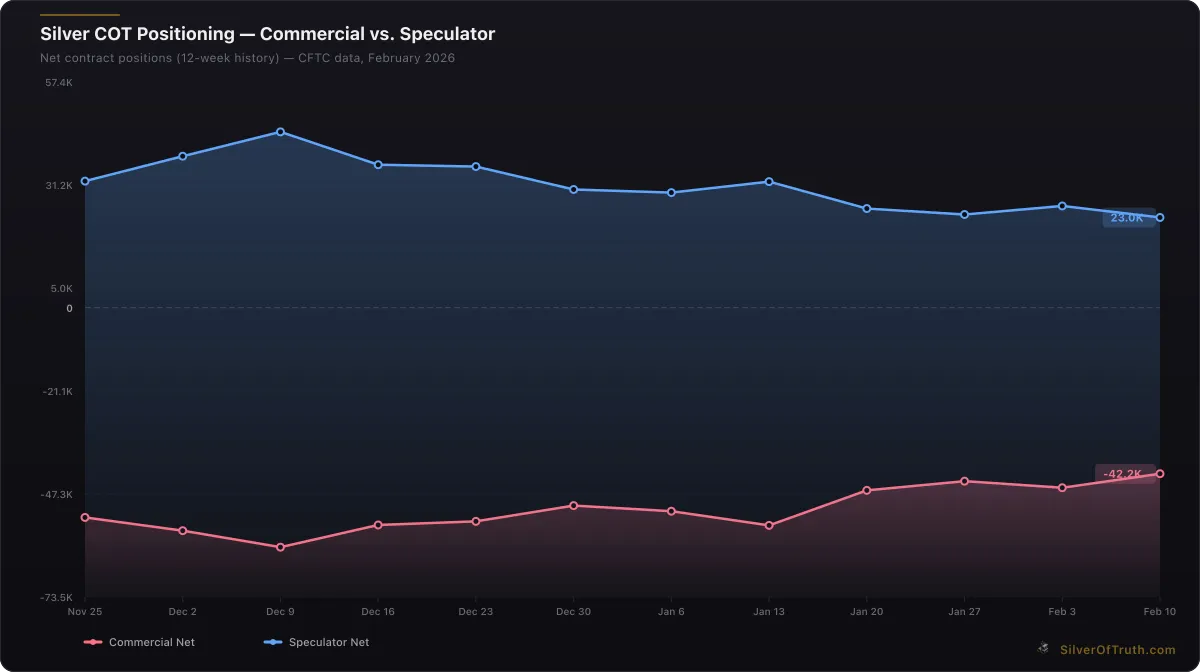
Silver COT positioning: commercial hedgers (red) vs. speculators (blue). Source: CFTC via SilverOfTruth, February 2026
The current commercial net short position of -197,738 contracts represents 48.9% of total open interest, indicating significant hedging activity. This week's improvement of +10,040 contracts (becoming less short) suggests either reduced producer hedging or increased physical dealer buying. Historical analysis shows commercial positioning extremes often coincide with major price turning points, making this metric crucial for timing decisions.
Swap dealer positioning within the commercial category provides additional insights into institutional flows. Currently holding a net short position of -179,293 contracts, swap dealers facilitate customer transactions and often reflect broader institutional sentiment. Their position changes can indicate shifting demand from pension funds, insurance companies, and other large institutions accessing gold markets through OTC products.
Producer/Merchant data would reveal direct mining company hedging activity, though current data shows zero positions in this subcategory. This absence might indicate either minimal direct producer hedging or classification of such activity under the broader commercial umbrella. Understanding these nuances helps separate true supply-side hedging from financial market positioning.
Commercial concentration ratios add another analytical layer. With the top 4 commercial shorts controlling 33.8% of short interest and top 8 holding 52.7%, positioning shows moderate concentration. This concentration level suggests manageable market risk without excessive dependence on a few large players, though sudden position changes by major commercials could still impact market dynamics significantly.
Speculative Positioning and Market Sentiment Analysis
Non-commercial positioning in gold futures serves as the primary gauge of speculative sentiment and trend-following behavior. Current net long positioning of +160,012 contracts represents 52.6% of open interest in long positions and 13.1% in shorts—a markedly bullish stance that reflects sustained institutional appetite for gold exposure.
This week's reduction of -5,592 contracts in net long positioning, combined with declining open interest of -5,303 contracts, signals profit-taking from previously bullish positions. The understanding of COT reports reveals this pattern typically occurs when speculators exit crowded trades, either due to technical signals or changing fundamental outlooks. Such distribution phases often precede period of consolidation or reversal.
Managed money positioning provides specific insight into hedge fund and systematic trading strategy deployment. With net long positions of +92,022 contracts showing minimal weekly change (-50 contracts), this category demonstrates remarkable stability despite broader speculative position adjustments. This stability might indicate strong conviction among professional money managers or systematic models maintaining predetermined allocations.
The relationship between speculative positioning and price action offers crucial timing insights. Current gold prices at $5,063.80 represent a 2.33% daily gain despite speculative position reduction, suggesting either strong physical demand or technical buying independent of futures positioning. This divergence between positioning flows and price action often signals important market transitions.
Speculative extremes historically coincide with major price reversals. When net speculative longs exceed 60% of open interest, markets often become vulnerable to sharp corrections as overleveraged positions face margin calls or profit-taking pressure. Current levels at 39.6% suggest elevated but not extreme positioning, indicating potential for further upside if fundamental catalysts emerge.
Coverage Ratios and Physical Market Integration
The interaction between COT positioning and COMEX inventory levels creates the coverage ratio framework essential for comprehensive gold positioning analysis. Current registered gold inventory of 17.58 million ounces provides coverage for 43.5% of outstanding contracts, representing a MEDIUM risk level that balances adequate supply with potential stress under increased delivery demand.
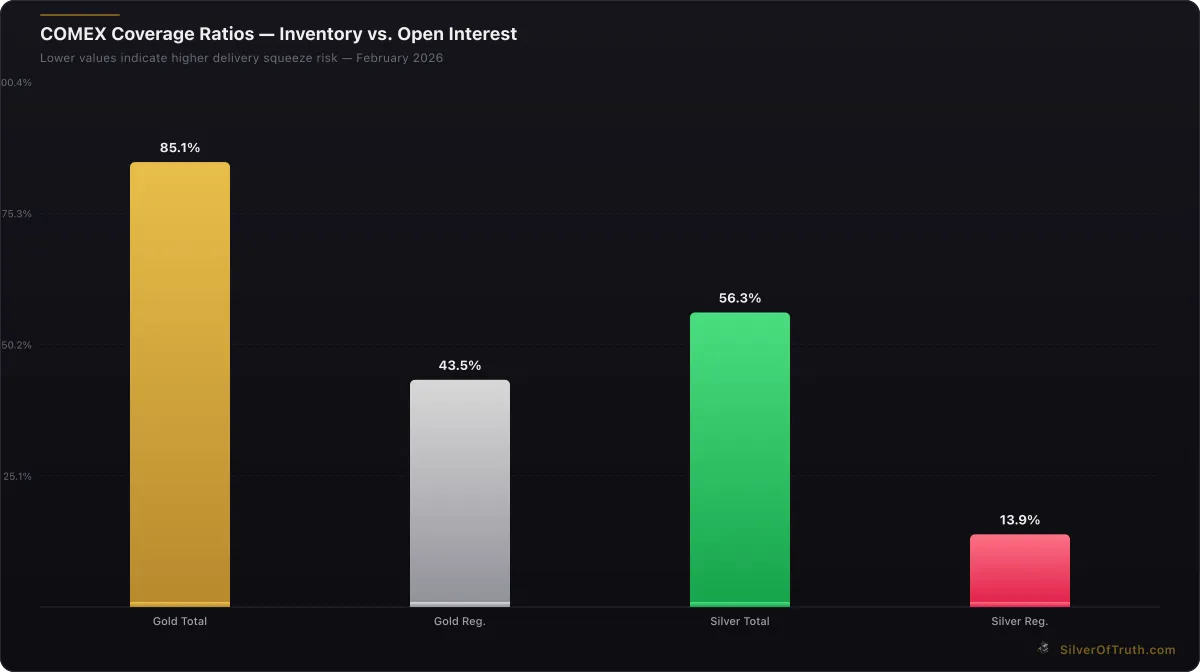
COMEX coverage ratios — lower values indicate higher delivery squeeze risk. Source: SilverOfTruth, February 2026
This coverage ratio directly impacts COT interpretation because physical delivery capability affects the sustainability of paper positioning. When coverage ratios decline below 40%, historically associated with delivery stress, commercial shorts face increased risk of delivery demands that could force position covering. Current levels suggest manageable but tightening physical supply that could amplify the impact of positioning changes.
The relationship between speculative net longs and physical inventory reveals market vulnerability to delivery-based squeezes. With speculators holding net long positions equivalent to 4.0 times registered inventory, any shift toward physical delivery could create significant supply pressure. This dynamic explains why commercial positioning becomes increasingly important as coverage ratios decline.
Recent inventory depletion of 4.76% monthly adds urgency to coverage analysis. As our COMEX registered vs eligible explained guide details, this drawdown rate could push coverage below 40% within quarters if sustained, potentially triggering delivery stress that forces rapid position adjustments across all trader categories.
Understanding how positioning interacts with physical flows provides crucial context for COT signal interpretation. Strong speculative positioning supported by adequate coverage suggests sustainable trends, while elevated positioning amid tightening physical supply often precedes volatile position adjustments as traders reassess delivery risk exposure.
Historical Context and Sentiment Indicators
Analyzing current gold COT analysis requires historical context to identify positioning extremes and their typical market implications. The current commercial net short position of -197,738 contracts falls within normal hedging ranges but shows concerning concentration when viewed against declining open interest and physical inventory depletion.
Historical patterns reveal commercial positioning extremes often precede major price movements by 2-6 weeks. The 2020 gold rally began when commercial shorts covered aggressively from extreme levels around -300,000 contracts, while the 2022 correction started as commercials reached maximum net short positions exceeding -250,000 contracts. Current levels suggest neither extreme bullish nor bearish positioning from the commercial perspective.
Speculative positioning cycles provide additional timing insight through momentum analysis. Current net speculative longs of +160,012 contracts represent moderate bullishness compared to historical extremes above +200,000 contracts seen at major tops. However, the recent reduction amid rising prices suggests early profit-taking that could either mark healthy consolidation or early distribution ahead of larger corrections.
The weekly sentiment reading of "BEARISH" reflects the combination of elevated speculative positioning with recent position reduction and declining open interest. This sentiment framework, derived from positioning momentum rather than absolute levels, helps identify short-term directional bias within longer-term trends.
Concentration ratios add historical context by revealing market structure changes over time. Current concentration levels show moderate risk distribution, unlike periods of extreme concentration that preceded major market dislocations. The physical vs paper silver analysis framework applies equally to gold, where concentrated paper positioning can amplify physical market movements.
Advanced COT Analysis Techniques
Professional gold positioning analysis extends beyond basic long/short ratios to incorporate sophisticated metrics that reveal subtle market dynamics. Position velocity measures the rate of positioning change over multiple timeframes, providing early signals of accelerating or decelerating trends. Current weekly changes show moderate deceleration in speculative accumulation, suggesting potential trend maturation.
Relative positioning analysis compares current levels to rolling averages and percentile rankings over various lookback periods. When speculative net longs exceed the 80th percentile of trailing two-year data, markets often become vulnerable to momentum reversals. Current positioning sits near the 65th percentile—elevated but not extreme by recent historical standards.
Cross-market positioning analysis examines gold COT data relative to silver, copper, and other commodity futures to identify sector-wide trends or gold-specific dynamics. Current silver positioning shows much lower speculative interest at 17% of open interest compared to gold's 40%, suggesting gold-specific bullishness rather than broad commodity speculation.
Open interest momentum provides crucial context for position changes. Declining open interest amid position adjustments typically signals distribution or liquidation, while rising open interest with position changes indicates fresh money entering existing trends. This week's -5,303 contract decline in open interest confirms the distribution narrative suggested by speculative position reduction.
The integration of COT data with gold silver ratio explained metrics reveals relative value opportunities. When gold positioning reaches extremes while silver remains balanced, ratio trades often provide better risk-adjusted returns than outright directional positions. Current data suggests such opportunities may be emerging as positioning diverges between the metals.
Trading Applications and Signal Generation
Converting COT report gold analysis into actionable trading signals requires systematic frameworks that account for signal reliability, timing, and risk management. Commercial positioning signals typically provide the most reliable intermediate-term directional guidance, with extreme commercial short covering historically preceding significant rallies within 4-8 weeks.
Current commercial position improvement of +10,040 contracts, while not yet indicating major covering, deserves monitoring for acceleration. Sustained weekly improvements exceeding +15,000 contracts often mark the beginning of major trend changes, as commercials adjust hedges in response to shifting supply/demand fundamentals or attractive price levels for physical accumulation.
Speculative position momentum offers shorter-term timing signals through overbought/oversold frameworks. When speculative position changes exceed +20,000 contracts weekly while maintaining elevated absolute levels, markets become vulnerable to profit-taking corrections. Conversely, speculative position reduction exceeding -25,000 contracts weekly often marks near-term selling exhaustion.
Divergence analysis between positioning flows and price action provides high-probability reversal signals. Current price strength amid speculative position reduction could either signal strong underlying demand that sustains trends despite position profit-taking, or early distribution before more significant corrections as overleveraged positions face pressure.
The combination of COT signals with how to evaluate mining stocks creates comprehensive precious metals strategies. When COT data suggests favorable gold positioning while mining stock valuations appear attractive, coordinated allocation across physical, futures, and equity exposure often provides optimal risk-adjusted returns.
Risk Assessment Through COT Metrics
Gold COT analysis provides essential risk management insights through positioning-based vulnerability assessments. Current speculative net long positioning equivalent to 4.0 times registered COMEX inventory creates potential delivery risk if any significant portion seeks physical settlement. While historically rare, such scenarios create dramatic price volatility as paper positions face physical supply constraints.
Position concentration risk emerges when large speculative positions coincide with concentrated commercial shorts. Current concentration ratios show the top 8 traders control 28.4% of long positions and 52.7% of short positions, indicating manageable but notable concentration. Sudden position changes by these large players could trigger cascading adjustments across other market participants.
Liquidity risk assessment combines positioning data with open interest trends to gauge market depth and resilience. Declining open interest amid position adjustments, as seen in current data, often indicates reduced market liquidity that amplifies price volatility. Traders should adjust position sizes and risk parameters during such periods to account for potentially wider bid-ask spreads and increased slippage.
Delivery cycle positioning adds temporal risk dimensions around monthly COMEX delivery periods. As detailed in our understanding COMEX inventory analysis, positioning extremes near first notice days often trigger elevated volatility as participants adjust positions to avoid unwanted delivery obligations or capitalize on delivery premiums.
The integration of coverage ratios with positioning metrics creates comprehensive risk frameworks. When speculative positioning exceeds 50% of open interest while coverage ratios fall below 50%, markets enter elevated risk zones where position adjustments can trigger significant price movements within days rather than weeks.
Integration with Market Fundamentals
Professional gold positioning analysis synthesizes COT data with broader fundamental factors to create comprehensive market assessments. Monetary policy positioning examines how Federal Reserve policy shifts influence both commercial hedging behavior and speculative positioning patterns. Current elevated positioning occurs amid expectations of continued monetary accommodation, supporting sustained institutional gold allocation.
Geopolitical risk assessment considers how global tensions affect positioning patterns across trader categories. Commercial hedgers often increase short positions during geopolitical stress as physical demand drives prices higher, requiring additional hedge protection. Current moderate commercial positioning suggests either limited geopolitical premium or effective hedging at higher price levels.
Currency correlation analysis reveals how dollar strength or weakness influences positioning dynamics. Strong dollar periods typically see reduced speculative gold positioning as opportunity costs increase, while dollar weakness often coincides with speculative accumulation. Monitoring these correlations helps predict positioning shifts before they appear in COT data.
Inflation expectations directly impact both commercial and speculative positioning decisions. Rising inflation expectations typically drive speculative accumulation while prompting commercial hedgers to adjust positions based on changing physical market dynamics. Current positioning reflects moderate inflation concerns rather than crisis-level expectations.
The synthesis of COT data with supply/demand fundamentals creates the most reliable analytical framework. Our silver supply deficit explained methodology applies equally to gold, where positioning extremes gain significance when supported by fundamental supply constraints or demand surges.
FAQ Section
What does the COT report tell us about gold prices? The COT report reveals institutional positioning that often precedes price movements by 2-6 weeks. Commercial positioning provides the most reliable contrarian signals, while speculative positioning indicates momentum and potential reversal points. Current data shows elevated but not extreme speculative positioning with moderate commercial hedging, suggesting balanced near-term outlook.
How do I interpret commercial vs non-commercial positioning in gold? Commercial traders (miners, dealers, hedgers) typically take contrarian positions, buying near bottoms and selling near tops. Non-commercial traders (hedge funds, speculators) follow trends. Extreme commercial short positions often mark price tops, while extreme commercial long positions suggest bottoms. Current commercial net shorts at -197,738 contracts indicate moderate hedging activity.
What is considered extreme positioning in gold COT reports? Historical extremes occur when speculative net longs exceed 60% of open interest or commercial net shorts exceed -250,000 contracts. Current speculative positioning at 40% of open interest represents elevated but not extreme levels. Extreme positioning typically coincides with major price reversals within 4-8 weeks.
How does COMEX inventory affect COT analysis? COMEX inventory provides physical backing for paper positions, creating coverage ratios that affect positioning sustainability. Current coverage of 43.5% represents adequate but tightening supply. When coverage falls below 40%, positioning extremes become more significant as delivery risk increases, often forcing rapid position adjustments.
Can COT data predict gold price direction? COT data provides probabilistic rather than predictive insights. Commercial positioning extremes have historically preceded major reversals with 70-80% accuracy over 2-6 week periods. Current data suggests neutral to slightly bearish near-term bias due to elevated speculative positioning amid declining open interest, though no extreme levels suggest limited reversal risk.
Understanding COT report gold analysis transforms raw positioning data into actionable market intelligence that professional traders use to time entries, exits, and risk management decisions. The current market presents elevated speculative positioning at 52.6% of open interest balanced by moderate commercial hedging, suggesting potential consolidation rather than extreme directional moves.
The integration of positioning analysis with physical market dynamics, through coverage ratios and inventory trends, provides comprehensive frameworks for assessing market vulnerability and opportunity. Current coverage levels at 43.5% support existing positioning while monthly inventory depletion adds longer-term supply constraints that could amplify future positioning adjustments.
Master these gold positioning analysis techniques by consistently monitoring weekly COT releases, tracking positioning momentum alongside price action, and integrating fundamental factors that drive both commercial hedging and speculative allocation decisions. The SilverOfTruth app provides real-time COT analysis with AI-powered insights to streamline this complex but essential analytical process—available now on the App Store.
Disclaimer: This article is for informational and educational purposes only and does not constitute financial, investment, or trading advice. Past performance is not indicative of future results. Always conduct your own research and consult with a qualified financial advisor before making investment decisions. SilverOfTruth provides market data and analysis tools — it does not provide personalized financial advice.