
A silver supply deficit occurs when annual demand for silver exceeds the available supply from mining and recycling—a situation that has persisted for four consecutive years. This structural imbalance stems from explosive growth in industrial applications like solar panels and electric vehicles consuming record amounts of silver, while mine production struggles to keep pace. From 2020 through 2026, this deficit has averaged over 200 million ounces annually according to Silver Institute data, creating the largest sustained shortfall in decades. Unlike temporary market disruptions, this represents a fundamental shift in how silver is consumed and valued in the modern economy, systematically drawing down above-ground inventories.
What Is a Silver Supply Deficit?
A silver supply deficit represents the fundamental imbalance between how much silver the world produces versus how much it consumes each year. Unlike financial markets where prices can fluctuate based on sentiment, physical commodity deficits reflect real-world consumption patterns that create measurable inventory drawdowns.
The deficit calculation is straightforward: total annual demand minus total annual supply. Demand includes industrial applications (electronics, solar panels, medical devices), jewelry, silverware, coins and bars purchased by investors. Supply comes from three primary sources: newly mined silver, recycled silver from scrap, and government stockpile sales.
When demand exceeds supply, the shortfall must come from somewhere—typically from above-ground inventories held by refiners, dealers, and exchange warehouses. This inventory draw creates upward pressure on prices as available stocks dwindle relative to consumption needs.
The current deficit differs from historical shortfalls in both magnitude and persistence. Previous deficits typically lasted one to two years before supply adjustments or demand destruction restored balance. The 2020-2026 period represents the longest sustained deficit since reliable data collection began in the 1990s.
Industrial applications drive most of the current imbalance. Unlike investment demand, which can surge and retreat based on market sentiment, industrial demand follows technological deployment cycles that span decades. Solar panel installations, electric vehicle production, and 5G infrastructure buildouts create steady, predictable silver consumption that mining companies struggle to match.
Understanding this deficit requires examining both sides of the equation. Supply constraints stem from depleting ore grades, environmental regulations, and the long lead times required to develop new mining projects. Demand acceleration reflects the global energy transition and technological advancement that positions silver as a critical material for the 21st century economy.
What Are the Numbers Behind Four Years of Silver Deficits?
The Silver Institute's World Silver Survey provides the definitive data on global supply and demand imbalances. The numbers reveal a deficit that has deepened each year, creating cumulative inventory drawdowns exceeding 800 million ounces since 2020.
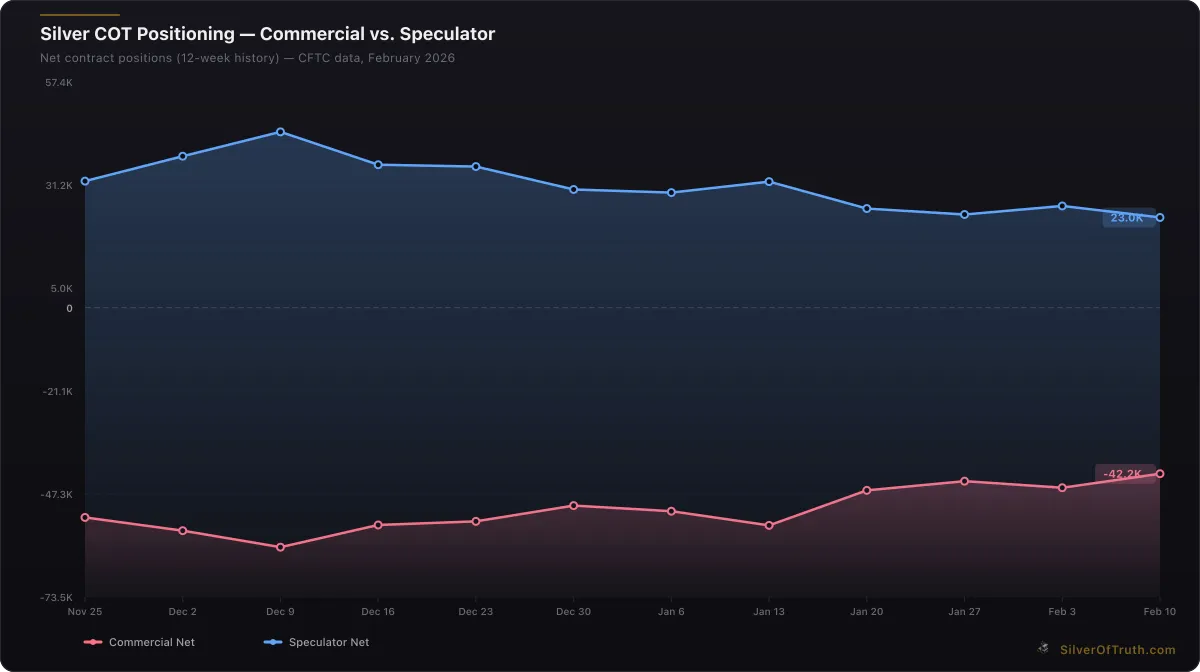
Silver COT positioning: commercial hedgers (red) vs. speculators (blue). Source: CFTC via SilverOfTruth, February 2026
2020: Demand totaled 1.033 billion ounces while supply reached only 991.8 million ounces, creating a 41.2 million ounce deficit. This initial gap reflected COVID-19 disruptions to mine production combined with surging electronics demand as remote work accelerated digital device adoption.
2021: The deficit expanded to 51.8 million ounces as industrial demand recovered faster than mining output. Solar panel installations reached record levels globally, consuming over 140 million ounces—a 12% increase from pre-pandemic levels according to Silver Institute industrial demand data.
2022: Supply constraints intensified as inflation and energy costs pressured mining operations. The deficit reached 237.7 million ounces, the largest annual shortfall in three decades. Investment demand also accelerated as inflation fears drove record purchases of silver coins and bars.
2023: Despite new mine projects coming online, the deficit persisted at 142.1 million ounces. Electric vehicle production crossed critical mass thresholds, with each EV containing approximately 25-50 grams of silver for electrical systems and charging infrastructure.
2024: Preliminary data suggests a deficit near 200 million ounces as renewable energy deployment maintained its aggressive pace. Solar installations alone consumed an estimated 185 million ounces—more than 20% of total global silver supply.
2026 Projections: Industry analysts forecast the deficit could reach 250-300 million ounces based on current demand trajectories. The COMEX silver inventory reflects this tightness, with registered stocks at 92.9 million ounces—down significantly from pre-deficit levels above 150 million ounces.
These cumulative deficits total approximately 825 million ounces drawn from global inventories over six years. To put this in perspective, the entire COMEX silver warehouse system currently holds 376.4 million total ounces across all categories.
The persistence of these deficits challenges traditional commodity market assumptions. Typically, sustained shortfalls trigger price increases that stimulate additional supply and reduce demand, restoring balance. Silver's unique properties—irreplaceable in many industrial applications—limit demand destruction even at higher prices.
Mining companies face 5-10 year development timelines for new silver projects, creating supply response lags that extend deficit periods. Meanwhile, technological transitions like the shift to renewable energy create structural demand increases that compound annually rather than plateau.
How Is Industrial Demand Reshaping Silver Consumption?
Industrial applications now dominate silver consumption, representing approximately 60% of total annual demand compared to just 40% two decades ago. This shift reflects silver's unique combination of electrical conductivity, thermal properties, and antimicrobial characteristics that make it indispensable for modern technology.
Solar Panel Revolution: Photovoltaic cells consume the largest portion of industrial silver, with each panel requiring 15-20 grams of silver paste for electrical connections. Global solar installations reached 280 gigawatts in 2025 according to the International Energy Agency, translating to approximately 185 million ounces of silver consumption.
The solar industry's growth trajectory remains exponential rather than linear. China alone installed 120 GW of solar capacity in 2025, while the United States added 40 GW. Our detailed analysis of silver solar panel demand explores how government renewable energy mandates ensure continued acceleration through 2030.
Electric Vehicle Expansion: Each electric vehicle contains 25-50 grams of silver depending on battery size and configuration. Luxury EVs with advanced driver assistance systems can contain up to 100 grams. With global EV sales exceeding 15 million units in 2025 and projected to reach 30 million by 2030, automotive silver consumption approaches 50 million ounces annually.
Charging infrastructure multiplies this demand. Each Level 3 fast-charging station requires 5-10 ounces of silver for high-current electrical components. The Biden administration's goal of 500,000 charging stations by 2030 alone represents 2.5-5 million additional ounces of demand. Our comprehensive guide to silver EV demand details these consumption patterns.
5G and Telecommunications: Next-generation wireless networks rely heavily on silver-based components for signal transmission and processing. Each 5G base station contains 3-5 ounces of silver, while 5G-enabled smartphones use 40% more silver than 4G predecessors. Global 5G infrastructure buildouts consume an estimated 25 million ounces annually.
Medical and Healthcare Applications: Silver's antimicrobial properties make it essential for medical devices, wound dressings, and hospital equipment. The COVID-19 pandemic accelerated adoption of silver-based antimicrobial surfaces in healthcare facilities. Medical silver consumption has grown 15% annually since 2020, reaching 30 million ounces in 2025.
Electronics and Semiconductors: Traditional electronics applications continue growing as global semiconductor production increases. Silver paste for integrated circuits, RFID tags, and printed circuit boards consume approximately 75 million ounces annually. The Internet of Things and smart device proliferation ensure steady demand growth.
This industrial demand differs fundamentally from investment demand in its price inelasticity. Solar panel manufacturers and automakers cannot easily substitute other metals for silver's unique properties. Even at $100 per ounce, silver represents less than 2% of a solar panel's total cost, making demand relatively insensitive to price fluctuations.
The technological transition creating this demand operates on decade-long cycles. Countries have committed to carbon neutrality targets between 2030-2050, ensuring sustained industrial silver consumption regardless of short-term price movements or economic cycles.
Why Is Silver Mine Supply Declining Despite Higher Prices?
Silver mine production faces structural headwinds that prevent supply from responding to higher prices as traditional economic theory would predict. The unique characteristics of silver mining—primarily as a byproduct of other metals—create supply constraints that higher prices alone cannot easily resolve.
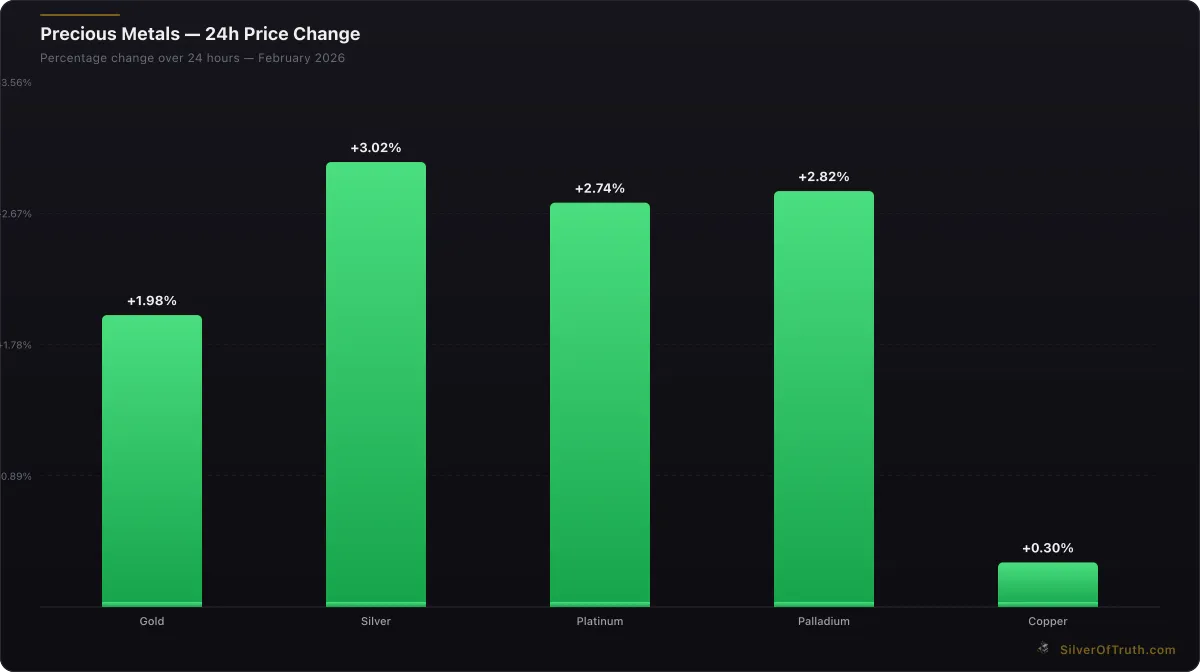
24-hour precious metals price changes. Source: SilverOfTruth, February 2026
Byproduct Economics: Approximately 70% of silver comes as a byproduct from copper, lead, zinc, and gold mines. This means silver production depends heavily on the economics of primary metals rather than silver prices themselves. When copper prices struggle or lead mines become uneconomical, silver output falls regardless of silver's own price performance.
Recent data from the U.S. Geological Survey shows global silver mine production peaked at 870 million ounces in 2016 and has plateaued around 830-850 million ounces annually since 2020. Despite silver prices rising from $15 to over $77 during this period, mine output has not increased proportionally.
Declining Ore Grades: Silver ore grades have fallen consistently over the past three decades as easier, higher-grade deposits become exhausted. The average grade of silver ore mined globally has dropped from 12 ounces per ton in 1990 to approximately 6 ounces per ton in 2025. This means miners must process twice as much rock to produce the same amount of silver.
Major silver-producing regions like Mexico's Fresnillo mine and Peru's Cerro Rico district show clear evidence of grade decline. Miners compensate by processing larger volumes, but this increases energy costs, equipment wear, and environmental impact per ounce of silver produced.
Environmental and Regulatory Constraints: Silver mining operations face increasingly strict environmental regulations that limit expansion and increase costs. Water usage restrictions in arid regions like Chile's Atacama Desert constrain production capacity. Permitting processes for new mines now average 7-10 years in developed countries.
The European Union's critical minerals strategy emphasizes reducing dependence on imports through recycling rather than domestic mining expansion. Similar policies in North America prioritize environmental protection over resource extraction, creating long-term supply headwinds.
Capital Allocation Challenges: Mining companies increasingly focus on larger, longer-life operations rather than marginal silver projects. Investors prefer copper and gold mines with 20+ year lifespans over silver projects that might exhaust reserves in 8-12 years. This capital allocation pattern reduces investment in new silver capacity.
Energy and Input Cost Inflation: Mining is energy-intensive, with electricity and diesel fuel representing 20-30% of operating costs. Inflation in energy prices since 2020 has disproportionately impacted silver mining, where lower metal values provide less cushion against cost increases compared to gold operations.
Geopolitical Risks: Major silver-producing countries including Mexico, Peru, Bolivia, and Argentina face political instability that discourages mining investment. Resource nationalism—government efforts to capture more mining profits through taxation or nationalization—creates additional uncertainty for international mining companies.
The result is a supply response lag that extends deficit periods. Even if silver prices rise to $100+ per ounce, bringing new mines online requires 5-10 years from initial exploration through production. Existing mines face constraints from ore grade decline and regulatory restrictions that limit output increases.
This supply inelasticity creates a different market dynamic than most commodities experience. Higher prices typically incentivize increased production, but silver's byproduct nature and long development timelines prevent rapid supply adjustments. The current deficit could persist for years even with continued price appreciation.
How Much Silver Remains in Above-Ground Inventories?
Above-ground silver inventories represent the crucial buffer between supply deficits and market disruptions. These stockpiles—held in exchange warehouses, dealer vaults, government reserves, and private storage—provide the physical metal needed to satisfy demand when annual production falls short.
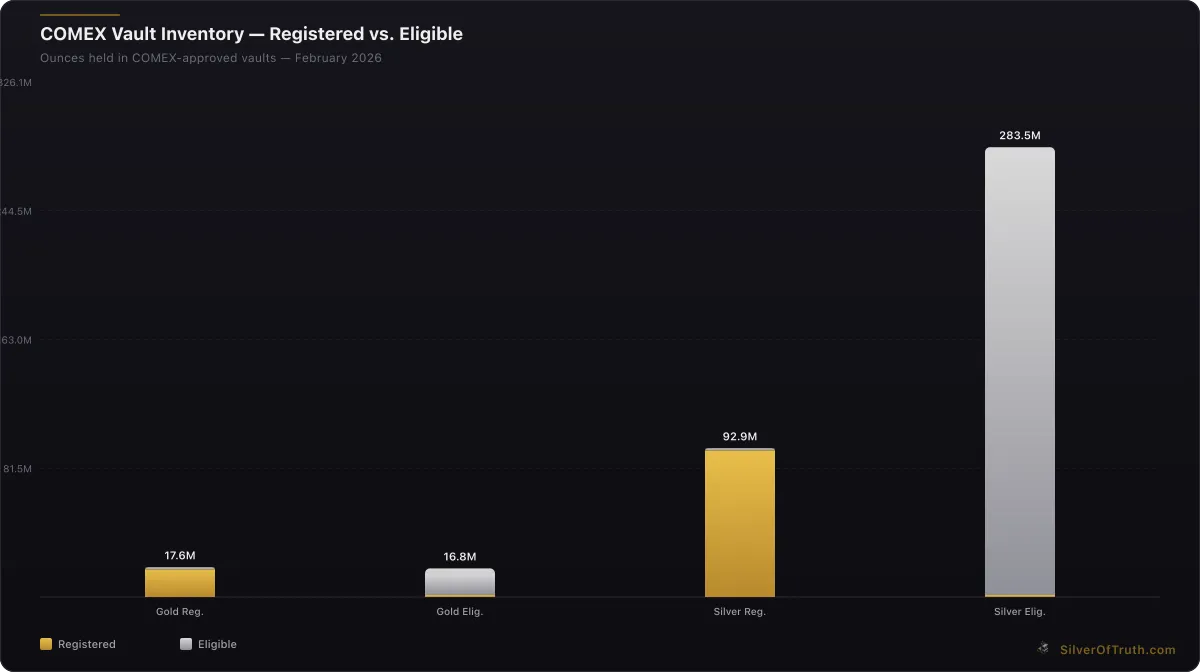
Source: SilverOfTruth COMEX data, February 2026
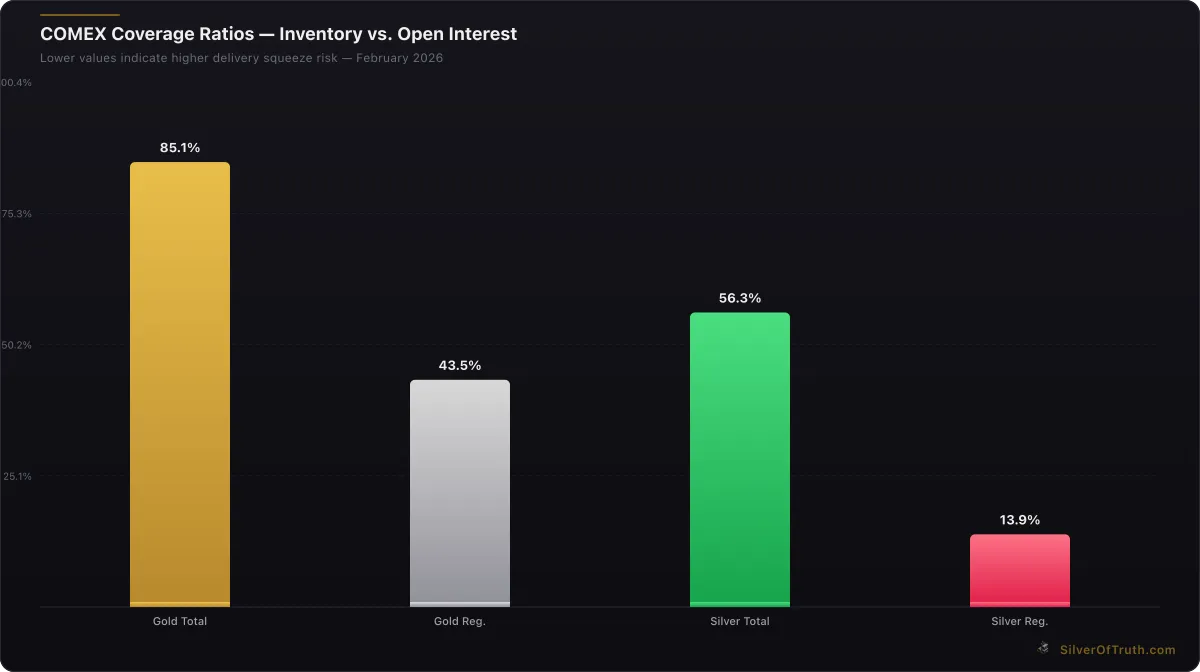
COMEX coverage ratios — lower values indicate higher delivery squeeze risk. Source: SilverOfTruth, February 2026
Exchange-Traded Silver: The largest visible inventories reside in exchange-traded funds and precious metals exchanges. The COMEX silver warehouse system currently holds 376.4 million ounces across registered and eligible categories, with registered stocks at 92.9 million ounces available for immediate delivery.
London Bullion Market Association (LBMA) vaults contain an estimated 1.1 billion ounces of silver, though much of this represents ETF holdings and institutional storage rather than readily available market supply. The iShares Silver Trust (SLV) alone holds approximately 650 million ounces, while other silver ETFs collectively add another 300-400 million ounces.
Government Stockpiles: Unlike gold, most governments no longer maintain strategic silver reserves. The United States eliminated its Defense Logistics Agency silver stockpile through sales completed in 2015. China maintains undisclosed silver reserves, but recent data suggests these stockpiles have declined through industrial allocation programs.
Historical government stockpiles provided significant market supply during the 1980s and 1990s, totaling over 2 billion ounces of disposals. The elimination of these reserves removes a major source of above-ground supply that previously helped balance deficits.
Scrap and Recycling Supply: Silver recycling provides approximately 180-200 million ounces annually, representing roughly 20% of total supply. However, recycling rates have plateaued as easily recoverable sources become exhausted. Jewelry and silverware recycling depends on silver prices, but industrial recycling faces technical and economic constraints.
Electronic waste recycling could provide additional silver supply, but current recovery rates remain low. Each smartphone contains approximately 0.034 ounces of silver, while computers contain 0.5-1 ounce. With billions of devices disposed annually, electronic recycling represents significant potential supply—if extraction becomes economically viable.
Private Holdings and Investment: Retail investors and institutions hold substantial silver inventories in coins, bars, and allocated storage accounts. These holdings are difficult to quantify but likely exceed 2-3 billion ounces globally. However, private holdings typically exhibit strong hands behavior, with owners reluctant to sell during supply crunches.
Our analysis of above-ground silver estimates total above-ground inventories at 6-8 billion ounces, but most of this silver is held in forms that don't readily return to the market. Industrial applications consume silver permanently—solar panels, electronics, and medical devices don't return their silver to circulation.
Inventory Drawdown Trends: Exchange inventories show clear declining trends that reflect ongoing supply deficits. COMEX registered silver stocks averaged 180-200 million ounces before the current deficit cycle began in 2020. The decline to current levels near 93 million ounces represents a 50% reduction in readily available supply.
Similar patterns appear in dealer inventories and retail premiums. Bullion dealers report longer delivery times and higher premiums, indicating tight supply conditions throughout the distribution chain. Our premium tracker tool shows retail silver premiums have doubled since 2020, reflecting supply chain stress.
Critical Threshold Analysis: Market analysts debate what inventory levels might trigger supply disruptions. Some suggest COMEX registered stocks below 50 million ounces could create delivery difficulties, while others point to the total COMEX inventory as the key metric.
The current registered silver coverage ratio of 13% against open interest indicates potential delivery stress if physical demand accelerates. Historical episodes of supply tightness, such as the 1979-1980 period, saw registered stocks fall below 30 million ounces before market disruptions occurred.
Above-ground inventories provide the crucial link between supply deficits and price discovery. As these stockpiles decline, markets become increasingly sensitive to demand fluctuations and supply disruptions. The question isn't whether inventories will decline—ongoing deficits ensure continued drawdowns—but rather how low they can fall before creating significant market stress.
What Does the Silver Supply Deficit Mean for Prices?
The persistent silver supply deficit creates multiple pathways for price appreciation, though the timeline and magnitude depend on how quickly above-ground inventories decline and whether supply constraints intensify. Market dynamics suggest the deficit's price impact may accelerate as readily available stocks approach critical thresholds.
Historical Deficit Episodes: Previous supply deficits provide instructive examples of price behavior patterns. The 1979-1980 period saw silver prices rise from $6 to over $50 per ounce as supply disruptions combined with investment demand. While current conditions differ significantly, the episode demonstrates silver's price sensitivity to physical supply constraints.
The 2008 financial crisis created a brief supply deficit that contributed to silver's rise from $9 to $21 per ounce by 2011. However, that deficit lasted only two years before mine supply adjustments restored balance. The current deficit's four-year duration suggests more sustained price support.
Price Discovery Mechanisms: Silver prices primarily discover value through futures markets on COMEX and London, where financial flows often overwhelm physical supply and demand signals. However, as physical inventories decline, paper market pricing becomes increasingly disconnected from underlying fundamentals.
Exchange inventory levels serve as key price discovery points. When COMEX registered stocks fell below 100 million ounces in late 2022, silver prices accelerated from $20 to over $30. The current level near 93 million ounces suggests continued upward pressure if inventory drawdowns persist.
Demand Inelasticity Advantages: Unlike many commodities, silver's industrial applications exhibit low price elasticity. Solar panel manufacturers cannot easily substitute copper or aluminum for silver's unique electrical properties. This demand inelasticity means higher prices don't significantly reduce consumption, maintaining deficit pressures.
Investment demand adds another dimension to price dynamics. As industrial deficits become more widely recognized, investor interest in silver as a supply-constrained asset could accelerate. Physical silver investments through coins, bars, and ETFs directly compete with industrial users for available supply.
Supply Response Limitations: Traditional commodity cycles assume higher prices stimulate increased production, eventually restoring balance. Silver's supply response faces unique constraints that could extend the current deficit's price impact:
- Byproduct nature limits production increases
- Long mine development timelines delay supply responses
- Environmental regulations restrict expansion
- Declining ore grades increase production costs
- Limited recycling potential from permanent industrial uses
Price Target Scenarios: Conservative scenarios based on historical deficit episodes suggest silver could reach $100-120 per ounce if current supply constraints persist. More aggressive scenarios, assuming accelerating industrial demand and continued inventory drawdowns, point toward $150-200 price targets.
These projections assume no major demand destruction or supply discoveries. Black swan events—such as technological breakthroughs in silver recycling or economic recession reducing industrial demand—could alter the trajectory significantly.
Risk Factors and Considerations: Several factors could limit the deficit's price impact:
- Economic recession reducing industrial demand
- Technological substitution in key applications
- Government stockpile releases (though limited quantities remain)
- Mine supply surprises from higher prices incentivizing production
- Investor selling pressure if prices rise too rapidly
Current market conditions favor deficit-driven price appreciation. Industrial demand shows no signs of slowing, while supply constraints appear to be intensifying rather than improving. The key question is whether above-ground inventories can satisfy demand long enough for supply adjustments to restore balance.
Why Should Investors Track Silver Supply Fundamentals?
Understanding silver supply and demand dynamics provides crucial insights for investment timing, portfolio allocation, and risk management decisions. Unlike purely financial assets, physical commodities like silver exhibit price behavior directly linked to real-world consumption patterns that create predictable investment opportunities.
Investment Timing Advantages: Tracking supply deficits helps identify optimal entry and exit points for silver investments. The current deficit cycle began in 2020 when silver traded near $15 per ounce. Investors who recognized the emerging supply constraints early benefited from price appreciation to current levels above $77.
Supply deficit analysis also helps avoid common investment mistakes. During the 2011 silver peak near $50 per ounce, supply fundamentals suggested the price spike was driven by speculation rather than physical shortages. Investors who understood the underlying supply balance avoided buying at unsustainable levels.
Portfolio Diversification Benefits: Silver's industrial demand profile creates different risk-return characteristics compared to gold or traditional financial assets. While gold primarily serves as a monetary store of value, silver's industrial applications provide demand support that's less correlated with financial market cycles.
The current supply deficit adds defensive characteristics to silver investments. Even if financial markets weaken, ongoing industrial demand for solar panels, electric vehicles, and electronics provides price support that pure investment metals might lack during risk-off periods.
Risk Management Considerations: Supply deficit analysis helps investors understand potential downside scenarios and position sizing decisions. The current deficit's persistence over four years suggests strong fundamental support, but investors should consider how economic recession or technological substitution might impact demand.
Geographic diversification also benefits from supply analysis. Countries leading the energy transition—particularly China, the United States, and European Union—drive much of the industrial silver demand. Investment exposure to silver provides indirect participation in these technological transitions.
Monitoring Key Indicators: Successful silver investing requires tracking multiple supply and demand indicators:
- Monthly COMEX inventory changes (available through our inventory tracker)
- Silver Institute quarterly demand reports
- Solar panel and EV production statistics
- Mining company production guidance
- Government policy announcements affecting renewable energy
Long-Term Investment Thesis: The structural nature of the current supply deficit creates a compelling long-term investment thesis. Unlike cyclical commodity shortages that resolve within 2-3 years, the technological transitions driving silver demand operate on decade-long timelines.
Government commitments to carbon neutrality by 2030-2050 ensure sustained industrial silver consumption regardless of short-term economic cycles. This demand visibility, combined with constrained supply responses, suggests the current deficit could persist for years rather than months.
Implementation Strategies: Investors can implement silver supply deficit themes through multiple vehicles:
- Physical silver coins and bars for direct exposure
- Silver mining stocks for leveraged exposure to higher prices
- Silver ETFs for liquid, cost-effective exposure
- Silver futures for sophisticated investors seeking precise timing
Each approach offers different risk-return profiles and liquidity characteristics. Physical silver provides direct deficit exposure but requires storage and insurance. Mining stocks amplify price movements but add company-specific risks. ETFs offer convenience but may face supply constraints during extreme shortages.
The key insight is that supply deficit analysis provides a fundamental anchor for silver investment decisions. While short-term price movements reflect various factors, the underlying supply-demand imbalance creates a long-term price floor that supports investment positions through market volatility.
Understanding these fundamentals helps investors maintain conviction during inevitable price corrections and identify opportunities to add exposure when sentiment weakens but underlying supply constraints remain intact. For those seeking to understand the complete picture of silver's investment case, our comprehensive silver investing guide provides additional analysis of market dynamics and investment strategies.
Frequently Asked Questions About Silver Supply Deficits
How long can silver supply deficits continue? The current deficit could persist for 5-10 years based on industrial demand trajectories and supply constraints. Solar panel installations and EV production follow multi-decade growth curves supported by government policies, while new silver mines require 7-10 years from discovery to production. Historical precedent suggests deficits lasting beyond three years typically create sustained price appreciation.
What happens if above-ground inventories are exhausted? Complete inventory exhaustion is unlikely, but critically low levels could trigger price spikes similar to the 1979-1980 period. As exchange inventories decline below 50 million ounces, delivery stress could emerge, forcing prices higher until demand destruction or supply increases restore balance. Market disruptions typically occur well before complete depletion.
Can recycling solve the supply deficit? Recycling currently provides only 180-200 million ounces annually and faces technical limitations. Unlike gold, much industrial silver is consumed permanently in solar panels, electronics, and medical applications. While higher prices could incentivize more electronic waste recycling, the potential additional supply likely totals only 50-100 million ounces annually—insufficient to eliminate current deficit levels.
How do supply deficits affect different types of silver investments? Physical silver benefits most directly from supply constraints through higher prices and premiums. Mining stocks can outperform during deficit periods but face operational risks. Silver ETFs may experience supply difficulties if physical shortages become severe, potentially creating premiums to net asset value. Each investment type responds differently to supply stress.
What could end the current supply deficit cycle? Several factors could restore supply-demand balance: major economic recession reducing industrial demand, technological breakthroughs enabling substitution in key applications, significant new mine discoveries, or government stockpile releases. However, the structural nature of current demand from renewable energy transitions makes these scenarios less likely than in previous deficit cycles.
Sources
- Silver Institute. "World Silver Survey 2025." https://www.silverinstitute.org
- U.S. Geological Survey. "Silver Statistics and Information." https://www.usgs.gov/centers/national-minerals-information-center/silver-statistics-and-information
- International Energy Agency. "Global Solar Installations 2025." https://www.iea.org
- CME Group. "COMEX Silver Warehouse Stocks." https://www.cmegroup.com/markets/metals.html
- London Bullion Market Association. "Silver Market Data." https://www.lbma.org.uk/prices-and-data
The silver supply deficit represents one of the most significant structural imbalances in commodity markets today. Four consecutive years of shortfalls totaling over 800 million ounces have drawn down global inventories while industrial demand continues accelerating. Solar panels, electric vehicles, and technological infrastructure create steady consumption that mining companies struggle to match.
Unlike cyclical deficits that resolve within 2-3 years, the current shortage stems from multi-decade technological transitions that governments have committed to through carbon neutrality targets. This demand visibility, combined with constrained supply responses from byproduct mining economics and environmental regulations, suggests the deficit could persist for years to come.
For investors seeking exposure to this fundamental story, silver offers compelling opportunities across multiple investment vehicles. Track live supply and demand dynamics with our comprehensive silver market tools and explore the complete fundamentals in our silver investing hub.
Disclaimer: This article is for informational and educational purposes only and does not constitute financial, investment, or trading advice. Past performance is not indicative of future results. Always conduct your own research and consult with a qualified financial advisor before making investment decisions. SilverOfTruth provides market data and analysis tools — it does not provide personalized financial advice.