
How much silver actually exists above ground? With silver trading at $77.27 per ounce in February 2026 and COMEX registered inventory standing at just 92.9 million ounces, this question has never been more critical for precious metals investors. Understanding the complete picture of global above-ground silver helps explain price dynamics, supply constraints, and investment opportunities in today's market.
Above-ground silver represents all the refined silver that has been mined throughout human history and remains available in various forms—from industrial stockpiles and government reserves to investment bars and jewelry. Unlike gold, where roughly 80% of all mined gold still exists above ground, silver faces unique challenges due to its extensive industrial consumption, making the question of available silver inventory far more complex.
This comprehensive analysis examines the complete above-ground silver landscape, from official exchange inventories to private holdings, industrial stockpiles, and the recycling ecosystem that helps maintain silver supply chains worldwide.
Global Above-Ground Silver Estimates
Historical Mining Production
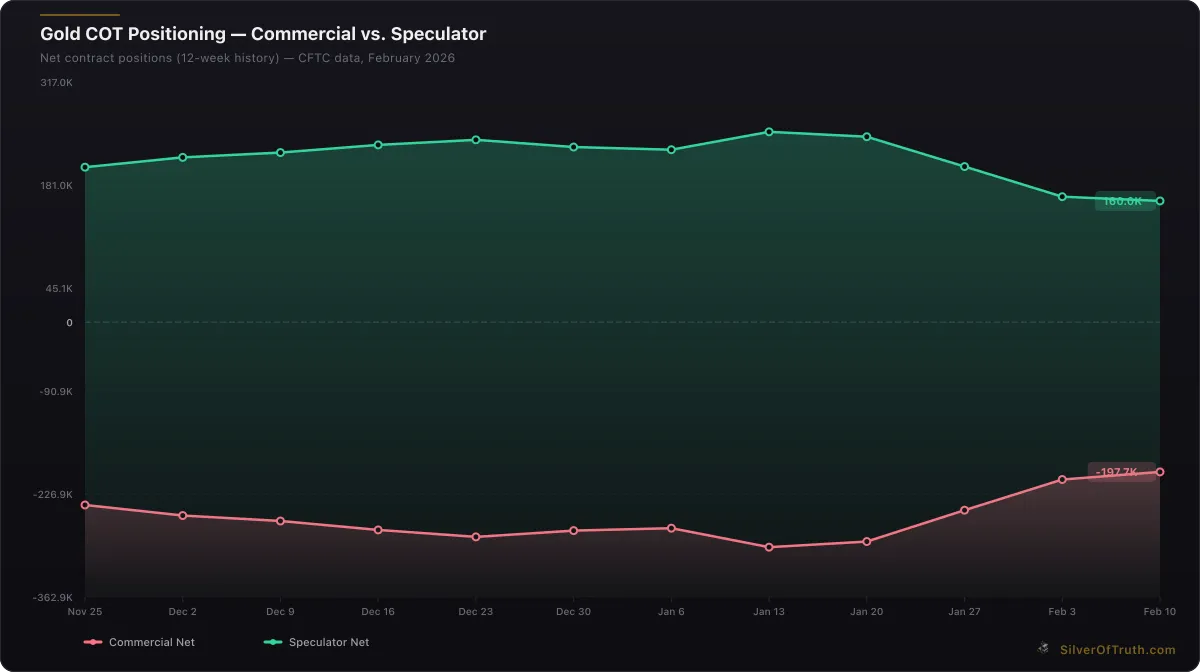
Gold COT positioning: commercial hedgers (red) vs. speculators (green). Source: CFTC via SilverOfTruth, February 2026
According to the Silver Institute, approximately 1.74 million metric tons (55.9 billion ounces) of silver have been mined throughout recorded history. This massive figure spans thousands of years of mining activity, from ancient civilizations to modern industrial extraction methods.
However, the critical distinction lies in what remains available today. Unlike gold, which sees minimal industrial consumption and maintains its above-ground stock, silver faces constant industrial depletion. The U.S. Geological Survey estimates that only 20-25% of all historically mined silver remains in recoverable above-ground form.
Current Above-Ground Silver Stock
Based on comprehensive industry analysis, the current above-ground silver inventory is estimated between 2-3 billion ounces globally. This includes:
| Category | Estimated Ounces | Percentage of Total | |---|---|---| | Investment Silver (Bars/Coins) | 800M - 1.2B | 35-40% | | Government Strategic Reserves | 300M - 500M | 12-18% | | Exchange Inventories (COMEX, LBMA) | 400M - 600M | 15-20% | | Industrial Stockpiles | 200M - 400M | 8-15% | | Jewelry & Silverware | 300M - 600M | 12-20% | | Total Estimated | 2.0B - 3.3B ounces | 100% |
These estimates vary significantly among analysts, reflecting the challenge of tracking private holdings and unreported stockpiles. The lower end of estimates suggests a tighter silver market than many investors realize.
Exchange and Institutional Silver Holdings
COMEX Silver Inventory
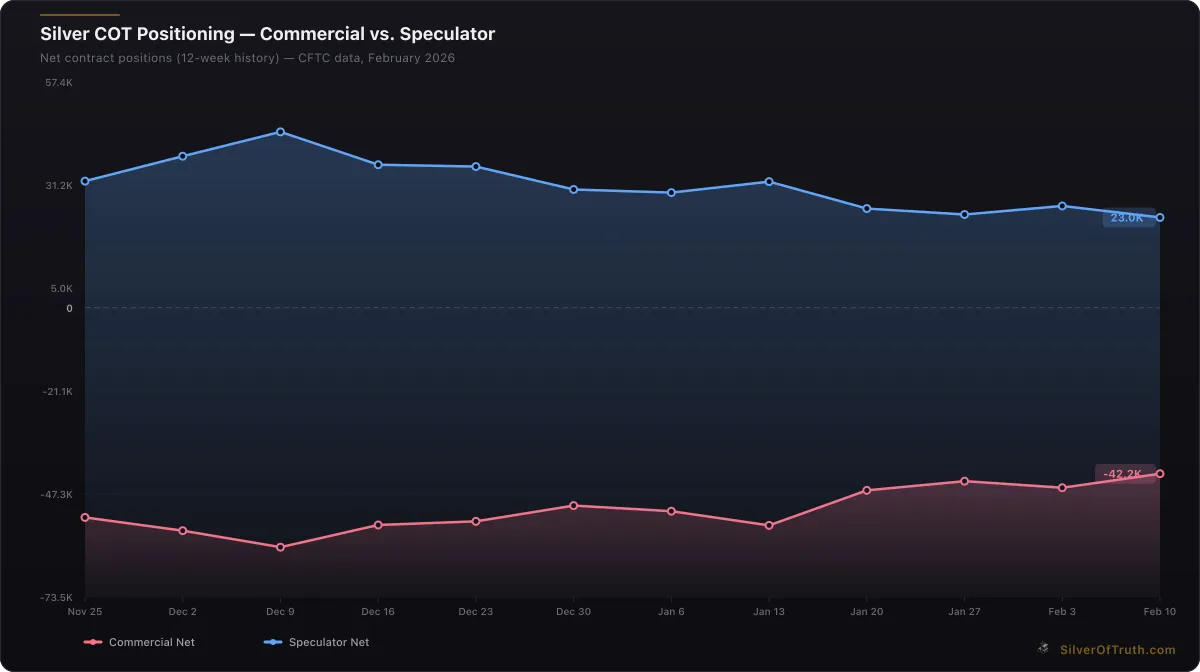
Silver COT positioning: commercial hedgers (red) vs. speculators (blue). Source: CFTC via SilverOfTruth, February 2026
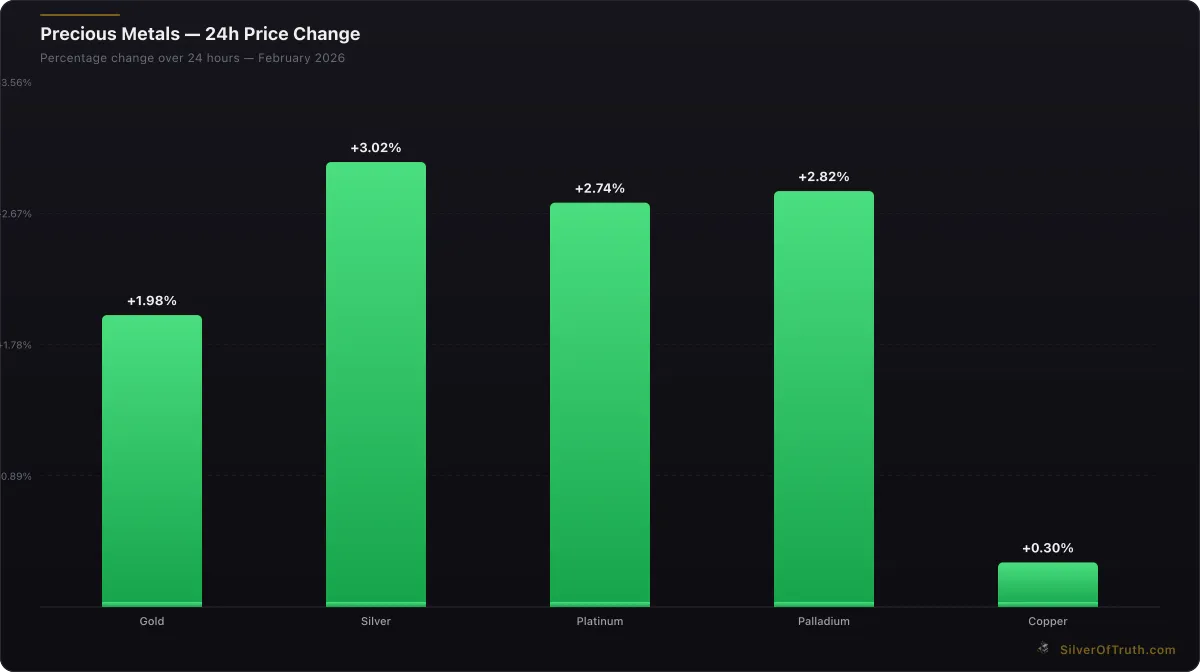
24-hour precious metals price changes. Source: SilverOfTruth, February 2026
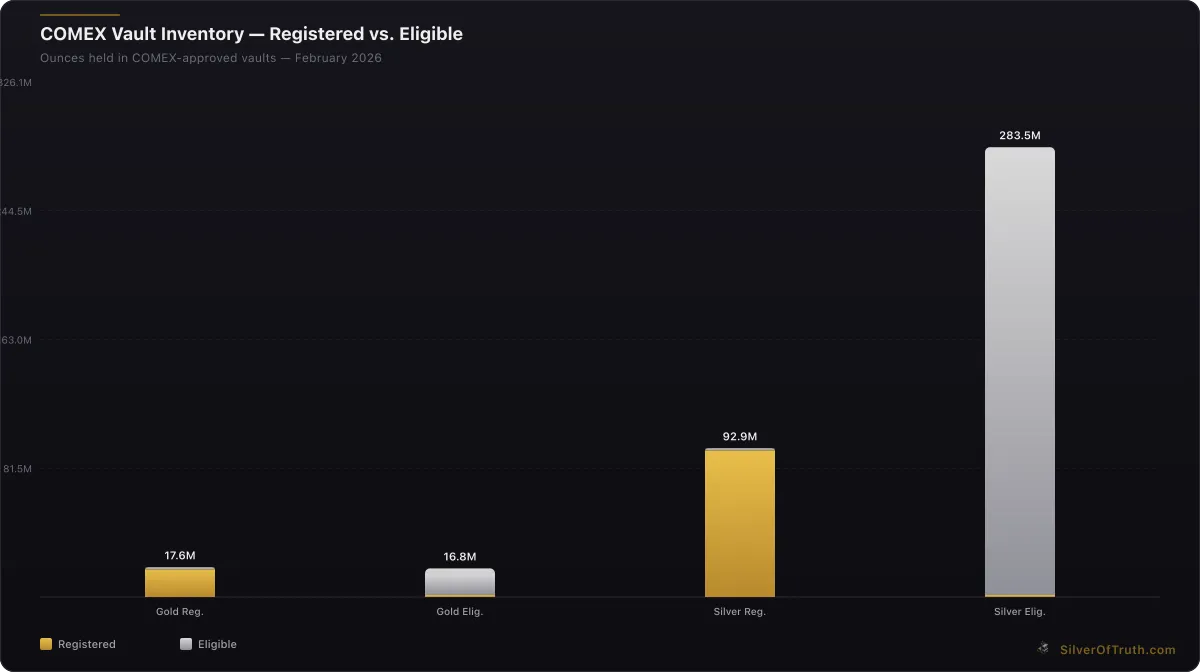
As of February 2026, COMEX silver inventory totals 376.4 million ounces, with only 92.9 million ounces in registered (deliverable) form according to CME Group data. This represents a critical supply bottleneck, as our analysis of COMEX registered vs eligible silver explains the difference between these categories.
The current COMEX coverage ratio of 56.3% indicates that total inventory covers just over half of outstanding futures contracts. More concerning is the registered coverage of only 13.9%, meaning deliverable silver covers less than 14% of open interest. This tight supply situation contributes to delivery squeeze risks detailed in our understanding COMEX inventory guide.
LBMA Vaulted Silver
The London Bullion Market Association (LBMA) reports approximately 1.2 billion ounces of silver held in London vaults as of 2025, according to LBMA vaulting statistics. However, this figure includes allocated and unallocated silver across multiple ownership categories, making direct comparison with COMEX data challenging.
London serves as the global hub for silver trading, with vaults holding silver for banks, ETFs, and institutional investors. The LBMA's Good Delivery standards ensure quality, but the exact availability of this silver for immediate delivery varies based on ownership structure and contractual obligations.
Silver ETFs and Investment Products
Major silver ETFs hold substantial above-ground silver inventory:
- iShares Silver Trust (SLV): ~550 million ounces
- Aberdeen Standard Physical Silver Shares (SIVR): ~150 million ounces
- Sprott Physical Silver Trust (PSLV): ~180 million ounces
- Other ETFs and ETPs: ~100 million ounces
Combined, silver ETFs hold approximately 980 million ounces, representing roughly 30-50% of estimated global investment silver. This concentration in ETF holdings means that redemption pressures or structural changes could significantly impact physical silver availability.
Government and Central Bank Silver Holdings
Unlike gold, silver plays a minimal role in central bank reserves. Most governments sold their strategic silver reserves decades ago, with the United States completing its sales in the early 2000s. However, some holdings remain:
Current Government Holdings
- China: Estimated 50-100 million ounces in strategic reserves
- India: Approximately 30-50 million ounces
- Russia: Estimated 20-40 million ounces
- Mexico: Small strategic reserve, exact amounts undisclosed
The lack of significant government silver stockpiles contrasts sharply with gold, where central banks hold over 35,000 tonnes. This absence of official sector silver creates additional supply pressure during periods of increased industrial or investment demand.
Industrial Silver Stockpiles
End-User Inventory
Industrial consumers maintain working inventories to ensure production continuity. Key sectors include:
Electronics Manufacturing: Companies like Samsung, Apple suppliers, and other electronics manufacturers typically hold 30-90 days of silver inventory. Given electronics accounts for 300+ million ounces of annual silver demand, working inventories likely total 75-225 million ounces globally.
Solar Panel Production: With solar accounting for 140+ million ounces annually, manufacturers maintain 60-120 million ounces in various stages of production and inventory.
Automotive Sector: Electric vehicle production and traditional automotive applications require steady silver supplies, with industry inventories estimated at 20-40 million ounces.
Strategic Industrial Reserves
Some nations maintain strategic metal reserves including silver for national security purposes. China's strategic reserves are estimated to include 50-100 million ounces of silver, while other countries hold smaller amounts.
Private Investment Holdings
Physical Silver Stacking
Individual investors worldwide hold substantial silver in bars, coins, and rounds. Our guide to silver stacking for beginners explains the growing retail investment trend that has accumulated significant physical silver over the past decade.
Estimating private holdings challenges analysts, but industry surveys suggest:
- United States: 200-400 million ounces in private hands
- Germany: 100-200 million ounces
- India: 300-500 million ounces (including jewelry conversion potential)
- China: 100-300 million ounces
- Rest of World: 200-400 million ounces
Jewelry and Silverware
Silver jewelry and silverware represent a significant above-ground category, estimated at 300-600 million ounces globally. However, much of this silver is in forms requiring refining before it can re-enter investment or industrial markets. Countries like India hold substantial silver in jewelry form, representing potential supply that could be mobilized at higher prices.
Silver Recycling and Recovery
Secondary Supply Sources
Silver recycling provides approximately 180-200 million ounces annually to the market, according to World Gold Council metals data. Key recycling sources include:
Photographic Waste: Though declining with digital photography, legacy photographic silver continues recycling Electronic Waste: Growing source as devices are recycled, though recovery rates vary Industrial Scrap: Manufacturing waste and end-of-life industrial products Jewelry and Silverware: Melted down during high price periods
Recovery Efficiency
Silver recycling faces efficiency challenges. Unlike gold's 95%+ recovery rates, silver recycling achieves 60-80% efficiency depending on the source material. This means significant silver is permanently lost during the recycling process, effectively reducing above-ground availability over time.
Regional Distribution of Above-Ground Silver
Geographic Concentration
Above-ground silver distribution reflects both mining history and economic development patterns:
North America: Estimated 600-900 million ounces
- Heavy concentration in ETFs and private investment
- Limited government reserves after U.S. strategic sales
Europe: Estimated 400-600 million ounces
- Strong private investment culture, particularly Germany
- LBMA vaulted silver serving global markets
Asia: Estimated 800-1,200 million ounces
- China's industrial stockpiles and strategic reserves
- India's jewelry and private investment holdings
- Japan's industrial working inventories
Rest of World: Estimated 200-400 million ounces
- Mining nations like Peru, Mexico maintaining some reserves
- Smaller industrial and investment holdings
The Silver Supply Deficit Impact
Structural Supply Shortfall
Our analysis of the silver supply deficit reveals annual shortfalls between mine production plus recycling versus industrial and investment demand. This deficit must be filled from above-ground stocks, gradually depleting available inventory.
With annual mine production around 830 million ounces and recycling providing 180 million ounces, total new supply reaches approximately 1.01 billion ounces. However, combined industrial and investment demand exceeds 1.1 billion ounces annually, creating a structural deficit of 90-100 million ounces that draws down above-ground stocks.
Inventory Depletion Dynamics
This ongoing supply deficit means above-ground silver inventory decreases annually. Unlike gold, which adds to above-ground stocks each year through mining with minimal consumption, silver faces net inventory reduction. At current deficit rates, above-ground silver stocks decline by 3-4% annually.
The mathematics are stark: if above-ground silver totals 2.5 billion ounces and annual deficits continue at 100 million ounces, available inventory faces a 25-year timeline before critical shortages emerge, assuming no demand growth or mining declines.
Investment Implications of Silver Inventory
Physical vs Paper Silver Dynamics
Source: SilverOfTruth COMEX data, February 2026
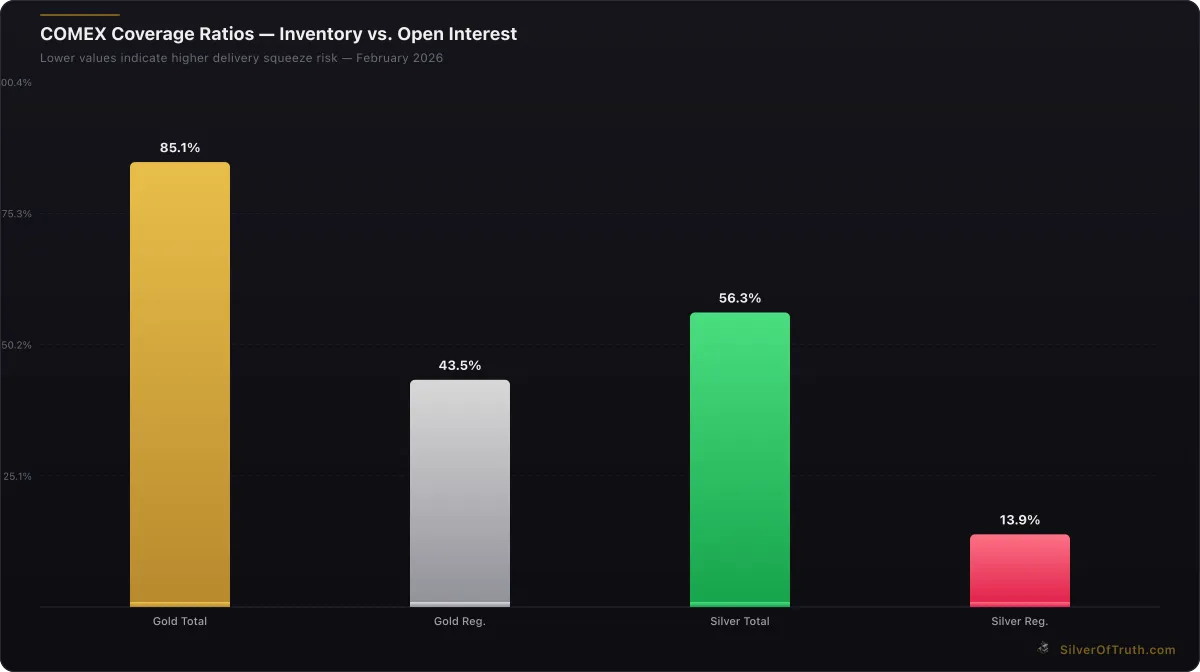
COMEX coverage ratios — lower values indicate higher delivery squeeze risk. Source: SilverOfTruth, February 2026
Understanding above-ground silver helps explain the dynamics between physical vs paper silver markets. With COMEX registered inventory at just 92.9 million ounces against 668.2 million ounces of open interest, the exchange holds only 13.9% coverage in deliverable form.
This tight inventory situation creates potential for delivery squeezes when investors seek physical conversion of paper positions. The relatively small above-ground silver stock compared to investment demand explains why even modest allocation shifts toward physical silver can dramatically impact prices.
Price Discovery Mechanisms
Above-ground silver scarcity affects price discovery across different market segments:
Exchange Pricing: COMEX and LBMA silver prices reflect paper trading but face physical constraints when delivery demands increase
Retail Premiums: Our analysis of silver premium over spot shows how physical scarcity creates premiums in retail markets
Industrial Purchasing: End-users face supply chain challenges during tight inventory periods, often accepting higher prices to secure supply
Storage and Custody Considerations
Secure Storage Infrastructure
The limited nature of above-ground silver creates storage challenges for investors. Our guide to silver storage options explores secure custody solutions as physical holdings increase.
Professional vaulting services have expanded to accommodate growing investment demand, but storage costs impact the economics of silver investment, particularly for smaller investors seeking physical exposure.
Liquidity Considerations
Above-ground silver's various forms offer different liquidity characteristics:
Investment Bars and Coins: Highest liquidity, easily traded ETF Holdings: Liquid for shares, but physical redemption faces minimum sizes Industrial Stockpiles: Low liquidity, committed to production needs Jewelry and Silverware: Requires refining, reducing effective value
Future Supply Challenges
Mining Production Outlook
Global silver mine production faces headwinds that could exacerbate above-ground inventory constraints. Declining ore grades, environmental regulations, and the fact that 70% of silver comes as a byproduct of base metal mining means supply responds slowly to price signals.
Peak production from major mines and limited new discoveries suggest mine supply may plateau or decline in coming years, increasing reliance on above-ground stocks to meet demand.
Technological Demand Growth
Emerging technologies increase silver consumption:
- Electric vehicles require more silver per unit than internal combustion engines
- 5G infrastructure demands high-quality silver for optimal conductivity
- Solar panel efficiency improvements often require more silver per panel
- Medical applications expand with silver's antimicrobial properties
These technological trends suggest industrial silver demand will continue growing, further pressuring limited above-ground inventories.
Investment Strategy Considerations
Portfolio Allocation Approaches
Understanding above-ground silver scarcity helps inform investment strategy. With total above-ground silver valued at $155-255 billion at current prices of $77.27 per ounce, the entire market remains smaller than many individual tech companies.
This relatively small market size creates both opportunity and risk. Modest institutional allocation toward physical silver could significantly impact prices due to limited above-ground availability, but the same scarcity makes large positions difficult to accumulate without moving markets.
Timing Considerations
Above-ground silver inventory data suggests strategic timing considerations for investors. During periods of:
High Industrial Demand: Competition for available silver intensifies ETF Inflows: Large premiums may develop as funds seek physical silver COMEX Delivery Stress: Our tracking of delivery squeeze risks shows when physical tightness peaks Currency Devaluation: Flight to real assets increases silver investment demand
Frequently Asked Questions
How much silver is there in the world total?
Approximately 1.74 million metric tons (55.9 billion ounces) of silver have been mined throughout history, but only 20-25% remains in above-ground form due to industrial consumption. Current estimates suggest 2-3 billion ounces of above-ground silver exist globally across all categories including investment, industrial stockpiles, and jewelry.
Why is above-ground silver inventory declining?
Silver faces a structural supply deficit where annual demand exceeds new supply from mining and recycling by 90-100 million ounces. This deficit must be filled from existing above-ground stocks, causing inventory to decline by 3-4% annually. Industrial consumption permanently removes silver from circulation, unlike gold which maintains its above-ground stock.
How does COMEX silver inventory compare to total above-ground silver?
COMEX holds 376.4 million ounces total, representing only 12-19% of estimated global above-ground silver. The registered (deliverable) inventory of 92.9 million ounces represents less than 5% of total above-ground silver, highlighting the concentrated nature of readily available silver for futures delivery.
What happens when above-ground silver becomes scarce?
Silver scarcity would likely manifest through rising prices, increased recycling rates, and potential industrial substitution. Higher prices would incentivize more recycling and bring marginal mines back into production. Industries might seek alternatives for some applications, though silver's unique properties make substitution difficult in many high-tech uses.
Is silver investment competing with industrial demand for the same inventory?
Yes, investment and industrial demand compete for the same above-ground silver pool. ETFs, private investors, and industries all draw from limited available inventory. This competition explains why investment inflows can dramatically impact silver prices—investment demand directly reduces silver available for industrial use, creating supply chain pressures that influence pricing across all sectors.
Understanding above-ground silver inventory reveals the tight supply dynamics underlying silver markets in 2026. With total above-ground silver estimated at just 2-3 billion ounces and annual deficits drawing down inventory, investors face a market characterized by structural scarcity. Track real-time silver inventory levels and market developments with the SilverOfTruth app, available on the App Store for comprehensive precious metals analysis.
Disclaimer: This article is for informational and educational purposes only and does not constitute financial, investment, or trading advice. Past performance is not indicative of future results. Always conduct your own research and consult with a qualified financial advisor before making investment decisions. SilverOfTruth provides market data and analysis tools — it does not provide personalized financial advice.