
When hedge funds and large speculators reach extreme positioning levels in gold futures, contrarian traders see opportunity. Managed money positioning—tracked through CFTC Commitments of Traders reports—offers one of the most reliable sentiment indicators in precious metals, revealing when sophisticated speculators have become dangerously crowded on one side of the market. These positioning extremes, whether bullish or bearish, historically signal major directional reversals that savvy traders can exploit. Understanding how to read these institutional positioning patterns provides retail traders with institutional-grade insight into market psychology and potential turning points.
What Is Managed Money in COT Reports?
Managed money represents professional speculators in CFTC COT data, specifically commodity trading advisors (CTAs), commodity pool operators (CPOs), and unregistered commodity trading advisors identified by the CFTC through forms and trader questionnaires. These entities manage client funds and trade futures contracts based on systematic strategies, technical analysis, and fundamental research.
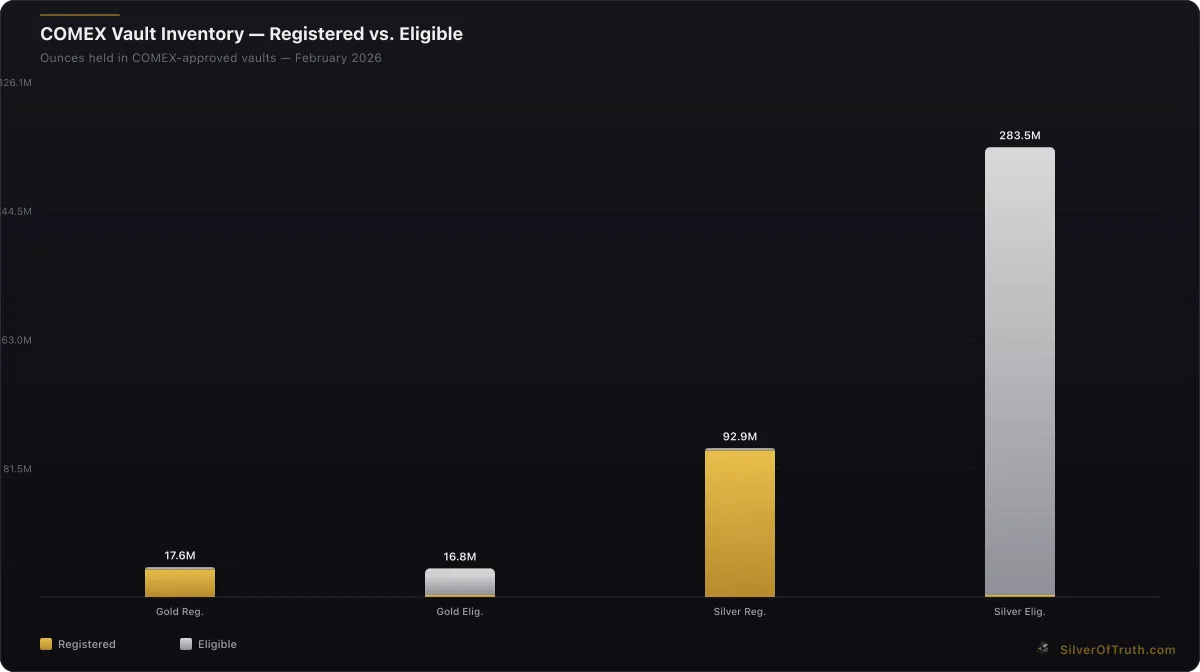
Source: SilverOfTruth COMEX data, February 2026
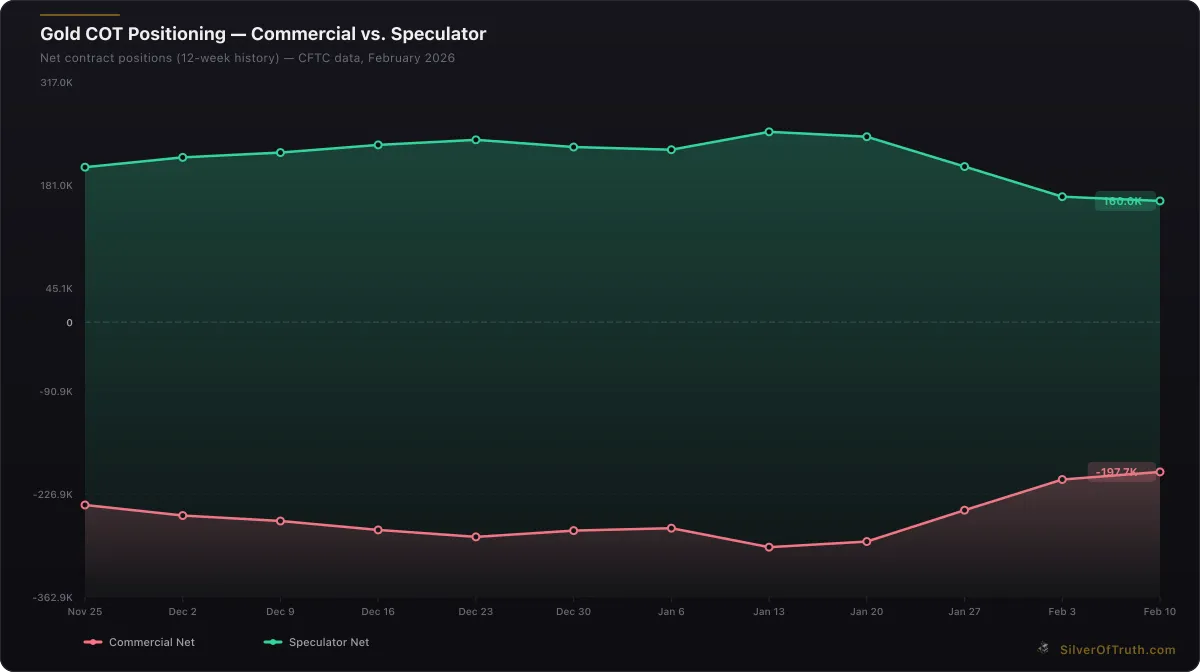
Gold COT positioning: commercial hedgers (red) vs. speculators (green). Source: CFTC via SilverOfTruth, February 2026
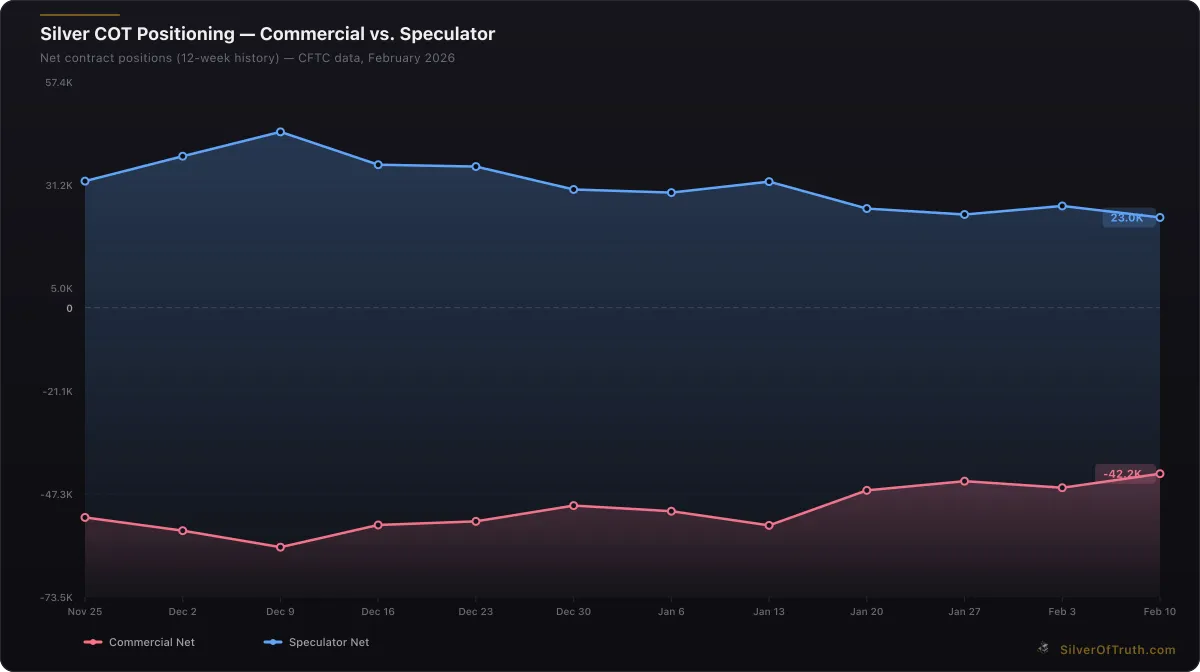
Silver COT positioning: commercial hedgers (red) vs. speculators (blue). Source: CFTC via SilverOfTruth, February 2026
The CFTC Commitments of Traders report categorizes all futures market participants into distinct groups, with managed money separated from other reportable traders to provide clarity on speculative versus hedging activity. This classification emerged in 2006 when the CFTC began publishing disaggregated COT data, recognizing that traditional "non-commercial" categories mixed different trader motivations.
Currently, managed money accounts for approximately 29.5% of total gold futures open interest through their long positions, with net positioning at +92,022 contracts. This represents significant but not extreme positioning—well below the euphoric levels above 150,000+ net contracts seen during major bull market peaks, yet substantially above the deeply negative readings during bear market capitulation phases.
Key Characteristics of Managed Money Traders
Managed money participants exhibit several distinctive trading behaviors that make their positioning data valuable for market analysis:
Trend-Following Nature: Most managed money strategies are momentum-based, buying strength and selling weakness. This creates self-reinforcing cycles where rising prices attract more buying, and falling prices trigger systematic selling.
Risk Management Discipline: Unlike retail speculators, managed money employs sophisticated risk management, including position sizing algorithms, stop-loss protocols, and correlation analysis across portfolios.
Systematic Approaches: Many managed money trades are algorithm-driven, responding to technical signals, volatility measures, and momentum indicators rather than fundamental analysis alone.
Performance Pressure: Managing client capital under performance mandates creates unique behavioral patterns, including quarterly rebalancing, year-end positioning adjustments, and sensitivity to drawdowns.
Current Managed Money Positioning Analysis
As of the latest COT data for February 10, 2026, managed money holds 119,232 long contracts against 27,210 short contracts in gold futures, creating a net long position of 92,022 contracts. This positioning represents 29.5% of total open interest on the long side and 6.7% on the short side.
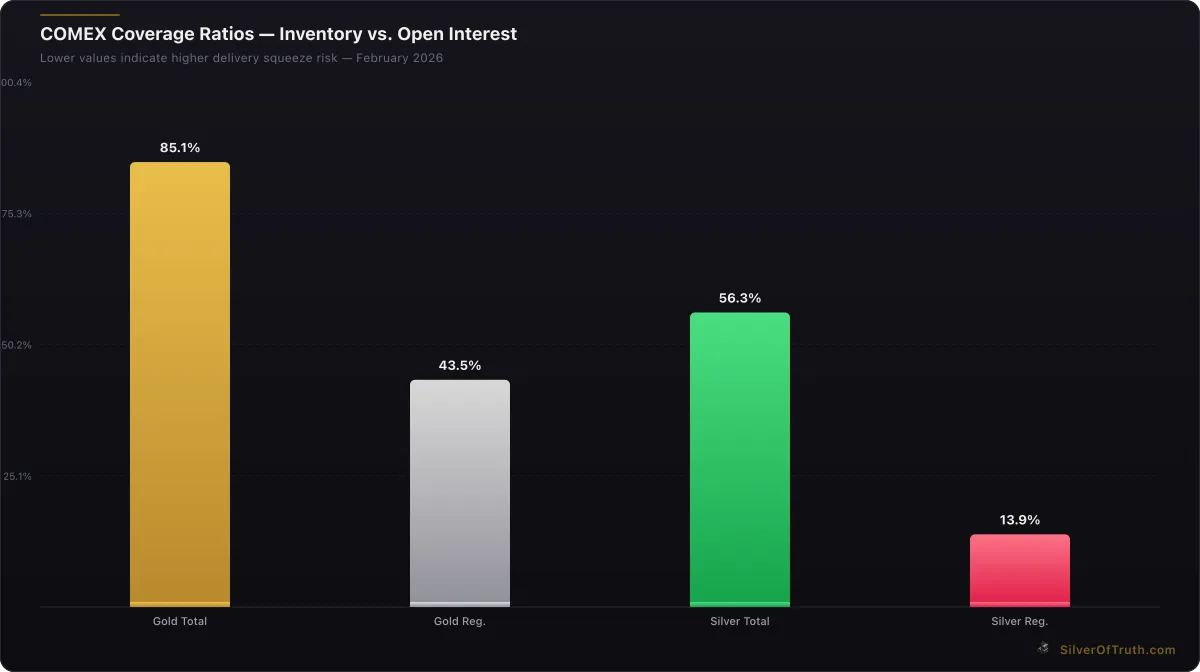
COMEX coverage ratios — lower values indicate higher delivery squeeze risk. Source: SilverOfTruth, February 2026
Weekly Changes and Momentum:
- Long positions: +296 contracts (minimal increase)
- Short positions: +346 contracts (slight increase)
- Net position: -50 contracts (marginal reduction)
- Overall open interest: -5,303 contracts (declining participation)
The modest weekly changes mask underlying distribution dynamics. While managed money maintained relatively stable positioning, the broader speculator category (non-commercials) reduced net longs by 5,592 contracts amid falling open interest. This suggests managed money is holding positions while other speculative money exits, potentially indicating conviction or slower systematic signals among professional managers.
Risk Assessment and Historical Context: At 92,022 contracts net long, managed money positioning sits in the moderate-to-elevated range historically. Peak bullish extremes typically exceed 150,000+ net contracts, while bearish capitulation often produces negative net positioning below -20,000 contracts. Current levels suggest meaningful exposure without euphoric excess—a positioning that can persist during sustained trends but remains vulnerable to sharp reversals on negative catalysts.
The concentration data reveals additional insights: the top 4 largest traders control 17.3% of long positions and 33.8% of short positions, while the top 8 control 28.4% of longs and 52.7% of shorts. This concentration indicates that a relatively small number of large participants can influence positioning dynamics significantly.
Historical Patterns and Reversal Signals
Managed money positioning extremes have provided remarkably consistent contrarian signals across major gold market cycles. Historical analysis reveals that when net positioning exceeds certain thresholds—typically above 150,000 contracts net long or below -10,000 contracts net short—subsequent price reversals occur within 1-4 months with high probability.
Major Reversal Examples
2020 COVID Peak: Managed money reached extreme net longs above 180,000 contracts as gold peaked near $2,075/oz in August 2020. The subsequent reversal saw gold decline 20% while managed money positioning collapsed to near-neutral levels.
2018-2019 Accumulation: During gold's consolidation phase, managed money positioning turned negative, reaching -15,000 contracts net short by late 2018. This extreme pessimism preceded gold's rally from $1,160 to above $1,550, with managed money flipping to strong net longs above 100,000 contracts.
2015 Capitulation: The most dramatic reversal occurred during 2015's gold bear market when managed money reached extreme net shorts exceeding -20,000 contracts near gold's $1,045 low. This positioning extreme coincided almost perfectly with the major low, followed by sustained recovery.
Current Positioning in Historical Context
Today's managed money net positioning of 92,022 contracts sits between major extremes, suggesting the market lacks the sentiment extreme typically required for significant reversals. However, several factors warrant attention:
Positioning Persistence: Current levels have persisted for several months without reaching extremes in either direction, indicating managed money conviction in the gold narrative despite recent price volatility.
Commercial Opposition: As outlined in our COT positioning signals guide, commercials hold -197,738 contracts net short, representing substantial hedging pressure that historically resolves through higher prices or speculator capitulation.
Momentum Dynamics: The flat weekly change (-50 contracts) amid declining open interest suggests managed money is holding positions while other participants reduce exposure—a potential sign of distribution phase beginning.
Interpretation Framework for Position Extremes
Understanding when managed money positioning signals potential reversals requires analyzing multiple factors beyond absolute positioning levels. The most reliable signals emerge when extreme positioning coincides with other confirming indicators.
Bullish Extreme Signals (Potential Top)
Positioning Threshold: Net longs above 150,000 contracts Confirming Indicators:
- Rising short-term volatility
- Commercial short interest above -250,000 contracts
- Open interest expansion on price advances
- Gold/silver ratio reaching extended levels above 90
- COMEX inventory showing adequate supplies
Signal Reliability: Historically 75%+ accuracy within 3-6 months Typical Outcome: Price corrections of 10-25% with managed money positioning declining to neutral/negative levels
Bearish Extreme Signals (Potential Bottom)
Positioning Threshold: Net shorts below -10,000 contracts or minimal net longs below 20,000 Confirming Indicators:
- Commercial short covering (net shorts improving toward zero)
- Open interest contraction during price declines
- Mining stock valuations at extreme discounts
- Physical demand indicators strengthening
- Macro environment showing policy support
Signal Reliability: Historically 80%+ accuracy within 2-4 months Typical Outcome: Price rallies of 20-50% with managed money flipping to strong net longs
Current Signal Assessment
With managed money at 92,022 contracts net long, current positioning lacks extreme characteristics in either direction. This intermediate positioning can persist during sustained trends but becomes vulnerable to sharp moves when catalysts emerge. The key warning signs for reversal would be:
- Acceleration: Rapid increases toward 120,000+ contracts
- Divergence: Positioning continuing higher while prices stall or decline
- Volume Confirmation: Open interest expansion accompanying position increases
- Commercial Response: Dramatic increases in commercial short hedging
Sector-Specific Positioning Dynamics
Managed money's approach to gold positioning varies significantly based on systematic strategy types, creating distinct sub-patterns within the aggregate data.
Trend-Following CTAs
Commodity Trading Advisors using momentum strategies typically dominate managed money positioning changes. These systematic programs:
Entry Triggers: Moving average crossovers, breakout signals, volatility-adjusted momentum Position Sizing: Risk-parity approaches often allocating 2-8% of assets to commodities Exit Discipline: Systematic stop-losses and trend change signals
During strong gold trends, CTA positioning can create powerful momentum effects. As prices rise, systematic buying from trend-followers attracts additional managed money, creating virtuous cycles. Conversely, trend breaks trigger systematic selling that accelerates corrections.
Discretionary Hedge Funds
Macro hedge funds and discretionary commodity funds contribute to managed money positioning through fundamental analysis and tactical allocation decisions:
Allocation Drivers: Inflation expectations, currency debasement concerns, geopolitical risks, portfolio diversification needs Position Timing: Often contrarian to short-term trends, buying weakness and selling strength based on value assessments Risk Management: Position sizing based on volatility, correlation analysis, and portfolio-level risk budgets
These discretionary strategies often provide stability to managed money positioning, countering some of the momentum extremes created by systematic CTAs.
Trading Implications and Strategic Applications
For precious metals investors, managed money positioning data offers several strategic applications beyond simple contrarian timing signals.
Position Sizing Guidance
Understanding managed money extremes helps inform position sizing decisions:
High Conviction Environments: When managed money positioning aligns with favorable fundamentals (adequate but not extreme positioning + supportive macro environment), larger position sizes may be warranted.
Risk Management Phases: Extreme positioning levels suggest reducing exposure or hedging positions regardless of fundamental outlook, as technical reversals become probable.
Accumulation Opportunities: Managed money capitulation phases (negative positioning) often provide optimal accumulation opportunities for long-term investors.
Timing Entry and Exit Points
While not precise timing tools, managed money positioning changes offer valuable entry and exit guidance:
Gradual Accumulation: Building positions as managed money reduces exposure from extreme levels Profit-Taking Discipline: Reducing positions as managed money reaches euphoric extremes Reversal Confirmation: Using managed money positioning changes to confirm reversal signals from technical analysis
As discussed in our comprehensive COT analysis guide, combining managed money signals with commercial positioning and open interest analysis provides more robust timing information than any single indicator.
Portfolio Integration Strategies
Professional investors integrate managed money positioning analysis into broader precious metals allocation strategies:
Core-Satellite Approach: Maintaining core physical metals positions while adjusting satellite futures/mining stock exposure based on positioning extremes Risk Overlay: Using positioning data to adjust overall precious metals allocation within multi-asset portfolios Hedge Implementation: Employing options or inverse ETF positions when managed money extremes signal reversal risks
Advanced Analysis: Positioning Quality and Composition
Beyond absolute positioning levels, analyzing the quality and composition of managed money positions provides additional insights into potential market dynamics.
Position Concentration Analysis
Current concentration data shows the top 4 largest traders control 17.3% of long positions, while the top 8 control 28.4%. This moderate concentration suggests broad participation rather than concentrated bets, reducing the risk of sudden position unwinding from individual large participants.
Historical analysis reveals that when concentration exceeds 25% among top 4 traders, markets become more vulnerable to sudden reversals as large participants adjust positions. Current levels suggest more stable positioning dynamics.
Cross-Asset Positioning Patterns
Managed money positioning in gold often correlates with positioning in other precious metals, currencies, and bonds. Currently:
Silver Correlation: Managed money holds only 4,569 contracts net long in silver (9.1% of OI), significantly lower relative positioning than gold. This divergence suggests gold-specific bullishness among professional speculators.
Currency Hedging: Many managed money gold positions are currency-hedged, focusing on gold's commodity characteristics rather than dollar weakness plays. This can create different positioning dynamics compared to retail speculation.
Fixed Income Relationships: As detailed in our ratio analysis, managed money often adjusts precious metals exposure based on real interest rate expectations and fixed income positioning.
Seasonal and Calendar Effects on Positioning
Managed money positioning exhibits notable seasonal patterns that provide additional analytical framework for interpreting current levels and anticipating changes.
Quarterly Rebalancing Effects
Q1 Patterns: January often sees initial positioning adjustments as managers implement new strategies Q2 Dynamics: Spring positioning typically reflects updated fundamental views following Q1 earnings and economic data Q3 Considerations: Summer positioning often shows reduced conviction due to lower trading volumes and vacation schedules Q4 Implications: Year-end positioning influenced by tax considerations, performance chasing, and annual rebalancing
Monthly Reporting Patterns
COT data released every Friday with Tuesday cutoffs creates specific timing dynamics:
Early Month: Initial positioning adjustments following previous month's economic data Mid-Month: Position changes reflecting updated forecasts and strategy adjustments Month-End: Window dressing and risk management adjustments for monthly reporting
Understanding these patterns helps interpret whether positioning changes reflect strategic conviction or technical/procedural adjustments.
Integration with Fundamental Analysis
While managed money positioning provides valuable contrarian signals, optimal analysis integrates positioning data with fundamental factors driving precious metals demand.
Macro Environment Assessment
Current macro conditions supporting gold demand include:
Monetary Policy: Federal Reserve policy uncertainty with potential rate normalization creating real interest rate volatility Fiscal Dynamics: Growing federal deficits and debt sustainability concerns Geopolitical Risks: Ongoing international tensions supporting safe-haven demand Currency Debasement: Central bank digital currency initiatives and fiat currency concerns
As explored in our comprehensive COT report analysis, when managed money positioning aligns with supportive fundamentals, trends can persist longer than pure contrarian analysis suggests.
Supply-Side Considerations
Gold supply dynamics also influence the effectiveness of managed money positioning signals:
Mine Production: Global mine production growth slowing with rising all-in sustaining costs pressuring margins Recycling Flows: Higher prices typically increase recycling supply, potentially offsetting demand increases Central Bank Activity: Continued central bank net buying provides fundamental floor despite speculative positioning
Risk Management and Position Sizing Applications
Professional managers use managed money positioning data as input for systematic risk management and position sizing decisions.
Volatility Adjustment Models
Many systematic strategies adjust position sizes based on managed money positioning extremes:
High Positioning: Reduced position sizes to account for increased reversal risk Low Positioning: Increased position sizes to capitalize on potential mean reversion Moderate Positioning: Base case position sizing allowing for trend continuation
Portfolio Correlation Considerations
Managed money positioning affects precious metals correlations with other asset classes:
Extreme Long Positioning: Often coincides with reduced gold-bond correlations and increased gold-equity correlations Extreme Short Positioning: Typically aligns with traditional safe-haven correlations strengthening Current Moderate Levels: Suggest normal correlation patterns likely to persist
Technology and Systematic Strategy Evolution
The composition and behavior of managed money continues evolving with technological advancement and strategy innovation.
Algorithmic Trading Growth
Increasing algorithmic participation in managed money creates specific positioning patterns:
High-Frequency Components: Some managed money includes higher-frequency systematic strategies that can create short-term positioning volatility Machine Learning Applications: AI-driven strategies may exhibit different extreme level patterns compared to traditional technical analysis approaches Risk Parity Integration: Growing risk parity strategy adoption affects how managed money responds to volatility changes
ESG and Sustainable Investing
Environmental, Social, and Governance considerations increasingly influence managed money allocation to precious metals:
Sustainable Mining: Preference for gold miners with strong ESG credentials Carbon Footprint: Consideration of gold's environmental impact in allocation decisions Social Impact: Growing focus on responsible mining practices affecting sector allocation
FAQ Section
What percentage of open interest do managed money positions represent in gold futures?
Managed money currently holds 29.5% of gold futures open interest through long positions (119,232 contracts) and 6.7% through short positions (27,210 contracts). Their net position of 92,022 contracts represents significant but moderate exposure compared to historical extremes above 150,000 contracts during major bull market peaks.
How reliable are managed money positioning extremes as reversal signals?
Historical analysis shows managed money positioning extremes provide contrarian signals with 75-80% reliability within 3-6 months. Bullish extremes above 150,000 contracts net long typically precede 10-25% price corrections, while bearish extremes below -10,000 contracts often coincide with major market bottoms followed by 20-50% rallies.
What's the difference between managed money and other speculative categories in COT reports?
Managed money specifically includes commodity trading advisors (CTAs), commodity pool operators (CPOs), and registered commodity trading advisors who manage client funds professionally. Other speculative categories include hedge funds, pension funds, and large individual traders who may have different motivations and time horizons compared to systematic professional managers.
How do seasonal patterns affect managed money positioning in gold?
Managed money positioning exhibits distinct seasonal patterns including Q4 year-end rebalancing, Q1 strategy implementation adjustments, and summer months showing reduced conviction due to lower volumes. These patterns can influence the timing and magnitude of positioning changes independent of fundamental factors.
Should retail investors use managed money positioning data for trading decisions?
While managed money positioning provides valuable market sentiment insights, retail investors should integrate this data with fundamental analysis, technical indicators, and personal risk management rather than using it as a standalone trading signal. The data works best for broader strategic allocation decisions rather than precise market timing.
Conclusion
Managed money positioning in gold futures offers institutional-grade insight into professional speculator sentiment and potential market inflection points. With current net positioning at 92,022 contracts (29.5% of open interest), these sophisticated traders maintain meaningful but moderate exposure—well below euphoric extremes yet substantially above bearish capitulation levels.
The analysis reveals a market in transition: managed money holding conviction while other speculators reduce exposure amid declining open interest. This positioning dynamic, combined with commercial hedgers' substantial short exposure of -197,738 contracts, creates a setup where catalysts could drive significant directional moves in either direction.
For precious metals investors, managed money positioning data serves as a valuable risk management and strategic allocation tool. While not providing precise timing signals, extreme positioning levels consistently warn of potential reversals with 75-80% historical reliability. Current moderate levels suggest the market can trend in either direction based on fundamental developments rather than positioning-driven technical corrections.
Track real-time COT positioning data and managed money trends in the SilverOfTruth app—available on the App Store for comprehensive precious metals market intelligence.
Disclaimer: This article is for informational and educational purposes only and does not constitute financial, investment, or trading advice. Past performance is not indicative of future results. Always conduct your own research and consult with a qualified financial advisor before making investment decisions. SilverOfTruth provides market data and analysis tools — it does not provide personalized financial advice.