
With gold trading at $5,063.80 and silver at $77.27, understanding AISC mining explained becomes crucial for investors evaluating mining stock opportunities. All-in sustaining cost (AISC) reveals the true economic health of mining operations, going far beyond misleading cash cost metrics that hide critical expenses.
Many investors fall into the trap of comparing mining stocks based solely on cash costs per ounce, only to discover that companies with seemingly low production costs actually struggle with profitability. This comprehensive guide explains how AISC provides a more complete picture of mining economics and why it's essential for accurate mining stock valuation.
What Is AISC (All-In Sustaining Cost)?
All-in sustaining cost (AISC) represents the comprehensive cost required to maintain current gold and silver production levels indefinitely. Unlike cash costs that only capture direct extraction expenses, AISC includes all costs necessary to sustain operations at their current capacity over the long term.
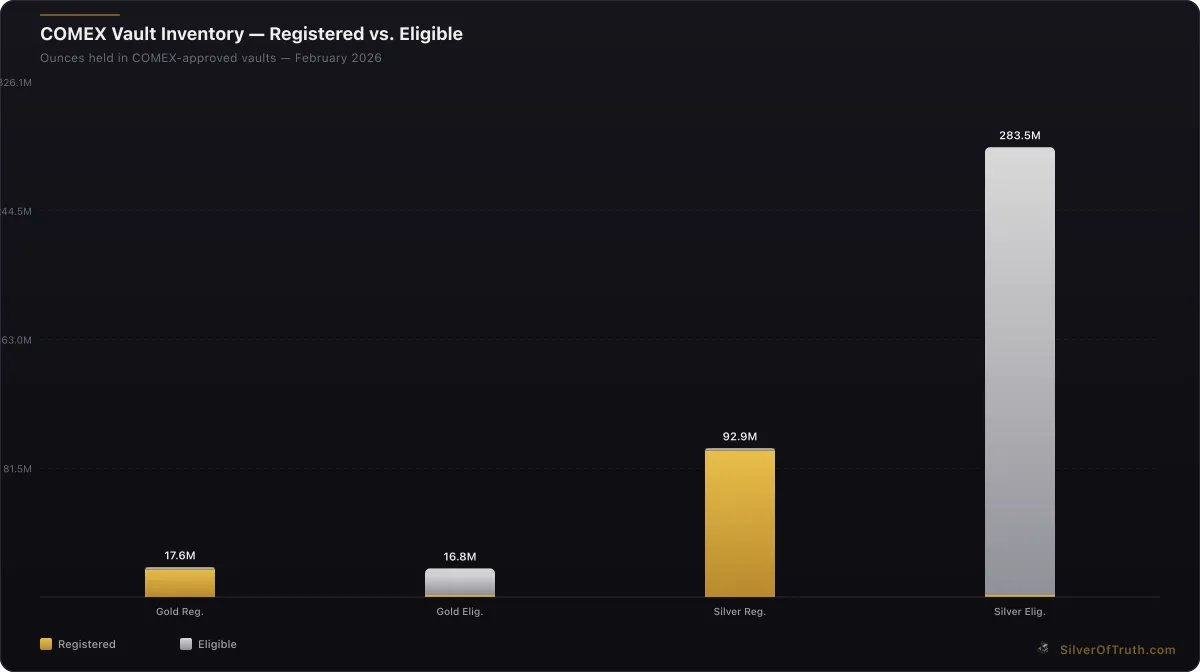
Source: SilverOfTruth COMEX data, February 2026
The World Gold Council developed AISC as a standardized metric in 2013 to address inconsistencies in how mining companies reported production costs. Before AISC, companies could manipulate cost reporting by excluding various expenses, making meaningful comparisons nearly impossible.
AISC encompasses four major cost categories:
Direct Mining Costs: Operating expenses directly related to extracting ore, including labor, fuel, reagents, and processing costs. These form the foundation of traditional cash cost calculations.
Corporate Administration: General and administrative expenses allocated to mining operations, including executive compensation, legal fees, accounting costs, and corporate overhead that supports production activities.
Sustaining Capital Expenditures: Capital investments required to maintain current production levels, such as equipment replacement, infrastructure maintenance, and mine development necessary to access existing reserves.
Exploration and Evaluation: Costs related to replacing depleted reserves through exploration activities, resource definition drilling, and feasibility studies for maintaining the asset base.
For investors analyzing precious metals miners, AISC provides the most accurate measure of what it truly costs to produce an ounce of gold or silver while maintaining operational sustainability. This metric reveals whether companies can generate genuine profits at current metal prices rather than just covering immediate extraction costs.
Understanding how to evaluate mining stocks requires mastering AISC analysis, as this metric often exposes significant differences between apparently similar mining operations. A company reporting low cash costs might have high AISC due to substantial capital requirements or exploration needs.
How AISC Is Calculated
AISC calculation follows a standardized methodology that ensures consistency across mining companies, though some variations exist in implementation details. The formula adds four key components to arrive at the total sustaining cost per ounce.
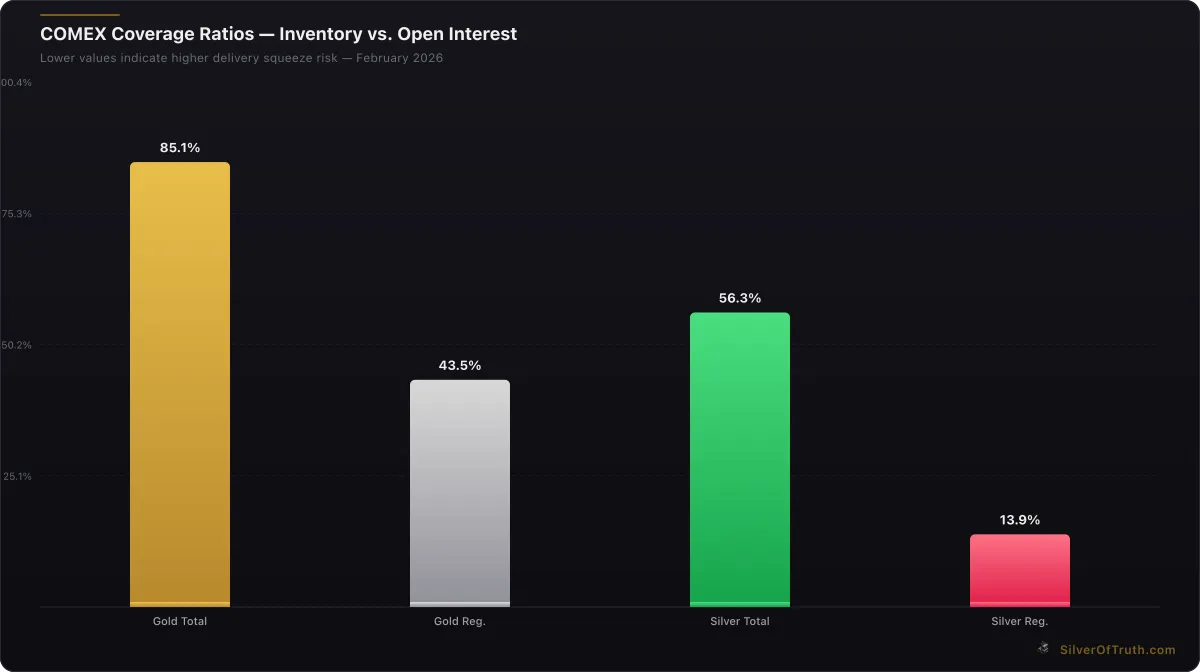
COMEX coverage ratios — lower values indicate higher delivery squeeze risk. Source: SilverOfTruth, February 2026
Step 1: Direct Mining Costs Start with cash operating costs, including:
- Mining labor and contractor costs
- Processing and metallurgical expenses
- Energy costs (electricity, fuel, propane)
- Consumables (chemicals, reagents, explosives)
- Maintenance materials and repairs
- Site administration expenses
Step 2: Corporate General & Administrative Add allocated corporate overhead:
- Executive and management compensation
- Corporate office expenses
- Legal and professional fees
- Insurance costs
- Investor relations expenses
- Board of directors compensation
Step 3: Sustaining Capital Expenditures Include capital required to maintain production:
- Equipment replacement and major overhauls
- Infrastructure maintenance and upgrades
- Tailings facility construction and maintenance
- Mine development to access existing reserves
- Environmental compliance capital
Step 4: Exploration and Evaluation Add exploration costs for reserve replacement:
- Geological and geophysical surveys
- Resource definition drilling
- Metallurgical testing
- Environmental and permitting studies
- Feasibility study updates
Final AISC Calculation: AISC per ounce = (Direct Costs + G&A + Sustaining CapEx + Exploration) ÷ Gold/Silver Ounces Produced
According to CME Group data, AISC reporting has become the industry standard for major mining companies, with quarterly and annual reporting typically breaking down each component for transparency.
Important exclusions from AISC include:
- Growth capital expenditures for expanding production
- Acquisition costs for new properties
- Interest expenses and financing costs
- Income taxes and royalty payments
- Impairment charges and one-time items
- Care and maintenance costs for non-producing assets
Mining companies may present AISC on different bases—some include royalties and taxes while others exclude them. Always verify the calculation methodology when comparing AISC across companies to ensure consistent treatment of cost categories.
AISC vs Cash Cost: Critical Differences
The gap between cash cost and AISC often reveals dramatic differences in mining economics that can mislead investors focusing solely on headline production costs. Cash costs represent only the direct expenses of extracting ore from the ground, while AISC includes all costs necessary for sustainable operations.
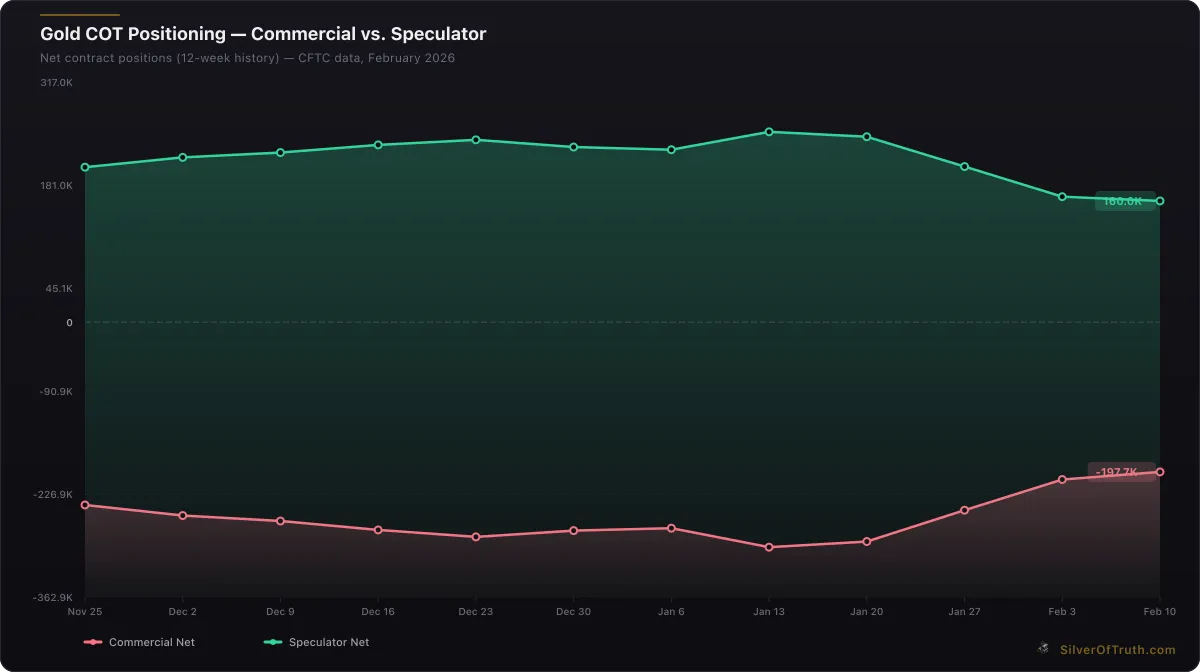
Gold COT positioning: commercial hedgers (red) vs. speculators (green). Source: CFTC via SilverOfTruth, February 2026
Cash Cost Components:
- Direct mining labor
- Processing and milling costs
- Energy for extraction operations
- Consumables (chemicals, explosives)
- Basic site administration
AISC Additional Components:
- Corporate overhead allocation
- Sustaining capital expenditures
- Equipment replacement reserves
- Exploration for reserve replacement
- Environmental compliance costs
Real-World Example: A hypothetical silver miner might report cash costs of $12 per ounce, appearing highly profitable with silver at $77.27. However, their AISC could be $18-22 per ounce when including:
- $3/oz in sustaining capital for aging equipment
- $2/oz in exploration to replace depleted reserves
- $1.50/oz in allocated corporate costs
- $1.50/oz in environmental compliance
This $6-10 per ounce difference dramatically impacts profitability analysis. At current silver prices, the cash cost suggests $65+ per ounce margins, while AISC reveals actual sustainable margins of $55-59 per ounce—still healthy, but significantly lower.
High-Grade vs Low-Grade Operations: High-grade mines often show smaller gaps between cash costs and AISC because their rich ore generates substantial cash flows that can fund sustaining investments. Low-grade operations frequently exhibit larger gaps due to higher ongoing capital requirements and more extensive processing needs.
Aging vs New Mines: Older mining operations typically show widening spreads between cash costs and AISC as aging equipment requires more sustaining capital. Newer mines may have lower AISC initially but face rising costs as infrastructure ages and easy-to-access ore depletes.
For junior silver miners, the cash cost vs AISC differential becomes even more critical. Junior companies often emphasize low cash costs to attract investors but may struggle with limited capital for sustaining expenditures, potentially compromising long-term viability.
Investors should focus primarily on AISC when evaluating mining stock investments, using cash costs only as a secondary metric for understanding operational efficiency. Companies consistently maintaining low AISC relative to metal prices demonstrate superior asset quality and management execution.
What's Considered a Good AISC?
AISC benchmarks vary significantly between gold and silver producers, with good performance typically measured against current metal prices and industry quartile rankings. Understanding these benchmarks helps investors identify well-managed operations versus those facing margin pressure.
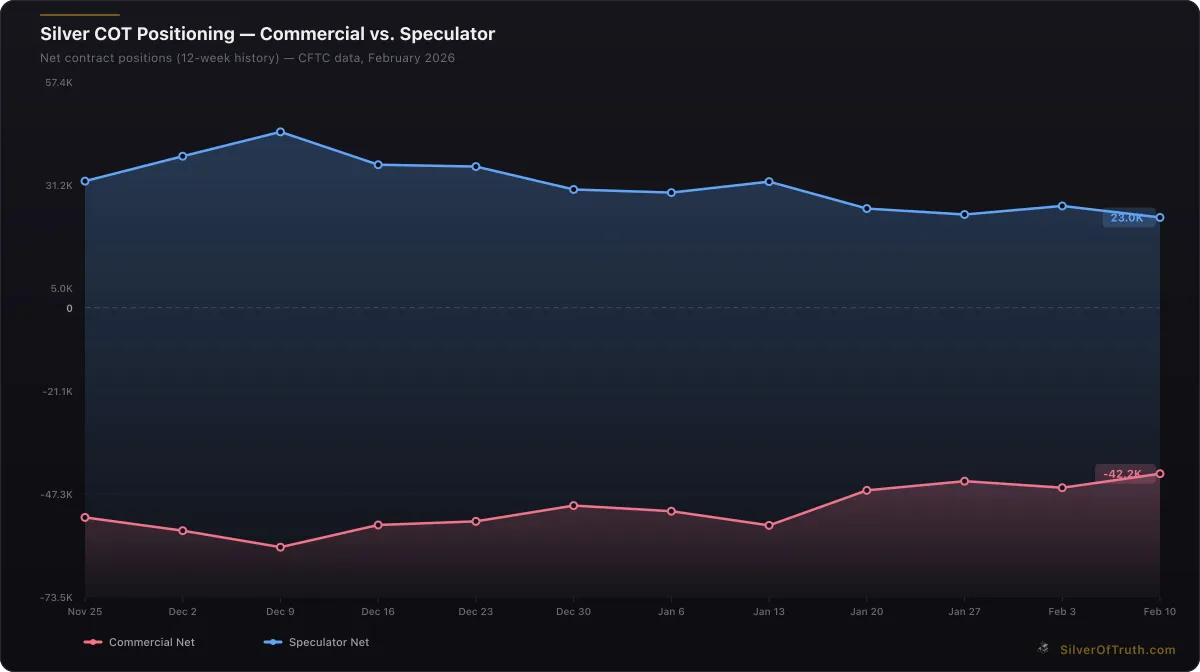
Silver COT positioning: commercial hedgers (red) vs. speculators (blue). Source: CFTC via SilverOfTruth, February 2026
Gold AISC Benchmarks (2026 Context): With gold at $5,063.80 per ounce, AISC performance tiers are:
- Excellent (Bottom Quartile): $1,200-1,400 per ounce (25%+ margins)
- Good (Second Quartile): $1,400-1,600 per ounce (20-25% margins)
- Average (Third Quartile): $1,600-1,800 per ounce (15-20% margins)
- Poor (Top Quartile): $1,800+ per ounce (<15% margins)
Silver AISC Benchmarks: With silver at $77.27 per ounce, performance tiers are:
- Excellent: $12-16 per ounce (25%+ margins)
- Good: $16-20 per ounce (20-25% margins)
- Average: $20-24 per ounce (15-20% margins)
- Poor: $24+ per ounce (<15% margins)
Key Factors Affecting AISC Quality:
Ore Grade Impact: Higher-grade deposits naturally achieve lower AISC through economies of scale and reduced processing requirements per ounce. Top silver producers typically operate mines with grades significantly above industry averages.
Geographic Location: Mining jurisdictions affect AISC through varying labor costs, energy prices, tax rates, and regulatory requirements. Operations in stable, mining-friendly jurisdictions typically maintain lower, more predictable AISC.
Mine Life and Scale: Longer-life, larger-scale operations spread fixed costs across more ounces and benefit from bulk purchasing power for supplies and equipment. Small or short-life mines often struggle with higher AISC due to limited economies of scale.
Currency Exposure: Companies with costs denominated in weaker currencies benefit when reporting in USD, while those with costs in strong currencies face headwinds. Currency hedging strategies can stabilize AISC over time.
Operational Excellence: Well-managed companies consistently achieve AISC in the lower quartiles through efficient operations, strategic capital allocation, and proactive cost management programs.
According to the Silver Institute, global average AISC for primary silver producers ranges from $16-22 per ounce, while by-product silver from copper/gold mines typically shows lower allocated costs due to revenue sharing across multiple metals.
Investors should evaluate AISC trends over multiple quarters rather than focusing on single-period performance, as mining costs can fluctuate due to seasonal factors, equipment maintenance cycles, and temporary operational issues.
AISC Analysis by Company Type
AISC performance varies dramatically across different categories of mining companies, with each segment facing distinct cost structures and operational challenges. Understanding these differences helps investors set appropriate expectations and identify superior performers within each category.
Major Gold Producers
Large-scale gold producers typically achieve the most consistent AISC performance through operational scale and geographic diversification. Their portfolios often include both high-grade underground operations and lower-grade open-pit mines.
Typical AISC Range: $1,300-1,600 per ounce Key Advantages: Economies of scale, diversified asset portfolios, access to capital markets for sustaining investments Common Challenges: Portfolio dilution from acquired assets, corporate overhead allocation across multiple operations
Primary Silver Miners
Pure-play silver companies face unique AISC challenges due to silver's industrial demand volatility and typically lower ore grades compared to gold operations. However, the best performers achieve strong margins through operational excellence.
Typical AISC Range: $14-20 per ounce Key Advantages: Focused expertise in silver metallurgy, direct exposure to silver price movements Common Challenges: Higher processing costs per ounce, limited revenue diversification, smaller operational scale
Polymetallic Producers
Companies producing multiple metals (gold, silver, copper, lead, zinc) often report the lowest allocated AISC for precious metals due to revenue sharing across the entire metal portfolio.
Typical AISC Range: $10-16 per ounce (allocated) Key Advantages: Revenue diversification reduces commodity price risk, shared processing costs Common Challenges: Complex cost allocation methodologies, exposure to base metals volatility
Junior Miners
Junior mining companies typically exhibit the highest AISC variability, ranging from exceptional performers operating high-grade deposits to struggling operations facing operational challenges and limited capital resources.
Typical AISC Range: $12-25+ per ounce (wide variation) Key Advantages: Focused management attention, potential for high-grade discoveries Common Challenges: Limited operational scale, restricted access to capital, higher per-ounce administrative costs
For investors interested in mining stock valuation, AISC analysis must consider the company's operational maturity, asset quality, and management track record rather than focusing solely on absolute cost levels.
Geographic AISC Trends
Mining jurisdiction significantly impacts AISC through varying cost structures:
Low-Cost Jurisdictions: Nevada (USA), Western Australia, Chile Moderate-Cost Jurisdictions: Canada, South Africa, Peru High-Cost Jurisdictions: Europe, some African countries with infrastructure challenges
Companies operating in multiple jurisdictions benefit from geographic cost diversification but face complexity in managing different regulatory environments and operational standards.
Why AISC Matters for Mining Stock Investors
AISC analysis provides critical insights for evaluating mining stock investments, offering a more complete picture of operational sustainability and profit potential than traditional financial metrics alone. Understanding AISC implications helps investors make better decisions across different market cycles.
Margin Sustainability Analysis
AISC reveals true operating margins that companies can sustain over multiple years. While cash costs might suggest attractive profitability, AISC shows whether operations can maintain production levels while generating returns for shareholders.
Current Market Example: With gold at $5,063.80, a company reporting $1,400 AISC generates sustainable margins of approximately $3,660 per ounce. This substantial margin provides flexibility for dividend payments, debt reduction, or growth investments even if gold prices decline moderately.
Capital Allocation Efficiency
Companies with consistently low AISC demonstrate superior capital allocation skills, efficiently investing sustaining capital to maintain production without excessive expenditures. This operational excellence often translates to better shareholder returns over time.
Key Metrics to Monitor:
- AISC trend over 3-5 years
- Sustaining capital expenditure as percentage of revenue
- Reserve replacement rates relative to exploration spending
- All-in margins during different commodity price cycles
Risk Assessment Framework
AISC analysis helps identify operational risks that might not appear in traditional financial statements:
High AISC Operations: May struggle during commodity price downturns, face difficulties funding sustaining capital, or require dilutive equity financing Rising AISC Trends: Could indicate declining ore grades, operational inefficiencies, or aging infrastructure requiring increased investment Volatile AISC: Suggests operational instability or exposure to commodity input cost fluctuations
Comparative Valuation Tool
AISC enables meaningful comparisons across mining companies by normalizing for different cost structures and operational approaches. This standardization helps identify undervalued opportunities and overvalued situations.
Valuation Multiples Enhanced by AISC:
- Enterprise Value to AISC-adjusted cash flow
- Price-to-sustainable earnings (using AISC-based margins)
- Asset value per ounce of reserves (AISC-adjusted)
According to LBMA market analysis, companies maintaining AISC in the bottom quartile of their respective sectors typically trade at premium valuations due to their superior operational metrics and earnings predictability.
Strategic Investment Applications
Growth vs Value Identification: Low-AISC companies trading at reasonable valuations often represent the best long-term value, combining operational excellence with attractive entry points.
Risk Management: AISC analysis helps construct portfolios with appropriate risk profiles, balancing high-margin, stable operations with potentially higher-return, higher-risk opportunities.
Cycle Timing: Understanding industry-wide AISC trends helps investors identify when sector valuations become compelling relative to operational realities.
For comprehensive analysis beyond AISC, investors should also examine reserve quality, mine life, political risk, and management track records when evaluating precious metals mining opportunities in today's market environment.
How Gold and Silver Prices Impact AISC Decisions
Precious metals prices directly influence how mining companies manage their AISC through operational decisions, capital allocation strategies, and long-term planning adjustments. Current elevated price levels create both opportunities and challenges for AISC optimization.
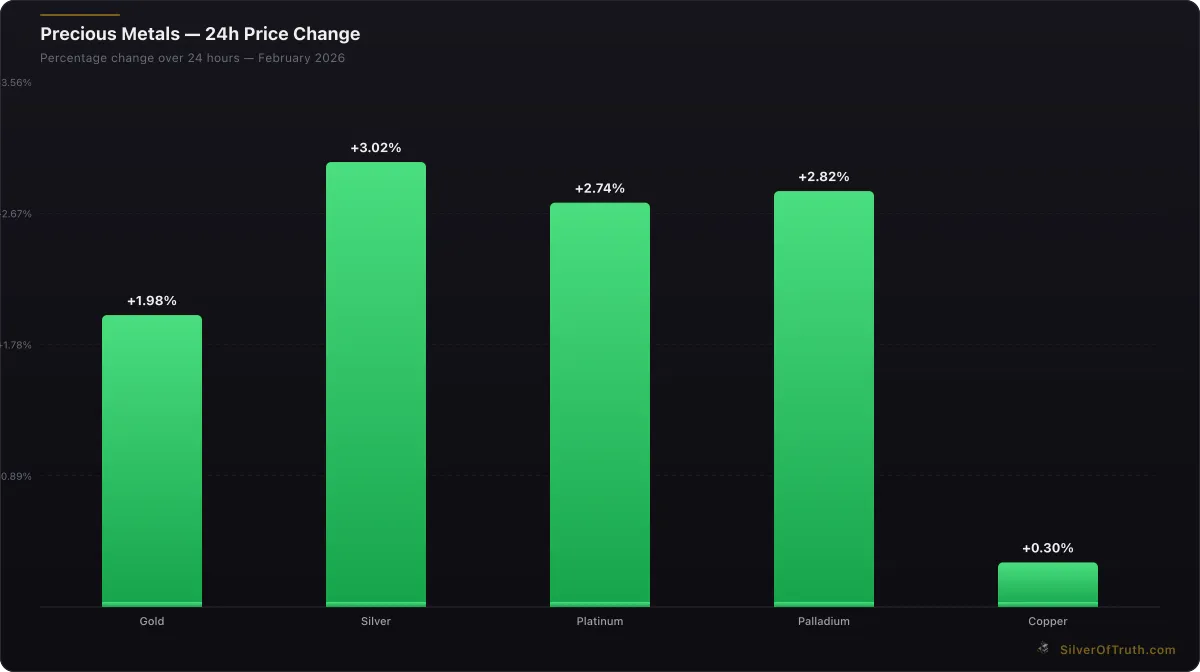
24-hour precious metals price changes. Source: SilverOfTruth, February 2026
Price-Driven Operational Adjustments
At current prices—gold at $5,063.80 and silver at $77.27—mining companies enjoy substantial margins that enable strategic AISC management decisions previously impossible during lower price environments.
High-Grading Strategies: Companies may focus on extracting higher-grade ore first to maximize near-term cash flows, potentially increasing current AISC but improving overall project economics. This approach works when companies expect sustained high prices.
Deferred Maintenance Risks: Strong margins can tempt companies to defer sustaining capital expenditures to boost short-term profitability. However, this creates future AISC inflation as deferred maintenance accumulates.
Expansion vs Sustaining Balance: High prices enable companies to fund both sustaining capital and growth projects simultaneously, but poor capital allocation can inflate AISC if expansion projects prove suboptimal.
Capital Expenditure Timing
Accelerated Investment Cycles: Current strong margins allow companies to accelerate sustaining capital programs, potentially reducing future AISC through modern equipment and improved infrastructure efficiency.
Technology Upgrades: High cash flows enable investments in automation, improved processing technology, and energy efficiency projects that reduce long-term AISC while requiring significant upfront capital.
Reserve Development: Companies can afford more extensive exploration and reserve development programs, potentially discovering higher-grade resources that lower future AISC.
Cost Inflation Pressures
Despite high metal prices, mining companies face significant cost inflation pressures that impact AISC calculations:
Labor Cost Inflation: Skilled mining labor costs increase during commodity booms as companies compete for workers, directly impacting AISC components.
Equipment and Supply Costs: Mining equipment, steel, energy, and consumables experience price inflation during strong commodity cycles, affecting both operating costs and sustaining capital requirements.
Regulatory Compliance: Environmental and safety regulations often become more stringent, adding to AISC through compliance capital and ongoing operational expenses.
Strategic AISC Management
Hedging Considerations: Companies with higher AISC may implement hedging strategies to lock in profitable margins, while low-AISC operations often prefer full price exposure.
Mine Life Optimization: High prices enable companies to extract lower-grade ore economically, potentially extending mine life but increasing AISC per ounce in the near term.
Portfolio Optimization: Strong cash flows allow companies to divest higher-AISC assets while investing in lower-cost operations, improving overall portfolio AISC performance.
Understanding these price-AISC dynamics helps investors evaluate whether companies are making sustainable operational decisions or potentially sacrificing long-term efficiency for short-term profits in the current favorable price environment.
AISC Red Flags and Warning Signs
Critical warning signs in AISC reporting can indicate operational problems, management issues, or unsustainable cost structures that threaten mining company performance. Recognizing these red flags helps investors avoid potential value traps and operational disasters.
Rapidly Rising AISC Trends
Year-over-year AISC increases exceeding 15% often signal serious operational challenges beyond normal inflation adjustments. This acceleration typically indicates:
Grade Deterioration: Declining ore grades force companies to process more material per ounce of metal, increasing both operating costs and sustaining capital requirements for larger equipment.
Aging Infrastructure: Older mines require exponentially higher sustaining capital as equipment reaches end-of-life and underground workings become more complex and expensive to maintain.
Operational Inefficiencies: Poor mine planning, equipment reliability issues, or workforce problems can drive rapid AISC inflation through reduced productivity and higher per-unit costs.
Inconsistent AISC Reporting
Frequent changes in AISC calculation methodology or significant quarterly volatility without clear operational explanations suggest management transparency issues or fundamental operational instability.
Quarterly AISC variance exceeding 20% without seasonal factors or major operational changes indicates poor cost control or potentially misleading reporting practices.
Unexplained exclusions from AISC calculations, particularly sustaining capital or exploration costs, may indicate companies attempting to minimize reported costs through aggressive accounting interpretations.
Sustaining Capital Deferrals
Declining sustaining capital expenditure as percentage of revenue during profitable periods often creates future AISC inflation as deferred maintenance accumulates and equipment reliability deteriorates.
Sustaining CapEx below 15% of revenue for mature operations typically indicates insufficient investment in maintaining operational capacity, creating risks of production declines or emergency capital requirements.
Geographic and Currency Risk Indicators
Heavy exposure to high-cost jurisdictions with deteriorating political or economic conditions can create rapid AISC inflation through currency devaluation, increased taxes, or regulatory compliance costs.
Unhedged currency exposure in jurisdictions with volatile exchange rates can create unpredictable AISC fluctuations that complicate investment analysis and operational planning.
Management Credibility Issues
Consistent failure to meet AISC guidance suggests either poor operational control or intentionally conservative estimates designed to enable frequent positive surprises.
Lack of detailed AISC component breakdowns in financial reporting may indicate companies hiding specific cost problems or attempting to obscure operational challenges from investors.
Aggressive expansion during high AISC periods often indicates management prioritizing growth over operational excellence, potentially creating future problems as margins compress during normal commodity cycles.
Investors should particularly scrutinize companies showing multiple red flags simultaneously, as these combinations often predict significant operational or financial difficulties that may not yet be reflected in current stock prices or credit ratings.
FAQ
What's the difference between AISC and cash costs in mining?
AISC (All-In Sustaining Cost) includes all expenses necessary to maintain current production levels indefinitely, while cash costs only cover direct extraction expenses. AISC adds corporate overhead, sustaining capital expenditures, and exploration costs to cash costs. For example, a mine might report $15/oz cash costs but $22/oz AISC when including equipment replacement and reserve development expenses.
How do I compare AISC across different mining companies?
Verify that companies use consistent AISC calculation methodologies, as some include royalties and taxes while others exclude them. Focus on AISC trends over 3-5 years rather than single-quarter performance. Compare companies within similar operational contexts—underground vs open-pit, high-grade vs low-grade, and similar geographic jurisdictions. Consider mine life and asset quality when evaluating AISC differences.
What AISC level indicates a profitable gold or silver mine?
At current prices (gold $5,063.80, silver $77.27), profitable AISC levels are: Gold mines with AISC below $1,800/oz generate healthy margins, while excellent performers achieve $1,200-1,400/oz. Silver operations with AISC below $24/oz remain profitable, with top performers achieving $12-16/oz. Companies maintaining margins above 20% during normal commodity cycles typically demonstrate superior operational quality.
Why do some companies exclude certain costs from AISC?
Mining companies may exclude growth capital expenditures, acquisition costs, interest expenses, and income taxes from AISC because these don't relate to sustaining current production levels. However, some companies inappropriately exclude legitimate sustaining costs like equipment replacement or exploration expenses to report lower AISC. Always verify the calculation methodology and look for detailed component breakdowns in financial reports.
How often should I review a mining company's AISC performance?
Monitor AISC quarterly when companies report earnings, but focus on annual trends to smooth seasonal variations and one-time items. Significant AISC changes (>15% year-over-year) warrant immediate investigation. Review AISC guidance updates and management commentary during earnings calls for forward-looking insights. Compare actual AISC to company guidance to assess management credibility and operational control.
Conclusion
AISC analysis reveals the true economics of mining operations, providing investors with essential insights beyond misleading cash cost metrics. Understanding how all-in sustaining costs capture the complete expense picture—from direct mining costs to sustaining capital and exploration—enables more accurate mining stock valuation and investment decisions.
Current precious metals prices create favorable environments for most mining operations, with gold at $5,063.80 and silver at $77.27 providing substantial margins above industry-average AISC levels. However, investors must evaluate whether companies are using these strong margins to strengthen long-term operational sustainability or potentially sacrificing future efficiency for short-term profits.
The most successful mining investments typically involve companies consistently maintaining AISC in the bottom quartile of their respective sectors while demonstrating disciplined capital allocation and operational excellence. These companies prove their ability to generate sustainable returns across different commodity price cycles while replacing depleted reserves cost-effectively.
As you analyze mining opportunities in today's market, track COMEX inventory dynamics and precious metals positioning data live with the SilverOfTruth app—available on the App Store. Real-time market intelligence combined with thorough AISC analysis provides the comprehensive framework necessary for successful precious metals mining investments.
Remember that AISC represents just one component of complete mining stock analysis. Combine AISC evaluation with reserve quality assessment, management track records, jurisdictional risk analysis, and broader market conditions to make well-informed investment decisions in this dynamic sector.
Disclaimer: This article is for informational and educational purposes only and does not constitute financial, investment, or trading advice. Past performance is not indicative of future results. Always conduct your own research and consult with a qualified financial advisor before making investment decisions. SilverOfTruth provides market data and analysis tools — it does not provide personalized financial advice.