
With silver holding a neutral COT sentiment at just 17% of open interest and gold showing bearish distribution at 40% positioning, understanding when COT positioning extremes signal major market turns becomes crucial for precious metals investors. The COT positioning extreme occurs when speculator net positions reach historically stretched levels—typically above 35-40% of open interest—creating contrarian opportunities that savvy traders have used to time major reversals for decades.
The CFTC Commitments of Traders report reveals positioning data that often contradicts mainstream sentiment, making it one of the most powerful COT contrarian indicators in commodities trading. When managed money positions become extremely crowded in one direction while commercial hedgers take the opposite side, these extremes frequently precede significant price reversals in gold and silver markets.
Understanding COT Positioning Dynamics
The foundation of COT positioning signals lies in recognizing that different trader categories serve distinct market functions. Commercial hedgers—primarily mining companies, refiners, and bullion dealers—use futures markets to hedge their physical operations. When silver miners sell forward production or dealers hedge inventory, they create natural short positions that often appear "bearish" but actually represent business hedging rather than directional bets.
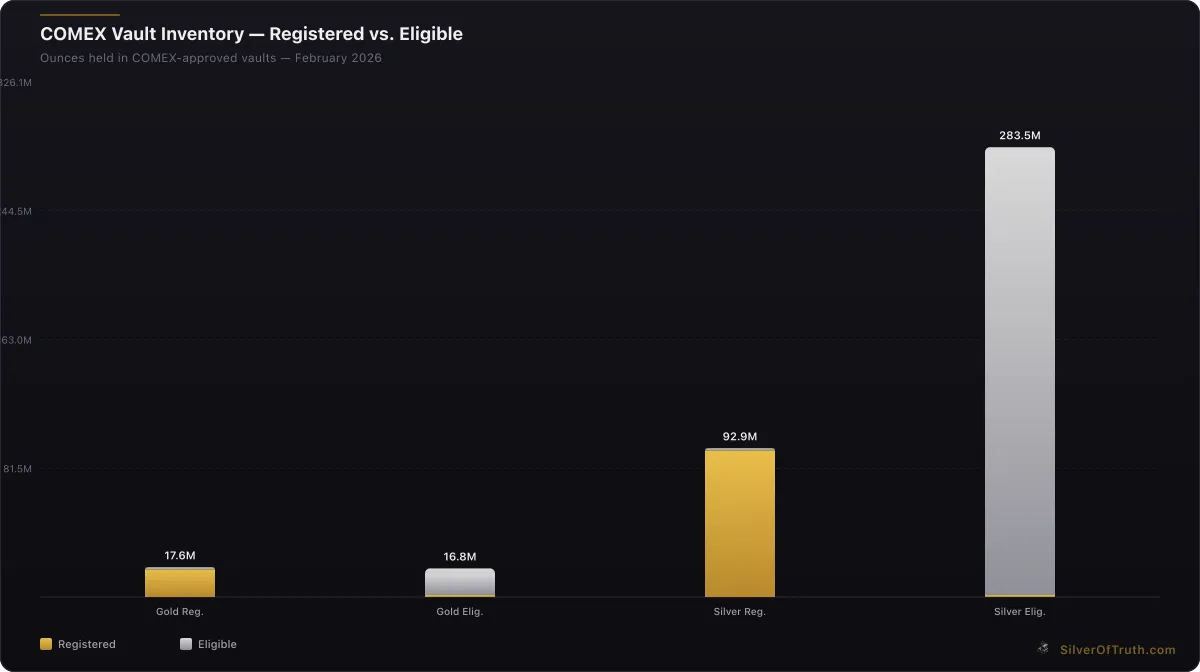
Source: SilverOfTruth COMEX data, February 2026
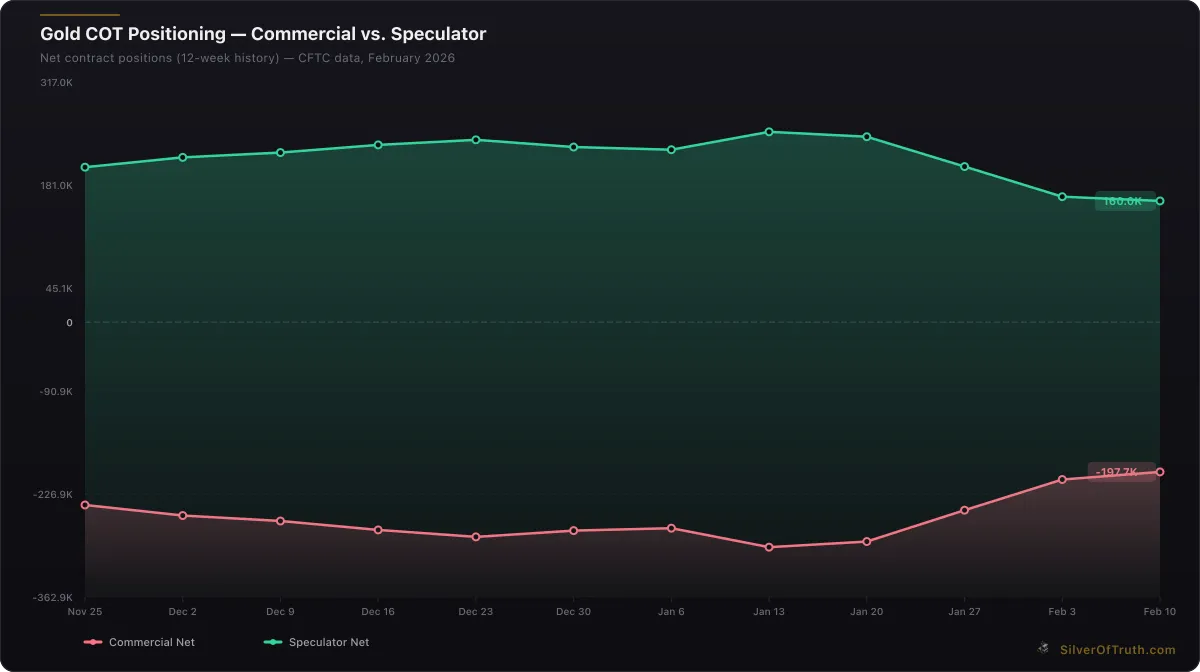
Gold COT positioning: commercial hedgers (red) vs. speculators (green). Source: CFTC via SilverOfTruth, February 2026
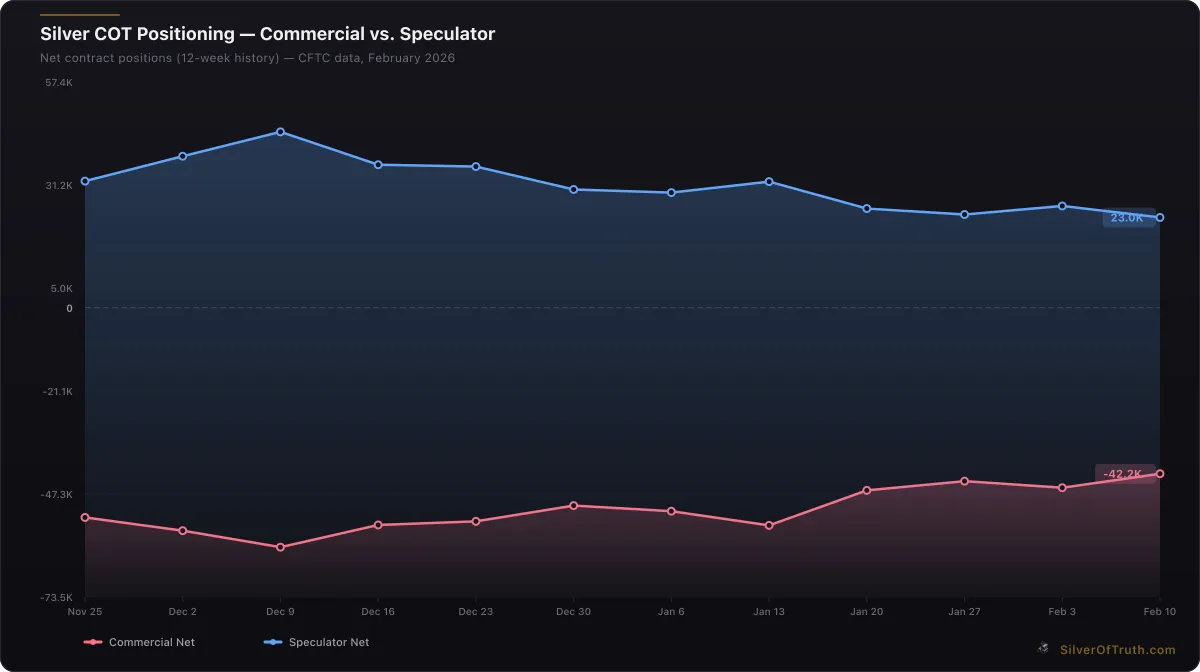
Silver COT positioning: commercial hedgers (red) vs. speculators (blue). Source: CFTC via SilverOfTruth, February 2026
Speculators, including managed money funds and large traders, operate as the market's risk-takers. Their positioning tends to follow trends and momentum, creating predictable patterns when sentiment reaches extremes. The COT signal silver generates occurs when these two groups reach historically stretched positioning against each other.
Current silver positioning illustrates balanced conditions: speculators hold a net long position of 22,955 contracts (17.2% of open interest), while commercials maintain -42,163 contracts net short. This represents neither bullish nor bearish extremes, suggesting silver prices will likely follow fundamental drivers rather than positioning-driven reversals.
Gold presents a different picture with speculators holding 160,012 contracts net long (39.6% of open interest)—approaching levels that historically generate selling pressure. As detailed in our comprehensive COT analysis guide, positioning above 35% often signals distribution phases where early longs begin taking profits.
Identifying Extreme Positioning Levels
COT positioning extremes develop gradually as trends mature and speculative interest builds. Historical analysis reveals consistent patterns across precious metals markets:
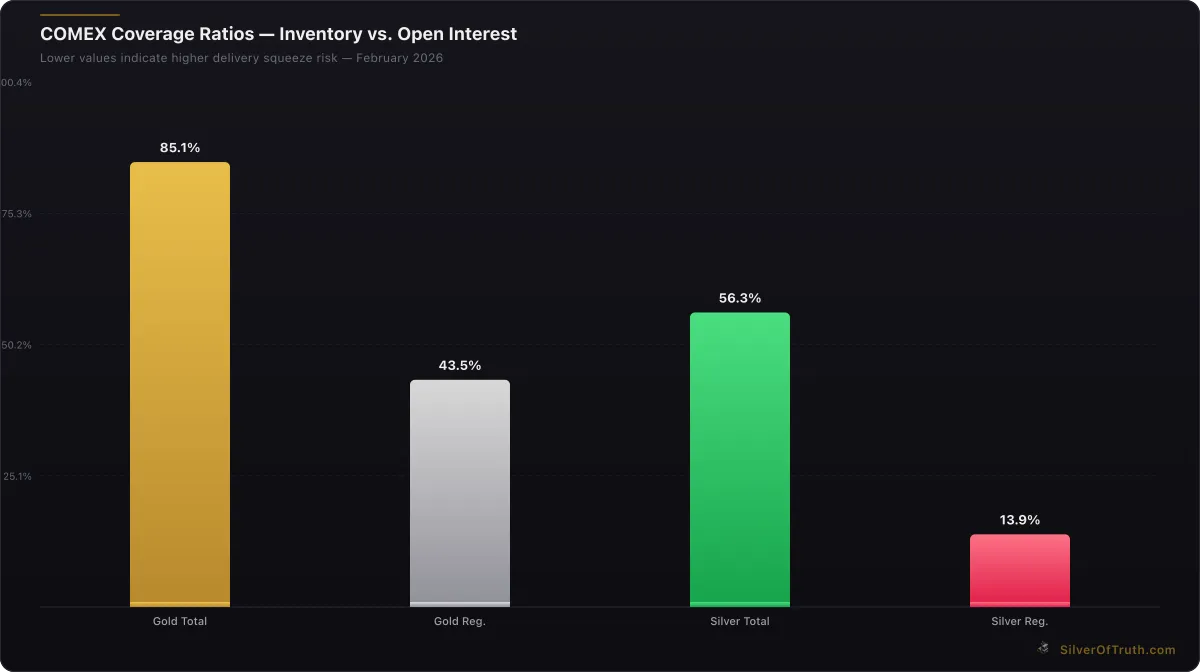
COMEX coverage ratios — lower values indicate higher delivery squeeze risk. Source: SilverOfTruth, February 2026
Bullish Extremes (Contrarian Buy Signals):
- Speculator net longs below 10% of open interest
- Commercial net shorts at lowest 20th percentile historically
- Managed money reducing long exposure for 3+ consecutive weeks
- Total open interest declining amid speculator selling
Bearish Extremes (Contrarian Sell Signals):
- Speculator net longs above 35-40% of open interest
- Commercial net shorts at highest 80th percentile historically
- Managed money aggressively adding positions for 4+ consecutive weeks
- Open interest expanding rapidly with speculative inflows
The key insight driving COT contrarian strategies: commercial hedgers possess superior market intelligence due to their physical market operations. When commercials overwhelmingly position against speculative sentiment, they're often correct about medium-term price direction.
Our detailed silver COT analysis examines how current silver positioning at moderate levels suggests neither extreme bullish nor bearish setups are imminent. However, gold's elevated positioning warrants closer monitoring for potential distribution signals.
Historical COT Extreme Examples
Examining past COT positioning extremes reveals their predictive power for major precious metals reversals. The March 2020 COVID crisis created textbook contrarian setups across both gold and silver markets.
Gold March 2020 Example: Just before gold's massive rally from $1,480 to $2,070, speculator net longs collapsed to just 8% of open interest—the lowest level since 2015. Commercial hedgers simultaneously reduced net shorts to minimal levels, essentially "stepping aside" as physical demand overwhelmed paper positioning. This extreme pessimism coincided with forced liquidation from margin calls, creating the perfect contrarian buy signal.
Silver September 2019 Extreme: Silver demonstrated the opposite pattern in late 2019 when speculator net longs reached 42% of open interest while commercials held record net shorts. This crowded speculative positioning preceded silver's decline from $19.00 to $16.50 over the following three months, validating the bearish extreme signal.
Key Pattern Recognition:
- Bullish extremes often coincide with broad market stress (VIX spikes, credit concerns)
- Bearish extremes develop during momentum phases when mainstream media promotes precious metals
- Reversal signals strengthen when positioning extremes align with technical resistance/support levels
- Time lag exists—extreme positioning may persist 2-6 weeks before reversals begin
The bank participation report provides additional context by revealing how major dealers position alongside commercial hedgers during extreme phases.
Timing Entry and Exit Points
Successfully trading COT positioning signals requires patience and disciplined timing rather than immediate contrarian positioning. Extremes can persist longer than expected, particularly during powerful trends driven by fundamental factors.
Entry Timing Strategies:
For Bullish Extremes (Contrarian Longs):
- Wait for speculator net longs to fall below 15% of open interest
- Confirm commercial short covering (net short position declining)
- Monitor for technical support confluence at key price levels
- Look for declining open interest amid speculator selling
- Enter positions in 2-3 tranches rather than single entry
For Bearish Extremes (Contrarian Shorts):
- Require speculator net longs above 35% of open interest for 2+ weeks
- Watch for early managed money position reduction
- Identify technical resistance levels for entry targets
- Monitor commercial net short expansion rate slowing
- Consider call options rather than outright shorts to limit risk
Exit Criteria: Successful COT-based trades typically unwind as positioning normalizes toward historical averages. Exit signals include:
- Speculator positioning returning to 20-25% of open interest (neutral zone)
- Commercial net positioning approaching 6-month averages
- Open interest stabilizing after expansion/contraction phase
- Technical price targets achieved based on historical extreme reversals
The current gold setup demonstrates developing distribution characteristics with speculator longs at 39.6% of OI. However, immediate bearish positioning hasn't triggered due to continued commercial short covering (+10,040 contracts weekly change). This suggests waiting for confirmation rather than premature contrarian positioning.
Commercial Hedger Intelligence
Commercial hedgers represent the "smart money" in precious metals markets due to their intimate knowledge of physical supply, demand, and production costs. Unlike speculators who follow price momentum, commercials position based on fundamental business needs and proprietary market intelligence.
Why Commercial Positioning Matters:
Mining companies hedge forward production when they anticipate weaker prices, while reducing hedges when expecting strength. Refiners and dealers adjust inventory hedges based on physical flow patterns invisible to outside observers. Central bank gold operations often involve commercial intermediaries who understand official sector demand patterns.
This privileged information creates the foundation for COT contrarian strategies. When commercials aggressively hedge (increasing net shorts) despite rising prices, they signal potential overvaluation. Conversely, commercial short covering during price weakness often precedes major rallies.
Analyzing Commercial Behavior:
Current silver data shows commercials at -42,163 contracts net short, representing moderate hedging levels. Their recent reduction in net shorts (+3,562 contracts) suggests either physical demand improving or expectations of limited downside. This neutral commercial stance aligns with silver's balanced COT sentiment.
Gold commercials remain heavily net short at -197,738 contracts but reduced shorts by 10,040 contracts weekly—the largest covering in months. This commercial buying amid speculator selling creates competing forces that often resolve with sideways price action until one side capitulates.
Swap dealers, a subset of commercials representing major investment banks, hold particularly valuable positioning insights. Their -179,293 contract net short position in gold reflects client demand hedging and proprietary positioning based on flow analysis unavailable to retail participants.
Speculator Sentiment Analysis
Speculative positioning serves as the market's sentiment gauge, reflecting mainstream investment flows and momentum-following behavior. Understanding speculator psychology helps identify when positioning extremes create tradeable contrarian opportunities.
Managed Money Behavior Patterns:
Hedge funds and CTAs (managed money category) demonstrate consistent behavioral patterns that enhance COT signal reliability:
Trend-Following Phase: Managed money aggressively adds positions in trending markets, often creating unsustainable extremes. Their systematic approaches amplify moves beyond fundamental justification.
Distribution Phase: As trends mature, early managed money participants begin profit-taking while late entrants continue buying. This creates internal selling pressure despite growing overall positions.
Liquidation Phase: Systematic stops and risk management trigger accelerated position unwinding once trends break, amplifying reversal moves beyond fundamental justification in the opposite direction.
Current managed money positioning in gold (92,022 contracts net long) represents elevated but not extreme levels. Their minimal weekly change (-50 contracts) suggests consolidation rather than aggressive accumulation or distribution, supporting neutral near-term outlook.
Silver's managed money position (4,569 contracts net long) reflects modest bullish bias without extreme characteristics. Their recent reduction (-414 contracts) aligns with overall speculative cautious sentiment despite silver's recent price strength.
Large Speculator Insights:
Non-commercial traders beyond managed money include individual large traders, commodity funds, and hedge funds not classified as systematic managed money. Their positioning often provides early warning signals for sentiment shifts.
Gold's non-commercial category shows 160,012 contracts net long (52.6% of OI) with recent reduction of -5,592 contracts. This high absolute positioning with concurrent selling pressure demonstrates classic distribution characteristics that precede major corrections.
Creating a COT Positioning Dashboard
Professional precious metals traders develop systematic approaches to monitor COT positioning signals across multiple timeframes and markets. Building a comprehensive dashboard helps identify emerging extremes before they become widely recognized.
Essential COT Metrics to Track:
Positioning Ratios:
- Speculator net long percentage of open interest (target: <15% bullish extreme, >35% bearish extreme)
- Commercial net short percentage of historical range (percentile ranking over 2-year period)
- Managed money net position change (3-week moving average to filter noise)
- Open interest change correlation with speculative positioning
Momentum Indicators:
- Weekly positioning change momentum (accelerating vs. decelerating extremes)
- Time at extreme levels (extremes become more reliable after 2-4 weeks persistence)
- Multiple market confirmation (gold/silver positioning alignment strengthens signals)
- VIX correlation during extreme phases (stress-driven vs. complacency extremes)
Dashboard Setup Recommendations:
Create alerts for key thresholds rather than daily monitoring. COT data releases Friday afternoons with Tuesday position data, creating 3-day lag that requires patience. Focus on weekly and monthly trend analysis rather than single-week position changes.
Our comprehensive CFTC COT guide provides detailed instructions for accessing and interpreting official positioning data, while advanced users can enhance analysis by incorporating disaggregated reports that separate managed money from other speculators.
Multi-Market COT Analysis
Silver and gold COT positioning often diverge due to different market dynamics, creating opportunities when one metal shows extreme positioning while the other remains neutral. Understanding these divergences enhances trading precision and risk management.
Gold-Silver COT Divergences:
Currently, gold shows elevated speculative positioning (39.6% of OI) approaching bearish extremes, while silver maintains neutral positioning (17.2% of OI). This divergence suggests:
- Gold faces higher risk of positioning-driven correction
- Silver may outperform during any precious metals weakness
- Gold/silver ratio adjustments likely favor silver near-term
- Portfolio allocation should consider relative positioning risks
Cross-Market Confirmation:
The strongest COT signals occur when positioning extremes align across related markets. Copper, platinum, and palladium COT data provides broader commodities context that enhances precious metals signal reliability.
Energy futures positioning (crude oil, natural gas) often precedes precious metals moves due to inflation linkages. When energy speculators reach bullish extremes while metals show bearish positioning, it creates potentially explosive precious metals setups as inflation expectations adjust.
Risk Management with COT Signals
COT positioning signals generate high-probability trade setups but require disciplined risk management due to timing uncertainties and potential for extreme positioning to persist longer than expected.
Position Sizing Guidelines:
- Limit COT-based trades to 2-3% of portfolio per setup
- Use wider stops than typical technical analysis due to extreme positioning persistence
- Scale into positions over 2-4 weeks rather than single entries
- Consider options strategies to limit downside while maintaining upside exposure
Stop Loss Management:
Traditional technical stops often fail during positioning extreme reversals due to initial false breakouts. Instead, focus on position-based stops:
- Exit if positioning extreme reverses without price follow-through (repositioning without price confirmation)
- Close positions if commercial positioning moves against trade thesis
- Reduce exposure if open interest expands rapidly against your position (new speculative interest)
Current market conditions with gold approaching bearish positioning extremes while silver remains neutral create asymmetric opportunities favoring silver exposure over gold, particularly through mining stock positions that benefit from operational leverage during metal price advances.
Advanced COT Signal Interpretation
Professional traders enhance basic COT analysis by incorporating additional data layers that improve signal reliability and timing precision. These advanced techniques separate successful positioning traders from those who struggle with false signals and poor timing.
Concentration Analysis:
The COT report includes concentration data showing how many large traders control significant portions of total positioning. High concentration increases volatility risk and signal reliability:
- When top 4 traders control >30% of net positions, moves become more violent but reliable
- Low concentration (<20%) suggests broad-based sentiment that's harder to reverse quickly
- Current gold concentration (17.3% long, 33.8% short) shows moderate levels supporting gradual rather than explosive moves
Producer/Merchant vs. Swap Dealer Breakdown:
Disaggregated COT reports separate commercial hedgers into producer/merchants (actual industry hedgers) and swap dealers (investment banks managing client flow). This breakdown provides crucial intelligence:
- Producer/merchant positioning reflects real industry supply/demand expectations
- Swap dealer positioning often represents client demand hedging and can shift rapidly
- Divergences between these groups signal internal commercial disagreement about market direction
Open Interest Context:
COT positioning must be analyzed within open interest context to understand whether extremes reflect new speculative interest or position concentration due to market contraction:
- Growing open interest with extreme positioning = new speculative capital entering (more reliable reversal signals)
- Stable/declining open interest with extremes = position concentration due to other traders exiting (less reliable signals)
- Current gold open interest decline (-5,303 contracts) suggests position concentration rather than new capital, moderating reversal expectations
Seasonal COT Patterns
Precious metals exhibit seasonal patterns that interact with COT positioning to create predictable signal timing. Understanding these cycles improves entry and exit timing for positioning-based strategies.
Gold Seasonal COT Patterns:
- Q1: Central bank buying creates commercial short covering, often generating bullish extremes
- Q2: Wedding season physical demand in Asia supports commercial buying
- Q3: Harvest financing in agricultural countries creates gold selling pressure
- Q4: Holiday jewelry demand and year-end portfolio rebalancing drive speculative positioning
Silver Industrial Cycles:
Silver's industrial demand creates different seasonal positioning patterns:
- Q1: New year manufacturing ramp-up increases commercial buying
- Q2: Electronics production cycles peak, supporting industrial demand
- Q3: Back-to-school technology purchases maintain steady demand
- Q4: Holiday consumer electronics demand peaks before year-end inventory adjustments
Current February timing aligns with typical Q1 pattern where industrial users rebuild inventories while investment demand responds to macro policy changes. This seasonal backdrop supports silver's neutral positioning as balanced fundamental forces offset each other.
Technology and COT Analysis
Modern traders leverage technology to enhance COT analysis beyond manual report reading. Automated systems can identify positioning extremes, track historical patterns, and generate alerts when tradeable setups develop.
Algorithmic COT Screening:
Successful systematic approaches include:
- Z-score analysis comparing current positioning to 2-year historical averages
- Moving average convergence/divergence of speculator vs. commercial positioning
- Pattern recognition algorithms identifying similar historical extreme periods
- Multi-market correlation analysis detecting cross-commodity positioning themes
Real-Time Integration:
While COT data releases with a 3-day lag, integrating with real-time price action and volume analysis helps time entries within positioning cycles:
- Volume spike analysis during COT extreme periods (institutional activity confirmation)
- Price momentum divergence from positioning trends (early reversal signals)
- Options market sentiment correlation with COT positioning extremes
- Currency market positioning alignment (DXY futures COT data)
The SilverOfTruth app integrates COT analysis with real-time inventory tracking and price data, providing comprehensive positioning context unavailable from COT reports alone. Track positioning signals live alongside COMEX inventory data for complete market intelligence.
FAQ
Q: How long do COT positioning extremes typically persist before reversals occur? A: COT positioning extremes can persist 2-8 weeks before significant reversals begin. Bullish extremes (oversold conditions) tend to reverse faster than bearish extremes due to forced liquidation dynamics. The key is waiting for confirmation through commercial hedger behavior changes rather than timing immediate reversals.
Q: What percentage of open interest constitutes a positioning extreme in precious metals? A: For precious metals, speculator net long positions above 35-40% of open interest typically signal bearish extremes, while positions below 10-15% indicate bullish extremes. However, these thresholds should be adjusted for historical context and current market conditions rather than applied rigidly.
Q: Can COT signals work for short-term trading or are they only useful for longer-term positioning? A: COT signals work best for medium-term trades lasting 4-12 weeks. The 3-day data lag and gradual development of extremes make them unsuitable for day trading but excellent for swing trading and intermediate-term positioning strategies.
Q: How do I distinguish between commercial hedging and speculative activity in COT reports? A: The disaggregated COT report separates producer/merchants (true hedgers) from swap dealers (often client flow). Focus on producer/merchant positioning for pure hedging signals, while swap dealer activity reflects broader institutional sentiment and client positioning.
Q: Do COT positioning signals work equally well in both bull and bear markets? A: COT signals tend to be more reliable during bear markets when positioning extremes are driven by capitulation and forced selling. In strong bull markets, speculative extremes can persist longer as momentum attracts new buyers, making timing more challenging but potential rewards larger when reversals eventually occur.
Track COT positioning extremes and contrarian signals in real-time with the SilverOfTruth app — available on the App Store. Get instant alerts when speculator positioning reaches tradeable extremes across gold, silver, and other precious metals markets.
Disclaimer: This article is for informational and educational purposes only and does not constitute financial, investment, or trading advice. Past performance is not indicative of future results. Always conduct your own research and consult with a qualified financial advisor before making investment decisions. SilverOfTruth provides market data and analysis tools — it does not provide personalized financial advice.