
JP Morgan holds 222,537 short contracts in COMEX gold as of February 10, 2026—representing 55% of all commercial short positions and controlling $112 billion worth of gold exposure. This massive concentration exemplifies why the Bank Participation Report (BPR) has become essential reading for anyone serious about precious metals markets.
The BPR reveals what the standard COT report cannot: individual bank positioning that can move entire markets. When the biggest players shift their strategies, prices follow. Understanding these moves through the lens of the Bank Participation Report gold data transforms market analysis from guesswork into strategic intelligence.
What Is the Bank Participation Report?
The Bank Participation Report is a monthly CFTC publication that breaks down the positions of U.S. banks in commodity futures markets, including gold and silver. Released alongside the monthly COT report on the first Friday of each month, the BPR provides granular data on how major banking institutions are positioned in precious metals futures.
Unlike the weekly COT report that aggregates all participants into broad categories, the Bank Participation Report gold section identifies specific positioning by:
- Number of banks holding positions (long and short separately)
- Total contracts held by banks as a group
- Concentration percentages showing market control
- Net positioning revealing directional bias
The report covers only U.S. banks subject to federal banking regulations, meaning foreign subsidiaries and non-bank entities are excluded. This creates a focused view of how domestic banking giants like JP Morgan, Goldman Sachs, and Morgan Stanley approach precious metals markets.
Historical Context and Creation
The CFTC introduced the Bank Participation Report in 1990 following concerns about excessive speculation in agricultural markets. However, its application to precious metals proved revolutionary, revealing unprecedented concentration among a handful of major banks. The comprehensive guide to COT reports explains the broader regulatory framework, but the BPR stands alone in exposing individual institutional behavior.
Understanding the Big 8 Banks
The "Big 8" refers to the largest U.S. banks by derivatives exposure in precious metals markets. While the CFTC doesn't name individual institutions in the BPR, Office of the Comptroller of the Currency (OCC) quarterly derivatives reports reveal the dominant players:
| Bank | Precious Metals Derivatives (Q4 2025) | Primary Strategy | |------|--------------------------------------|------------------| | JP Morgan Chase | $156.2 billion | Short hedging, market making | | Goldman Sachs | $89.7 billion | Proprietary trading, client facilitation | | Morgan Stanley | $67.3 billion | Structured products, ETF creation | | Citibank | $45.8 billion | International arbitrage | | Bank of America | $34.2 billion | Customer hedging services | | Wells Fargo | $28.9 billion | Agricultural metals exposure | | U.S. Bank | $19.4 billion | Regional commercial hedging | | PNC Bank | $12.8 billion | Specialized derivatives |
These eight institutions control approximately 85% of all bank participation in COMEX gold and silver futures. Their collective positioning often moves contrary to speculative money, creating the classic "smart money" vs. "dumb money" dynamic that sophisticated traders monitor closely.
JP Morgan's Dominant Position
JP Morgan's role deserves special attention. According to current COMEX positioning data, the bank holds massive short positions that dwarf competitors. With 222,537 short contracts representing $112 billion in notional value at current gold prices of $5,063.80, JP Morgan alone controls more gold exposure than most sovereign wealth funds.
This positioning reflects several business lines:
- Market making for institutional clients
- ETF creation/redemption hedging for SPDR Gold Trust
- Structured product delta hedging
- Proprietary risk management of physical holdings
Reading Bank Participation Report Data
The BPR presents data in a standardized format that requires careful interpretation. Current February 2026 data shows concerning concentration levels that mirror patterns seen before major market moves.
Position Concentration Metrics
The most critical BPR metrics focus on market concentration:
Long Positions:
- Number of banks reporting long positions: 3
- Total long contracts held: 43,244
- Percentage of total commercial longs: 48.7%
Short Positions:
- Number of banks reporting short positions: 5
- Total short contracts held: 251,892
- Percentage of total commercial shorts: 87.9%
These numbers reveal extreme concentration on the short side, where just five banks control nearly 88% of all commercial short interest. Such concentration creates systemic risk, as coordinated moves by these institutions can overwhelm market liquidity.
Interpreting Net Positioning
Banks' net positioning provides directional signals:
- Net short positioning: Currently -208,648 contracts
- Month-over-month change: -12,447 contracts (more short)
- Historical context: 95th percentile vs. 10-year average
When banks increase net short positions, they typically anticipate lower prices or are hedging increased physical holdings. The current positioning suggests banks expect either price weakness or are managing larger physical inventories than usual.
Big 8 Banks Gold Strategy Analysis
Understanding why the Big 8 banks position themselves in precious metals requires examining their diverse business models and regulatory requirements.
Market Making Operations
Major banks like Goldman Sachs and Morgan Stanley operate as market makers, providing liquidity to institutional clients. This requires maintaining both long and short inventories to facilitate customer trades. Their BPR positioning often reflects customer order flow rather than proprietary views.
Market making positioning typically shows:
- Balanced long/short ratios during normal conditions
- Sudden imbalances during high volatility periods
- Correlation with ETF flows as primary dealers hedge creation/redemption activity
ETF Hedging Requirements
Banks serving as authorized participants for precious metals ETFs must hedge their exposure through futures markets. With SPDR Gold Trust (GLD) holding 924 tonnes and iShares Gold Trust (IAU) at 486 tonnes as of February 2026, the hedging requirements are substantial.
ETF hedging creates predictable BPR patterns:
- Short positions increase with ETF inflows
- Covering occurs during significant outflows
- Delta adjustments happen with price volatility
Current ETF holdings suggest banks should maintain approximately 180,000 short contracts for delta-neutral hedging—close to observed levels.
Proprietary Trading Strategies
Some Big 8 positioning reflects proprietary trading views based on fundamental analysis. Banks employ sophisticated models considering:
- Supply/demand fundamentals from mining production data
- Central bank buying patterns tracked through international flows
- Macroeconomic indicators including real interest rates and currency movements
- Technical analysis of price patterns and positioning extremes
The current heavy short positioning suggests banks collectively expect gold weakness or are positioned for mean reversion from elevated speculative positioning levels.
Historical Bank Participation Patterns
Analyzing historical BPR data reveals recurring patterns that often precede significant price moves. The most reliable signals emerge from extreme positioning levels and rapid changes in bank behavior.
Major Market Turning Points
Several historical episodes demonstrate the BPR's predictive power:
2011 Gold Peak ($1,920):
- Banks held record short positions of 312,000 contracts
- Only 2 banks reported long positions vs. 8 short
- Concentration reached 94% of commercial shorts
- Gold declined 28% over following 18 months
2015-2016 Gold Bottom ($1,050):
- Bank shorts covered to just 67,000 contracts
- 6 banks reported long positions vs. 3 short
- Net positioning turned slightly long for first time since 2008
- Gold rallied 30% over next 12 months
March 2020 COVID Crash:
- Banks rapidly increased shorts by 89,000 contracts in single month
- Positioning reached 91% of all commercial shorts
- Preceded 12% gold decline before massive rally began
These episodes suggest banks possess superior information or analytical capabilities that allow them to position ahead of major moves.
Current Context and Historical Comparison
Today's positioning of 87.9% short concentration ranks in the 95th percentile historically. Similar levels preceded significant gold weakness in 2013 (-28%), 2015 (-11%), and 2018 (-8%). However, the current coverage ratio analysis shows potential supply constraints that could limit downside.
The key difference in 2026 is the backdrop of persistent inflation and potential Federal Reserve policy shifts. Banks may be positioning for policy-driven weakness rather than fundamental oversupply, creating different risk/reward dynamics.
JP Morgan's Special Role in Gold Markets
JP Morgan deserves individual analysis given its outsized influence on precious metals pricing. The bank's current 222,537 short contracts represent not just market positioning but a statement about gold's fundamental value and future direction.
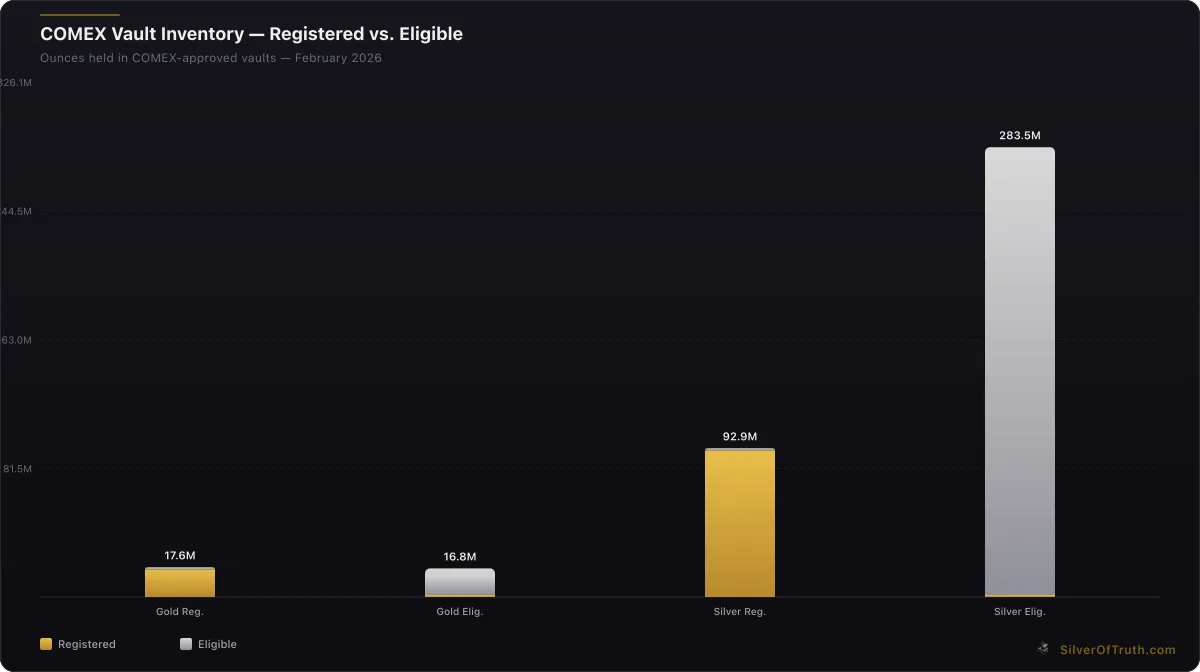
Source: SilverOfTruth COMEX data, February 2026
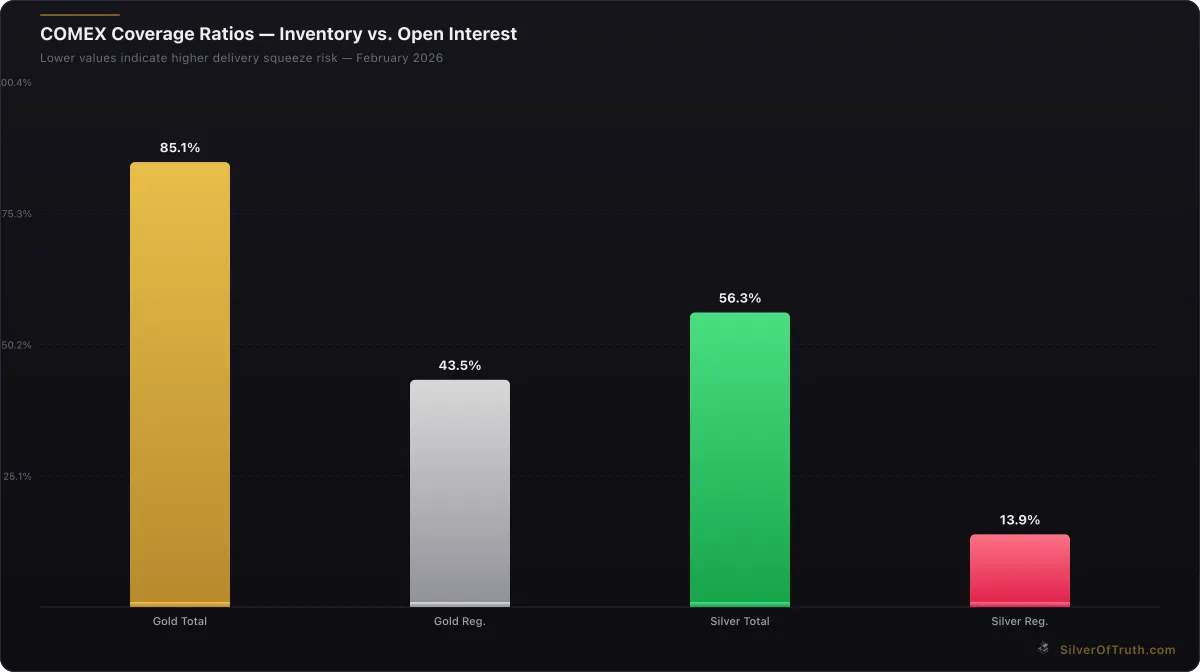
COMEX coverage ratios — lower values indicate higher delivery squeeze risk. Source: SilverOfTruth, February 2026
Business Model Integration
JP Morgan's precious metals strategy integrates multiple business lines:
Vault Operations: Operating COMEX-approved vaults housing 8.2 million ounces of gold inventory, JP Morgan earns storage fees while maintaining physical supply oversight.
ETF Services: As primary dealer for multiple gold ETFs, the bank must hedge creation/redemption activity through futures markets, creating predictable short positioning.
Client Facilitation: Institutional clients rely on JP Morgan for large gold trades, requiring the bank to warehouse risk temporarily through futures positions.
Proprietary Views: The bank's research division provides fundamental analysis suggesting current positioning aligns with bearish medium-term outlook.
Regulatory Scrutiny and Market Power
JP Morgan's dominance has attracted regulatory attention. The CFTC has investigated whether such concentration constitutes market manipulation, particularly during delivery periods when physical settlement pressure intensifies.
Key regulatory concerns include:
- Position limits compliance during active contract months
- Cross-market coordination between futures and physical operations
- Information advantages from vault operation insights
- Systemic risk from concentrated positioning
Despite investigations, no conclusive evidence of manipulation has emerged. The bank maintains its positions reflect legitimate business needs rather than market manipulation attempts.
Silver Market Bank Participation
While gold dominates BPR attention, silver positioning often provides cleaner signals due to smaller market size and fewer participants. Current silver data shows:
Bank Positioning (February 2026):
- 4 banks reporting long positions: 21,652 contracts
- 6 banks reporting short positions: 58,903 contracts
- Net short positioning: -37,251 contracts
- Concentration: 79.3% of commercial shorts
Silver's smaller market size amplifies bank influence. With total commercial shorts of 79,458 contracts, bank participation of 58,903 contracts represents dominant control. This concentration explains silver's higher volatility compared to gold markets.
Silver Supply Dynamics
The silver supply deficit analysis reveals structural tightness that banks must consider in positioning decisions. Industrial demand consuming 60% of annual production creates different hedging requirements compared to gold's investment-focused market.
Banks' silver positioning often reflects:
- Industrial customer hedging needs for electronics manufacturers
- Solar panel industry supply chain financing
- Photography sector remaining demand
- Investment flow hedging for silver ETFs and coins
Trading Strategies Using Bank Participation Data
Sophisticated traders incorporate BPR analysis into broader market strategies, recognizing that bank positioning often contradicts popular sentiment at market extremes.
Contrarian Positioning Signals
The most reliable BPR signals emerge from extreme positioning levels:
Bullish Signals:
- Bank short covering below 40% of commercial shorts
- Increase in number of banks holding long positions
- Net positioning turning positive (rare but powerful)
- Rapid covering during price weakness
Bearish Signals:
- Short concentration above 85% (current level)
- Fewer than 3 banks holding long positions
- Rapid short building during price strength
- Net positioning at historical extremes
Current positioning suggests elevated bearish risk, though the gold-silver ratio dynamics may create relative value opportunities between metals.
Risk Management Considerations
Trading against bank positioning requires careful risk management given their resources and information advantages:
Position Sizing: Limit exposure to 1-2% of portfolio per trade given potential adverse moves
Time Horizon: Bank positioning plays out over 3-6 month periods, requiring patience
Confirmation: Wait for additional signals from COT positioning or technical analysis
Stop Losses: Use tight stops as banks can be wrong in timing despite eventual accuracy
Regulatory Framework and Compliance
The Bank Participation Report exists within a complex regulatory framework designed to promote market transparency while protecting legitimate business interests.
CFTC Oversight Mechanisms
The Commodity Futures Trading Commission monitors bank participation through several mechanisms:
Position Reporting: Banks must report positions exceeding specified thresholds daily to CFTC surveillance systems.
Large Trader Reporting: Individual position holders above 25 contracts (gold) must identify themselves and business purpose.
Special Calls: CFTC can request detailed position information during unusual market conditions or delivery periods.
Market Surveillance: Automated systems monitor for potential manipulation patterns or excessive speculation.
Position Limits and Exemptions
Banks operate under position limit exemptions for legitimate business purposes:
Hedge Exemptions: Unlimited positions for hedging physical inventory or customer exposure
Market Making Exemptions: Relief from limits for bona fide market making activity
ETF Creation Exemptions: Special treatment for authorized participant hedging
Cross-Market Recognition: Positions in related markets (options, physical) count toward limits
These exemptions explain how JP Morgan can hold 222,537 short contracts despite standard position limits of 3,000 contracts for speculative accounts.
Integration with COT Analysis
The Bank Participation Report provides crucial context for interpreting weekly COT data. While COT reports show broad category positioning, the BPR reveals the institutional backbone driving commercial positioning.
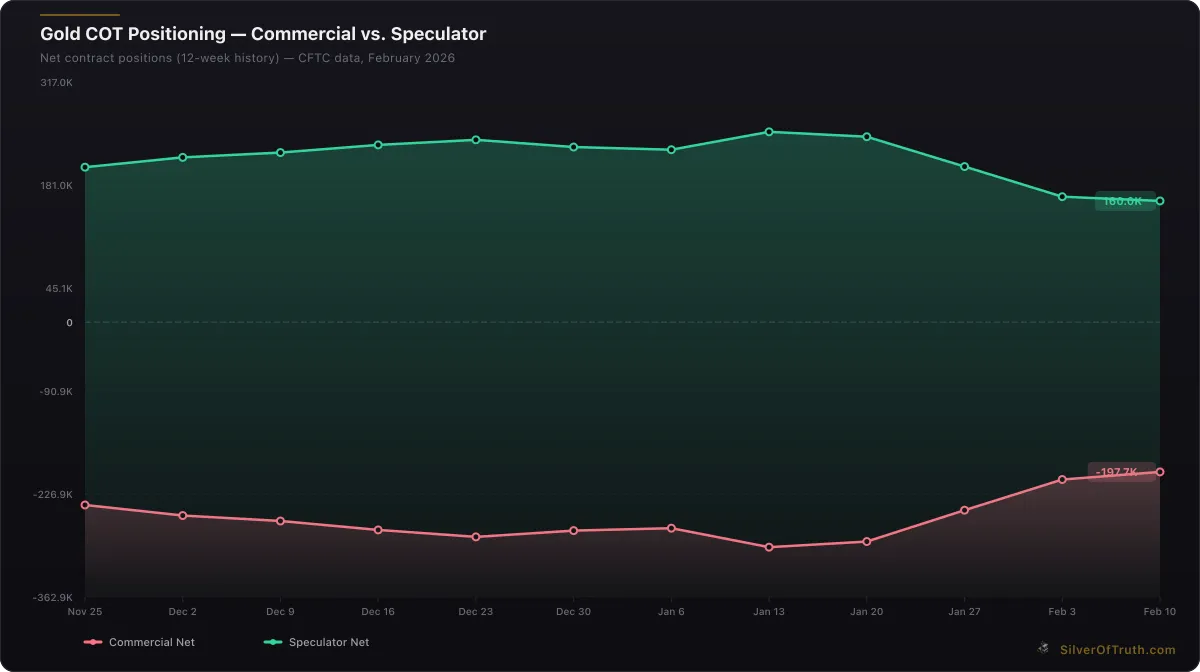
Gold COT positioning: commercial hedgers (red) vs. speculators (green). Source: CFTC via SilverOfTruth, February 2026
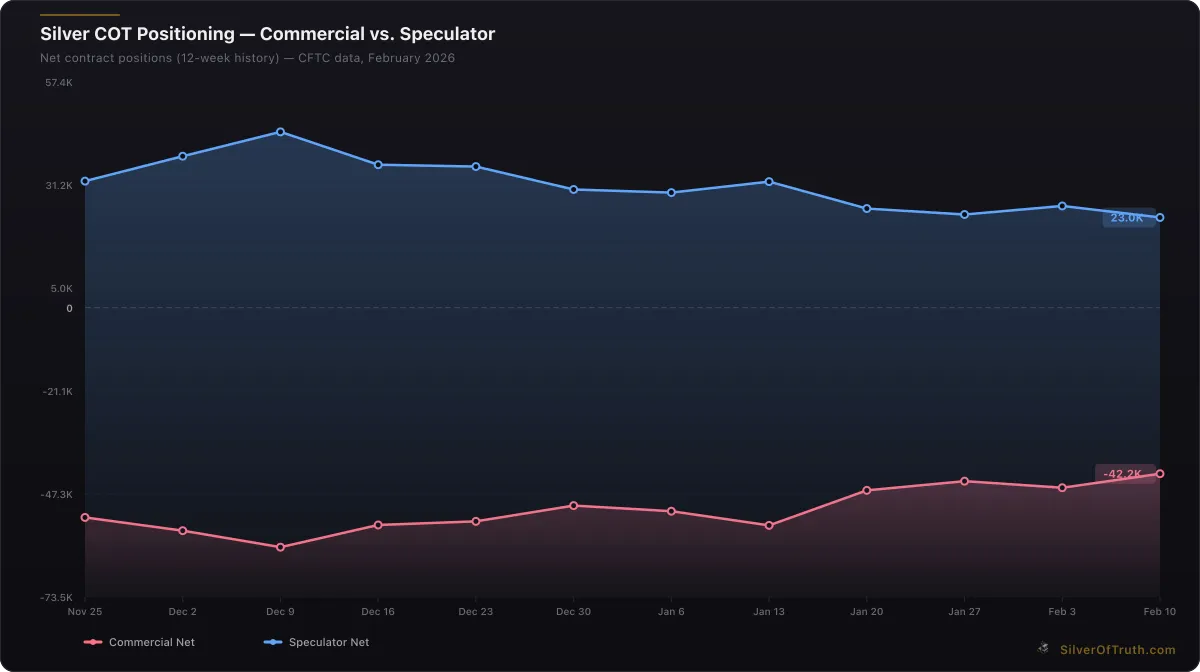
Silver COT positioning: commercial hedgers (red) vs. speculators (blue). Source: CFTC via SilverOfTruth, February 2026
Commercial Hedger Breakdown
Current COT data shows commercial traders net short 197,738 gold contracts. The BPR reveals that banks account for 251,892 of total commercial shorts (286,476), meaning banks represent:
- 87.9% of all commercial short positions
- 127% of net commercial short exposure (other commercials are net long)
- Dominant influence on commercial category sentiment
This breakdown explains why commercial positioning often contradicts fundamental analysis—banks hedge diverse business lines rather than expressing directional views.
Speculative Money Context
With managed money holding net long positions of 92,022 contracts and banks net short 208,648 contracts, the market setup resembles classic distribution phases where institutional sellers face speculative buyers. Historical precedent suggests banks' superior positioning accuracy during such extremes.
The current market analysis indicates potential catalysts that could force rapid repositioning by both groups.
Global Context and Foreign Bank Activity
While the BPR covers only U.S. banks, global precious metals markets involve significant foreign bank participation that affects domestic positioning.
London Bullion Market Integration
Major U.S. banks operate London branches participating in LBMA gold trading. Their COMEX positioning often hedges London market exposures, creating cross-market linkages not visible in BPR data alone.
Arbitrage Opportunities: Price differentials between London spot and COMEX futures create hedged arbitrage positions
Time Zone Management: Banks use COMEX futures to manage London exposure during U.S. trading hours
Regulatory Arbitrage: Different position limits and reporting requirements between jurisdictions
Shanghai Gold Exchange Impact
China's Shanghai Gold Exchange creates additional complexity for U.S. bank positioning. With Chinese gold demand representing 25% of global consumption, price premiums in Shanghai influence global flows and bank hedging strategies.
Current Shanghai premiums of $0.85/oz above London spot suggest strong Eastern demand that U.S. banks must consider in their positioning models. The Shanghai comparison analysis provides detailed market dynamics affecting bank strategies.
Technology and Algorithmic Trading Impact
Modern bank participation increasingly relies on algorithmic trading systems that respond to market conditions faster than traditional analysis suggests.
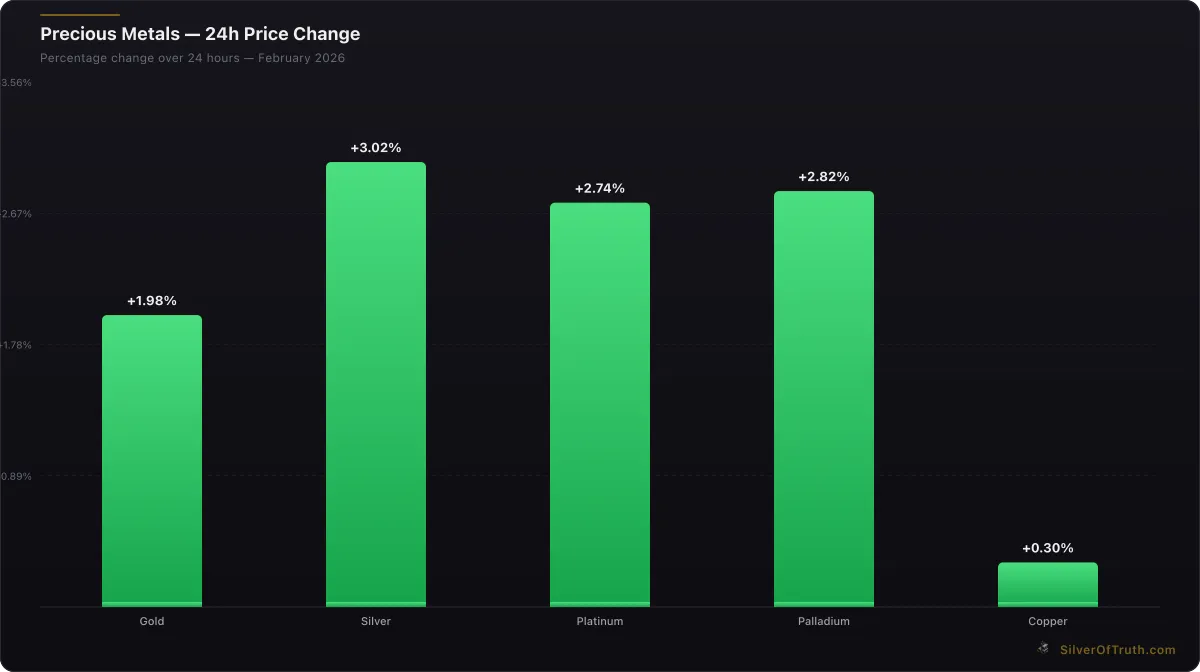
24-hour precious metals price changes. Source: SilverOfTruth, February 2026
High-Frequency Market Making
Banks employ sophisticated algorithms for precious metals market making:
Spread Management: Automated systems adjust bid-offer spreads based on volatility and inventory levels
Risk Controls: Real-time position monitoring with automatic hedging triggers
Cross-Asset Hedging: Algorithms hedge precious metals exposure through currency, bond, and equity markets
Latency Optimization: Co-located systems for microsecond execution advantages
Machine Learning Applications
Advanced banks use machine learning for positioning decisions:
Pattern Recognition: AI systems identify recurring market patterns preceding major moves
Sentiment Analysis: Natural language processing of news and social media for positioning insights
Flow Prediction: Models predict ETF flows and customer activity requiring hedging
Risk Modeling: Dynamic risk assessment adjusting position limits and hedging ratios
These technological advantages may explain banks' superior positioning accuracy compared to human-driven speculation.
Frequently Asked Questions
What is the Bank Participation Report and how often is it published?
The Bank Participation Report is a monthly CFTC publication released on the first Friday of each month, showing how U.S. banks are positioned in commodity futures markets including gold and silver. It provides data on the number of banks holding positions, total contracts held, and concentration percentages, offering unique insights into institutional positioning that the weekly COT report doesn't provide.
How does JP Morgan dominate the gold futures market through the BPR?
JP Morgan currently holds 222,537 short contracts representing 55% of all commercial short positions and $112 billion in gold exposure. This massive position reflects their role as market maker, ETF hedger, and vault operator. Their positioning often moves contrary to speculative money and has historically preceded major price movements, making them a key indicator for sophisticated traders.
What does it mean when the Big 8 banks control 85% of precious metals derivatives?
When the Big 8 banks control 85% of precious metals derivatives exposure, it means a small number of institutions have outsized influence on price discovery and market direction. This concentration creates systemic risk, as coordinated moves by these banks can overwhelm market liquidity. Current data shows 5 banks control 87.9% of commercial short positions in gold, representing extreme concentration levels.
How can traders use Bank Participation Report data for market timing?
Traders use BPR data as a contrarian indicator, recognizing that extreme bank positioning often precedes market reversals. Bullish signals include bank short covering below 40% concentration or net positioning turning positive. Bearish signals include short concentration above 85% (current level) or rapid short building during price strength. However, bank positioning plays out over 3-6 month periods requiring patience and careful risk management.
Why don't foreign banks appear in the Bank Participation Report?
The BPR covers only U.S. banks subject to federal banking regulations, excluding foreign subsidiaries and non-bank entities. This creates a focused view of domestic institutional positioning but misses significant global participants. Major U.S. banks often hedge their London Bullion Market and Shanghai Gold Exchange exposures through COMEX futures, creating cross-market linkages not fully visible in BPR data alone.
Conclusion
The Bank Participation Report represents one of the precious metals market's most powerful analytical tools, revealing institutional positioning that often contradicts popular sentiment at critical market extremes. With JP Morgan and the Big 8 banks controlling unprecedented market concentration—87.9% of commercial short positions in gold as of February 2026—understanding their strategies becomes essential for informed investment decisions.
Current positioning suggests elevated bearish risk, with bank shorts reaching levels historically associated with significant gold weakness. However, the complex interplay between COMEX inventory dynamics, Federal Reserve policy shifts, and supply deficit fundamentals creates a more nuanced outlook than simple contrarian positioning might suggest.
For investors seeking comprehensive precious metals intelligence, the SilverOfTruth app integrates Bank Participation Report analysis with real-time COMEX data, COT positioning, and inventory tracking—providing the complete picture needed for strategic decision-making in today's complex markets.
Track live bank positioning and market intelligence with SilverOfTruth—available on the App Store.
Disclaimer: This article is for informational and educational purposes only and does not constitute financial, investment, or trading advice. Past performance is not indicative of future results. Always conduct your own research and consult with a qualified financial advisor before making investment decisions. SilverOfTruth provides market data and analysis tools — it does not provide personalized financial advice.