
CFTC COT data reveals the positioning of major market participants across commodity futures markets, providing institutional-grade insights typically reserved for professional traders. The Commodity Futures Trading Commission publishes these Commitments of Traders reports every Friday, offering a transparent window into futures positioning that can signal potential market turning points. This comprehensive guide covers everything from official download sources to advanced analysis techniques, helping you access and interpret the same positioning data that institutional investors use to time their precious metals decisions. Whether you're new to COT analysis or looking to refine your approach, understanding where to find and how to read this data provides the foundation for informed trading strategies.
Understanding CFTC COT Reports
The Commitments of Traders report represents the most comprehensive public dataset on futures market positioning available anywhere. Published weekly by the CFTC, these reports aggregate position data from futures exchanges across all major commodity markets, including precious metals traded on COMEX.
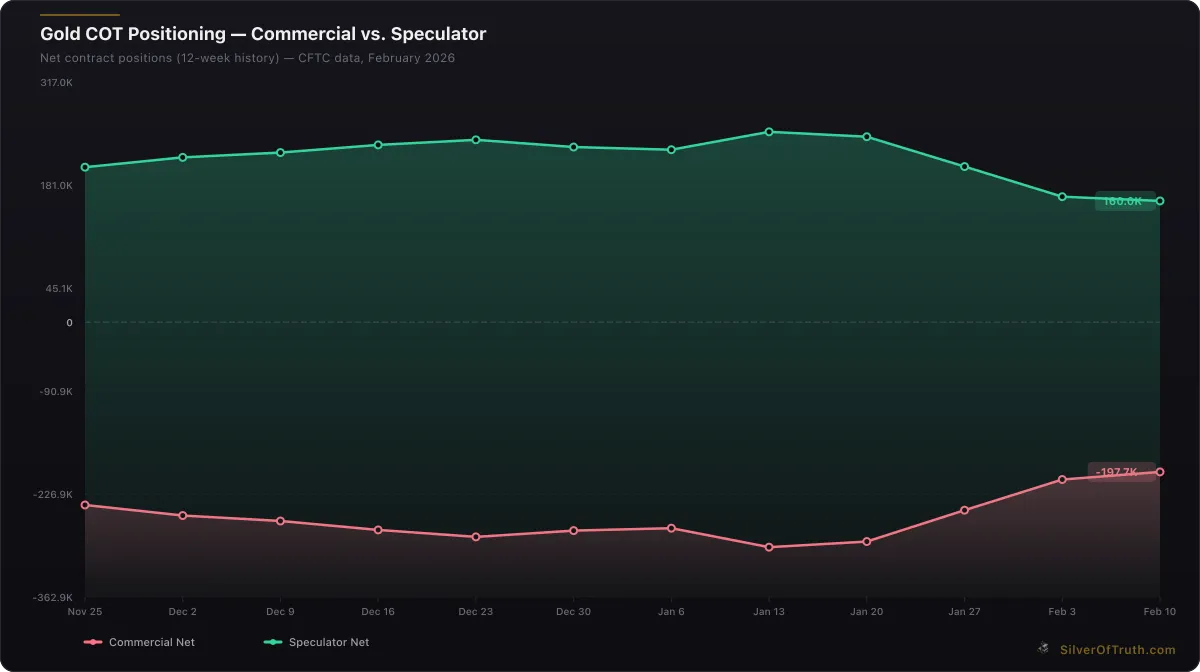
Gold COT positioning: commercial hedgers (red) vs. speculators (green). Source: CFTC via SilverOfTruth, February 2026
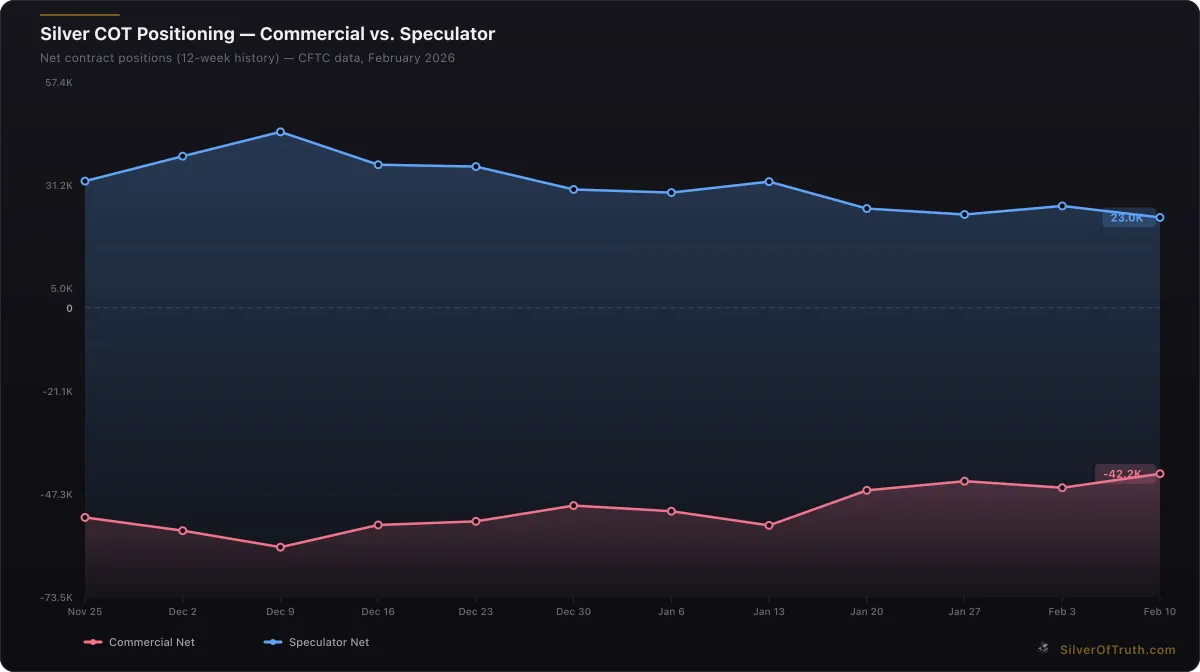
Silver COT positioning: commercial hedgers (red) vs. speculators (blue). Source: CFTC via SilverOfTruth, February 2026
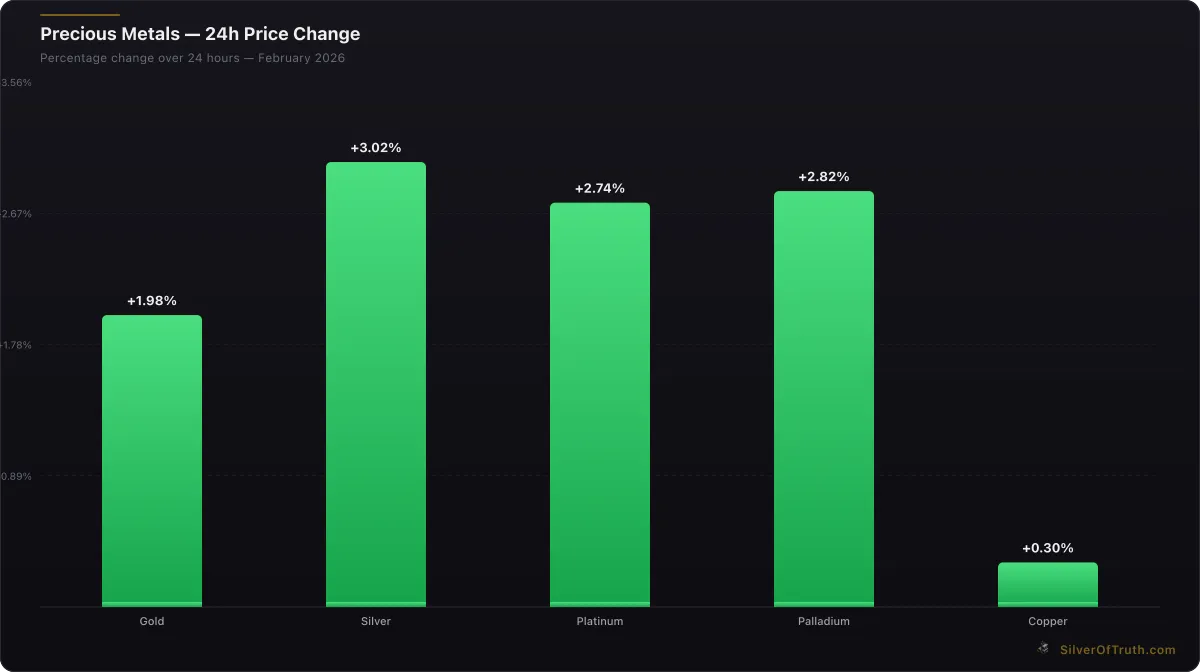
24-hour precious metals price changes. Source: SilverOfTruth, February 2026
COT data breaks down market participants into distinct categories based on their trading purpose and size. Commercial traders represent producers, processors, and large consumers who use futures contracts for hedging business operations. In precious metals, this includes mining companies hedging future production, jewelry manufacturers locking in costs, and bullion dealers managing inventory risk.
Non-commercial traders, often called speculators or large traders, include hedge funds, pension funds, and other institutional investors seeking profit from price movements rather than hedging commercial exposure. These participants typically follow trends and momentum, making their positioning a key sentiment indicator.
Non-reportable positions capture smaller traders below CFTC reporting thresholds. While individual positions are small, their collective behavior often reflects retail investor sentiment and can provide contrarian signals during market extremes.
The disaggregated COT format further divides non-commercials into managed money (CTAs and hedge funds) and other reportables (pension funds, endowments), while separating commercials into producer/merchant (miners, refiners) and swap dealers (banks facilitating client transactions).
For context on interpreting these categories, read our comprehensive guide to understanding COT reports, which explains how each trader type influences precious metals markets.
Official CFTC Data Sources
Primary CFTC Website Access
The official source for all COT data is the CFTC's Market Reports section, where reports are published every Friday at 3:30 PM ET. The legacy COT report covers the Tuesday close, creating a three-day publication lag that traders must account for when analyzing current positioning.
Key CFTC Data Downloads:
- Legacy COT Report: Basic trader category breakdown
- Disaggregated COT: Detailed subcategory analysis
- Traders in Financial Futures (TFF): Currency and treasury positions
- Cotton On-Call: Specific to cotton futures
The CFTC website provides data in multiple formats including text files, Excel spreadsheets, and historical archives dating back to 1986. However, the interface remains deliberately basic, reflecting the commission's regulatory rather than commercial focus.
Historical Data Archives
Historical COT data spans over four decades, providing essential context for current positioning levels. The CFTC maintains complete archives accessible through their historical data section, though navigating these files requires understanding their coding structure.
Data File Naming Convention:
- Annual files:
annualof[YEAR].txt(e.g., annualof2026.txt) - Short format:
deacot[YEAR].txtfor disaggregated data - Compressed files available for bandwidth efficiency
Historical analysis reveals positioning patterns around major market turning points. For example, commercial gold shorts exceeding 300,000 contracts historically coincided with significant price bottoms, while speculative longs above 250,000 contracts often marked temporary tops.
Third-Party Data Aggregators
While the CFTC provides raw data, several services enhance accessibility and analysis capabilities:
Moore Research Center offers cleaned COT data with additional calculations and charts, though their focus extends beyond precious metals to agricultural and energy markets.
Barchart.com provides free COT data visualization with basic charting tools, making it easier to track positioning trends over time without manual spreadsheet manipulation.
Professional services like Bloomberg and Refinitiv offer integrated COT data within their terminal platforms, but these carry substantial subscription costs that may not be justified for individual precious metals investors.
Precious Metals COT Data Breakdown
Gold Futures Positioning
Gold futures trade under the GC symbol on COMEX, with each contract representing 100 troy ounces. Current open interest stands at 404,391 contracts, equivalent to 40.44 million ounces of gold exposure in the futures market.
Current Gold COT Snapshot (February 10, 2026):
- Commercial Net: -197,738 contracts (70.8% short, 21.9% long)
- Non-Commercial Net: +160,012 contracts (52.6% long, 13.1% short)
- Managed Money Net: +92,022 contracts (29.5% long, 6.7% short)
- Swap Dealers Net: -179,293 contracts (55.0% short, 10.7% long)
The current positioning reflects elevated speculative interest, with non-commercials holding 52.6% of open interest in long positions. This concentration suggests potential vulnerability to profit-taking, particularly given the recent -5,592 contract reduction in speculative longs as gold prices consolidated near $5,060 per ounce.
Commercial shorts at 286,476 contracts represent hedging activity from miners and dealers, but also create potential short-covering fuel if physical demand intensifies. Historical analysis shows commercial covering often accelerates once their net short position exceeds -200,000 contracts.
Our detailed gold COT analysis explores current positioning dynamics and their implications for near-term price action.
Silver Futures Analysis
Silver futures (SI symbol) carry 5,000-ounce contracts, with current open interest at 133,641 contracts representing 668.2 million ounces of exposure. Silver's smaller futures market creates higher volatility and more dramatic position swings compared to gold.
Current Silver COT Data (February 10, 2026):
- Commercial Net: -42,163 contracts (59.5% short, 27.9% long)
- Non-Commercial Net: +22,955 contracts (27.4% long, 10.3% short)
- Managed Money Net: +4,569 contracts (9.1% long, 5.7% short)
- Swap Dealers Net: -25,373 contracts (35.2% short, 16.2% long)
Silver's positioning appears more balanced than gold, with speculators holding just 17.2% of open interest in net long positions versus gold's 39.6%. This relatively neutral stance suggests silver positioning could move aggressively in either direction based on price momentum.
The commercial net short of -42,163 contracts is manageable by historical standards, where silver squeeze conditions typically emerge when commercial shorts exceed -80,000 contracts. However, the current COMEX silver inventory situation creates additional supply stress beyond what COT positioning alone suggests.
For deeper silver positioning analysis, review our comprehensive silver COT breakdown covering recent trend changes and their market implications.
Platinum and Palladium Coverage
Platinum (PL) and palladium (PA) futures carry smaller open interest but often exhibit more extreme positioning due to their industrial demand profiles and smaller investor bases.
Platinum positioning frequently reflects automotive industry hedging, as catalytic converter demand drives much commercial activity. Supply disruptions from South Africa routinely create positioning volatility as both producers and consumers adjust hedge ratios.
Palladium's positioning sensitivity to automotive production cycles and Russian supply concerns creates unique COT patterns. The metal's industrial focus means commercial positioning changes often precede rather than follow price moves, making COT analysis particularly valuable.
Interpreting COT Data for Market Timing
Commercial Positioning Signals
Commercial traders possess superior market information through their business operations, making their collective positioning a reliable contrarian indicator. When commercials establish large net short positions in gold or silver, they're essentially betting against higher prices based on supply/demand intelligence unavailable to speculators.
Key Commercial Thresholds:
- Gold: Net shorts exceeding -250,000 contracts historically mark buying opportunities
- Silver: Net shorts above -60,000 contracts suggest oversold conditions
- Coverage ratio: When commercial shorts exceed 70% of open interest, reversal probability increases
Current gold commercial shorts at -197,738 contracts approach but haven't reached extreme levels. However, when combined with COMEX registered inventory at just 43.5% coverage, the potential for short-covering rallies increases significantly.
Commercial positioning changes often precede price moves by 2-4 weeks, creating valuable timing intelligence for precious metals investors. Our analysis of speculator positioning shifts demonstrates how combining COT data with inventory metrics enhances timing accuracy.
Speculative Extremes and Reversal Patterns
Large speculative positions create the fuel for major price reversals through forced liquidation or short-covering. Extreme speculative positioning typically coincides with maximum price momentum in the position's direction, creating optimal contrarian entry points.
Bullish Setup Indicators:
- Speculative net longs below 50,000 contracts (gold) or 10,000 contracts (silver)
- Managed money net short positions
- Commercial net longs or minimal shorts
- Declining open interest with speculative selling
Bearish Setup Indicators:
- Speculative net longs exceeding 200,000 contracts (gold) or 40,000 contracts (silver)
- Commercial net shorts above -200,000 (gold) or -60,000 (silver)
- Rising open interest with speculative buying
- Concentration in top 4 long positions above 25%
Current positioning shows mixed signals, with gold speculation elevated but not extreme, while silver positioning appears more neutral. The bearish gold COT sentiment reflects distribution concerns as specs trim positions, though major reversal thresholds haven't been reached.
Concentration Risk Analysis
COT reports include concentration data showing the percentage of open interest held by the largest 4 and 8 traders in long and short positions. High concentration increases volatility risk, as large position changes by a few participants can drive significant price moves.
Current Concentration Levels:
- Gold: Top 4 longs hold 17.3%, shorts 33.8% of OI
- Silver: Top 4 longs hold 20.2%, shorts 33.7% of OI
Concentration above 25% in either direction suggests heightened volatility risk, while levels below 15% indicate more distributed positioning. Current levels show moderate concentration without extreme risk, though the high short concentration in both metals creates potential squeeze conditions if buying pressure emerges.
Advanced COT Analysis Techniques
Combining COT with Inventory Data
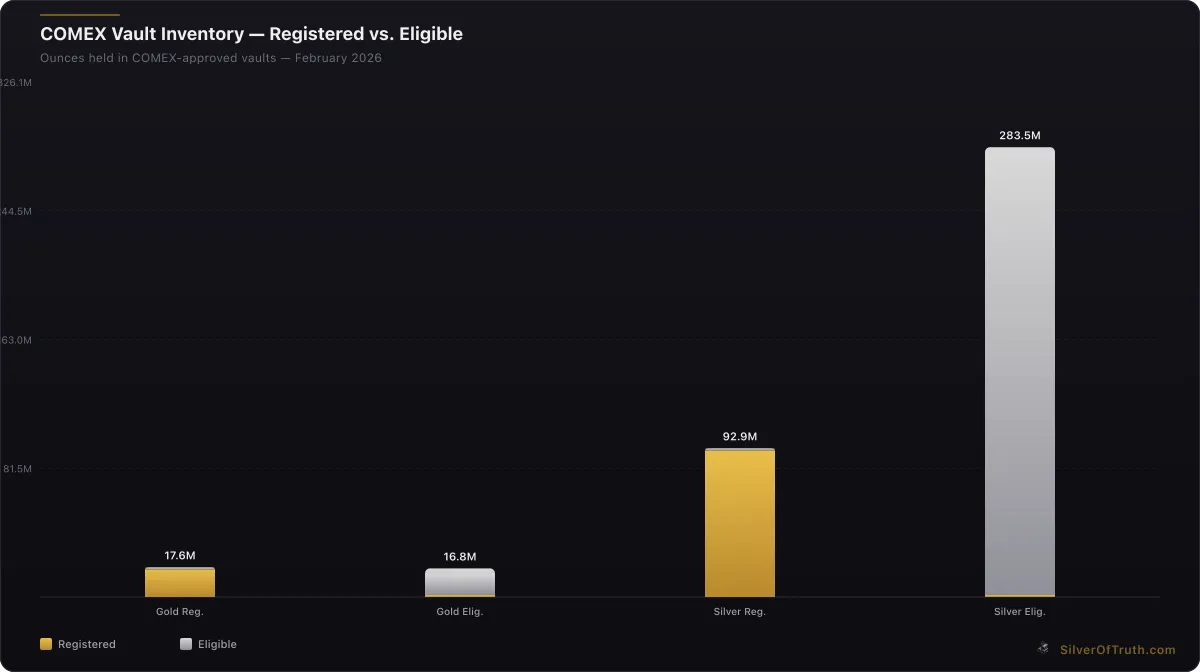
Source: SilverOfTruth COMEX data, February 2026
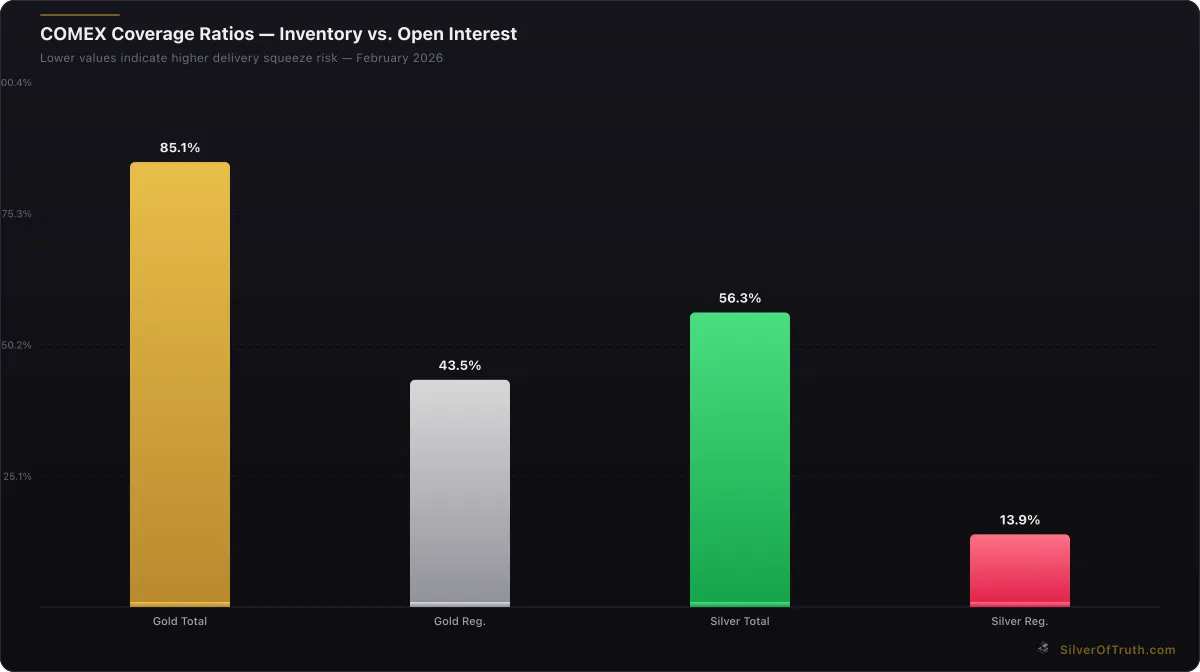
COMEX coverage ratios — lower values indicate higher delivery squeeze risk. Source: SilverOfTruth, February 2026
The most powerful precious metals analysis combines COT positioning with COMEX inventory levels and coverage ratios. This approach identifies potential supply squeezes before they manifest in price action.
Current conditions demonstrate this dynamic perfectly: while gold COT positioning shows modest speculative excess, the 43.5% registered coverage ratio creates supply constraints that could amplify any short-covering rally. Similarly, silver's neutral COT stance becomes more significant given the 13.9% registered coverage ratio indicating severe supply stress.
Integrated Analysis Framework:
- COT positioning reveals trader sentiment and potential reversal zones
- Inventory levels show physical supply constraints
- Coverage ratios indicate delivery squeeze probability
- Price momentum confirms or contradicts positioning signals
This multi-factor approach correctly identified the March 2020 silver squeeze when commercial shorts exceeded -70,000 contracts while registered inventory fell below 100 million ounces, creating perfect storm conditions for the subsequent rally.
For detailed coverage ratio analysis, see our comprehensive guide to COMEX registered vs eligible inventory.
Seasonal and Cyclical Patterns
COT positioning exhibits seasonal patterns driven by agricultural harvest cycles, jewelry demand patterns, and fiscal year-end portfolio adjustments. Understanding these cycles helps distinguish temporary positioning shifts from structural changes.
Gold Seasonal Patterns:
- Q1: Central bank buying increases commercial demand
- Q2: Wedding season drives jewelry fabrication hedging
- Q3: Harvest financing creates agricultural cross-hedging
- Q4: Portfolio rebalancing affects speculative positioning
Silver Industrial Cycles:
- Solar panel production peaks create Q2-Q3 commercial buying
- Electronics manufacturing cycles influence Q4-Q1 positioning
- Automotive production schedules affect quarterly commercial hedging
Current February positioning should account for year-end portfolio adjustments and Chinese New Year impacts on Asian demand patterns. The recent speculative selling in gold may reflect profit-taking from 2025 gains rather than fundamental bearishness.
Inter-Market Analysis
Precious metals COT analysis becomes more powerful when compared across related markets. Currency positioning in USD index futures, treasury bond positioning, and equity index COT data provide context for precious metals moves.
Key Correlations:
- USD Index COT: Strong dollar positioning often coincides with precious metals commercial buying
- Treasury COT: Bond speculative longs typically align with gold commercial shorts
- Equity Index COT: Stock market euphoria correlates with reduced gold speculation
Current dollar strength and bond market positioning suggest the macro environment may support commercial precious metals buying, even as COT positioning appears mixed within the metals complex itself.
Common COT Analysis Mistakes
Over-Interpreting Short-Term Changes
Weekly COT changes reflect noise as much as signal, particularly in volatile markets. Single-week position changes rarely indicate major trend shifts, requiring multiple-week confirmation before acting on positioning signals.
The recent -5,592 contract reduction in gold speculative longs appears significant but represents just 1.4% of total open interest. Without accompanying inventory stress or fundamental changes, this positioning shift may prove temporary.
Ignoring Position Context
Absolute position levels matter more than weekly changes. A 10,000 contract increase in speculative longs has different implications when total longs are 50,000 versus 200,000 contracts.
Current gold speculative longs at 212,808 contracts remain elevated by historical standards despite recent reductions. Context suggests continued distribution risk rather than oversold conditions.
Timing Precision Expectations
COT analysis identifies medium-term trends and reversal zones rather than precise entry points. Attempting to trade COT signals with tight stops often results in premature exits before positioning extremes resolve.
Successful COT-based strategies typically require 4-8 week holding periods to capture the full impact of positioning adjustments, making this approach better suited for position trading than day trading.
Using COT Data in Investment Decisions
Portfolio Allocation Strategies
COT data helps optimize precious metals allocation timing within broader investment portfolios. Extreme positioning often coincides with attractive accumulation or distribution zones for long-term investors.
Accumulation Signals:
- Commercial net positions turn positive or reach minimal shorts
- Speculative positioning falls to multi-month lows
- Open interest declines with speculative selling
- Price weakness persists despite improving fundamentals
Distribution Signals:
- Commercial shorts exceed historical averages
- Speculative longs reach euphoric levels
- Open interest surges with momentum buying
- Price strength continues despite deteriorating positioning
Current mixed signals suggest a transitional period where patient accumulation may be rewarded, particularly in silver where positioning appears more balanced despite inventory constraints.
Risk Management Applications
COT concentration data helps assess position-size risk and volatility expectations. High concentration periods require smaller position sizes due to increased volatility from large trader actions.
Current moderate concentration levels suggest normal volatility expectations, though the combination with inventory constraints could create asymmetric upside volatility if supply disruptions emerge.
Timing Physical vs Paper Exposure
COT analysis helps optimize the mix between physical precious metals ownership and paper exposure through ETFs or futures. Extreme commercial short positions often coincide with attractive physical accumulation opportunities, while speculative extremes favor paper trading approaches.
Current positioning suggests maintaining physical core positions while potentially reducing paper exposure until clearer directional signals emerge from both positioning and inventory data.
FAQ Section
Where can I download free CFTC COT data?
The official source is the CFTC website at cftc.gov, which publishes reports every Friday at 3:30 PM ET covering the prior Tuesday's positions. Data is available in text and Excel formats with historical archives dating back to 1986. Third-party sites like Barchart.com also provide free access with basic charting tools.
How often is COT data updated?
COT reports are published weekly every Friday afternoon, covering positions as of the prior Tuesday's close. This creates a 3-day publication lag that traders must account for. The CFTC does not publish intraweek updates, making Friday releases the only official position data available.
What's the difference between legacy and disaggregated COT reports?
Legacy COT reports divide traders into three categories: commercial, non-commercial, and non-reportable. Disaggregated reports provide additional detail by splitting non-commercials into "managed money" and "other reportables," while dividing commercials into "producer/merchant" and "swap dealers." The disaggregated format offers better insight into hedge fund versus institutional positioning.
How do I identify extreme COT positioning levels?
Extreme levels are relative to historical ranges rather than absolute numbers. For gold, commercial net shorts exceeding -250,000 contracts historically indicate oversold conditions, while speculative net longs above 200,000 suggest distribution risk. Silver extremes typically occur around -60,000 commercial shorts or +40,000 speculative longs. Current positioning should be compared to 2-year ranges.
Can COT data predict exact price turning points?
COT analysis identifies medium-term trend changes and reversal zones rather than precise timing. Extreme positioning creates the conditions for reversals but requires fundamental catalysts to trigger actual moves. Most COT-based signals require 4-8 weeks to fully develop, making this approach better suited for position trading than short-term trading.
Conclusion
CFTC COT data provides unparalleled transparency into professional trader positioning across precious metals futures markets, offering retail investors access to the same institutional intelligence used by major market participants. With current gold commercial shorts at -197,738 contracts and silver positioning showing neutral balance at +22,955 net speculative longs, understanding where to access and interpret this data becomes essential for timing precious metals investments.
The key to successful COT analysis lies in combining positioning data with inventory metrics, seasonal patterns, and fundamental developments rather than relying on weekly changes in isolation. Current market conditions demonstrate this integrated approach perfectly: while gold positioning suggests modest distribution pressure, the 43.5% COMEX coverage ratio creates supply constraints that could amplify any reversal signals.
Master the techniques outlined in this guide to leverage the same data professional traders use for positioning decisions. Track live COMEX inventory alongside COT positioning in the SilverOfTruth app — available on the App Store for comprehensive precious metals market intelligence.
Disclaimer: This article is for informational and educational purposes only and does not constitute financial, investment, or trading advice. Past performance is not indicative of future results. Always conduct your own research and consult with a qualified financial advisor before making investment decisions. SilverOfTruth provides market data and analysis tools — it does not provide personalized financial advice.