
Silver futures positioning has reached a critical inflection point as COMEX inventory warnings collide with shifting trader sentiment across key market participants. The latest CFTC Commitments of Traders data reveals a fascinating divergence between speculative money and commercial hedgers—one that could signal major price movements ahead.
Understanding how different trader classes position themselves during inventory stress provides crucial insight into market mechanics. As covered in our comprehensive COT Reports guide, these weekly snapshots reveal the chess match between smart money commercials and trend-following speculators.
Quick Answer: Current COT silver positioning shows speculators holding a modest net long position of +25,877 contracts (18% of open interest) while commercials maintain heavy shorts at -45,725 contracts. Both groups are reducing positions amid declining open interest, suggesting cautious repositioning as inventory concerns mount.
What Is Driving Current Silver COT Positioning?
The silver futures market is experiencing a rare period of balanced positioning, with speculative net longs representing just 18% of total open interest—a stark contrast to the extreme positioning often seen during major price moves. This positioning comes against a backdrop of declining COMEX inventory and coverage ratios that have triggered multiple delivery warnings.
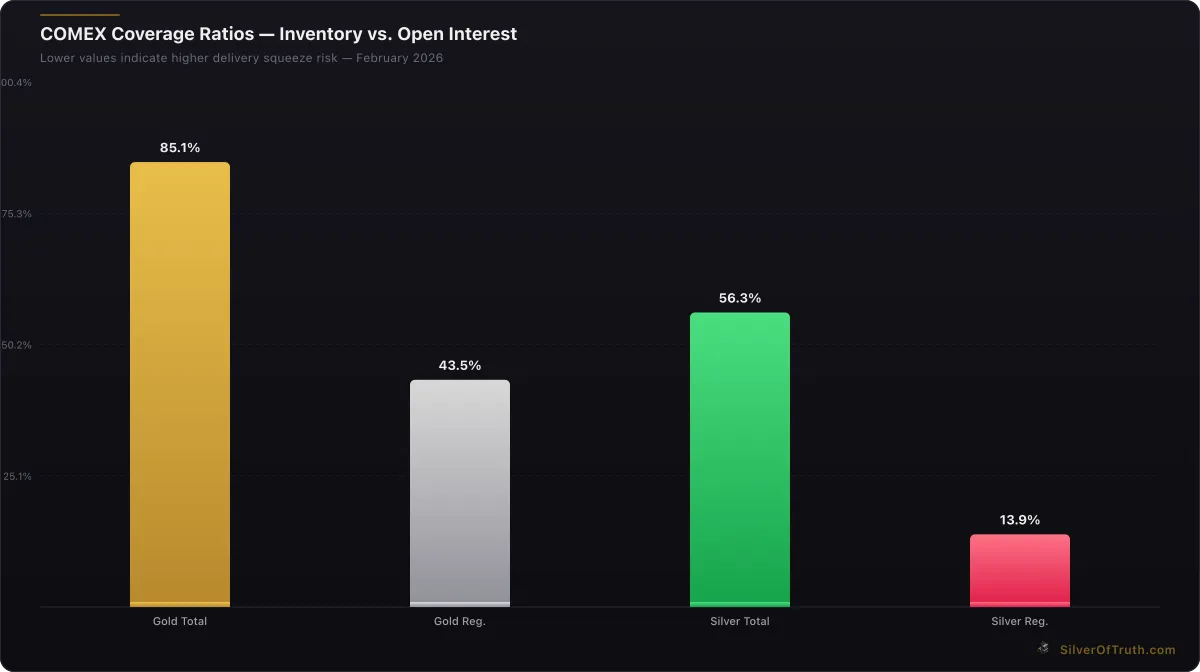
COMEX coverage ratios — lower values indicate higher delivery squeeze risk. Source: SilverOfTruth, February 2026
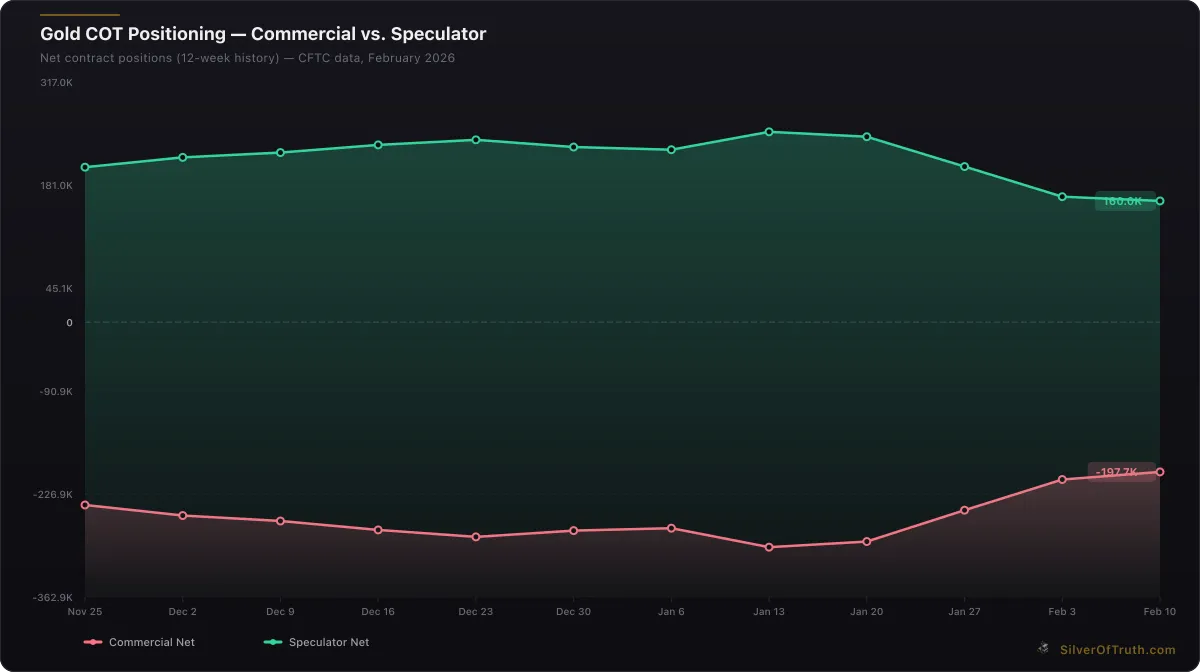
Gold COT positioning: commercial hedgers (red) vs. speculators (green). Source: CFTC via SilverOfTruth, February 2026
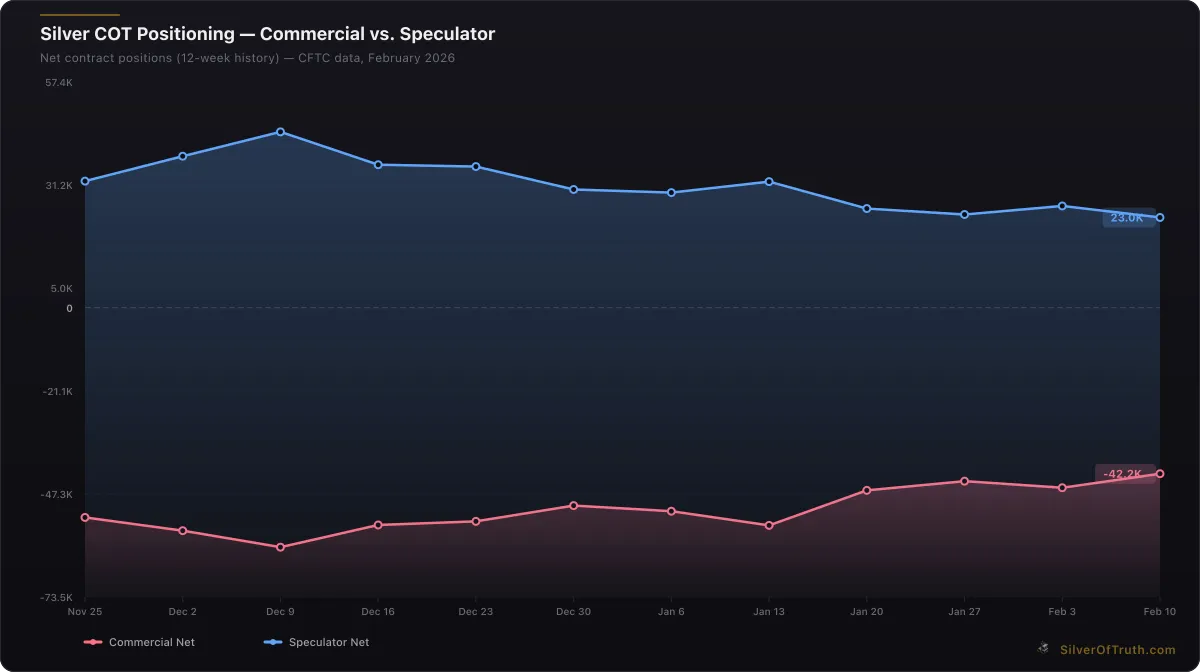
Silver COT positioning: commercial hedgers (red) vs. speculators (blue). Source: CFTC via SilverOfTruth, February 2026
According to the latest CFTC COT report data, non-commercial traders (speculators) hold 38,883 long contracts versus 13,006 short contracts, creating a net long position of 25,877 contracts. Weekly changes show speculators reduced their long exposure by 4,592 contracts while covering 6,766 short contracts—a net improvement of 2,174 contracts despite the overall reduction in bullish bets.
This positioning occurs while COMEX silver registered inventory sits at just 92.9 million ounces, providing only 0.13 coverage ratio against the 143,180 contracts of open interest. The combination of tight physical supply and moderate speculative positioning creates an intriguing setup for potential volatility.
How Are Commercial Hedgers Responding to Inventory Warnings?
Commercial participants—typically miners, refiners, and industrial users—maintain their characteristic short-heavy positioning with 35,248 long contracts versus 80,973 short contracts, creating a net short position of -45,725 contracts. This represents 56.6% of total open interest on the short side, reflecting their natural hedging activities.
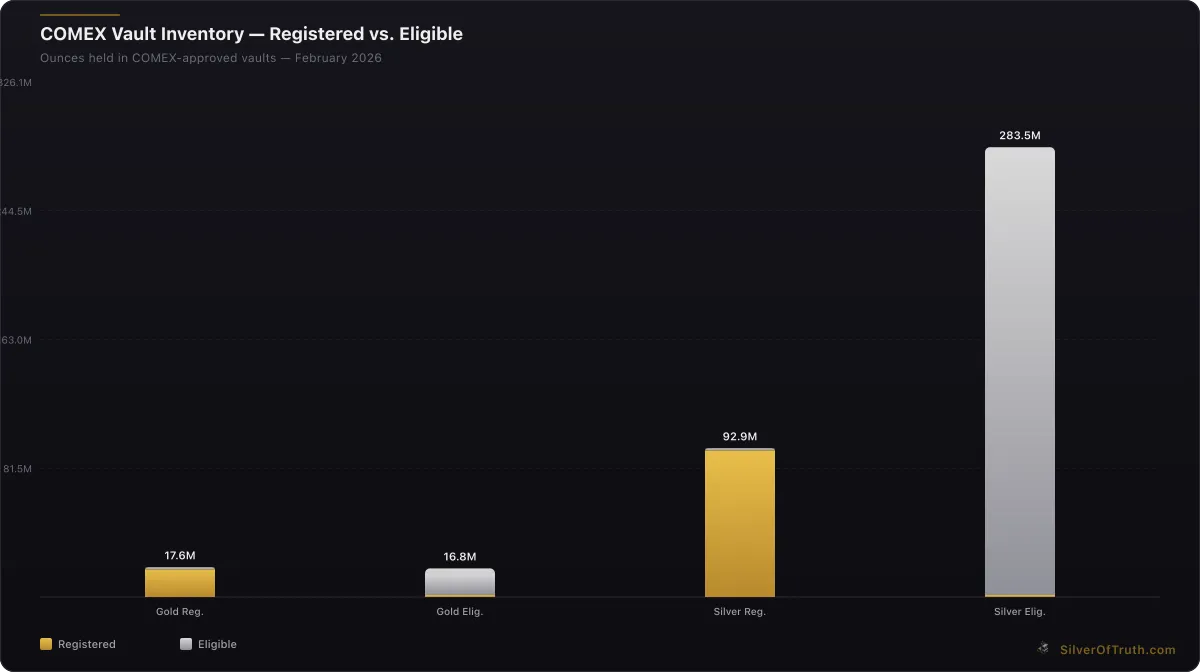
Source: SilverOfTruth COMEX data, February 2026
Weekly changes reveal commercials reduced both long (-9,540 contracts) and short (-7,871 contracts) positions, resulting in a net improvement of -1,669 contracts toward less bearish positioning. However, they remain significantly short, which historically suggests either strong hedging demand from producers or expectations of lower prices ahead.
The CME Group COMEX data shows registered silver inventory has declined 0.74% this week alone, yet commercial shorts remain elevated. This disconnect suggests either commercials are confident in their ability to source physical silver outside COMEX warehouses, or they're betting on demand destruction at current price levels around $77.81 per ounce.
Swap dealers, a subset of commercial participants, hold the largest short position at -27,458 contracts net, having reduced their net short exposure by -4,615 contracts weekly. This suggests some institutional clients may be reducing silver hedges or that dealers are becoming less bearish on near-term price prospects.
Why Is Managed Money Positioning So Conservative?
The managed money category—primarily hedge funds and CTAs—shows surprisingly restrained positioning with just 13,189 long contracts versus 8,206 short contracts for a net long of +4,983 contracts. This represents merely 9.2% of open interest on the long side, well below the extreme levels that typically mark major market tops.
Weekly changes show managed money reduced long positions by 6,234 contracts while covering 3,518 short contracts, improving their net position by -2,716 contracts despite the overall reduction in bullish exposure. This cautious approach contrasts sharply with the aggressive trend-following behavior these participants typically exhibit during strong price moves.
The conservative managed money positioning becomes particularly significant when viewed against current market fundamentals. With silver posting a 2.81% daily gain to $77.81 and inventory warnings mounting, the lack of speculative euphoria suggests either institutional skepticism about sustainability or preparation for a larger move once positioning clears.
Historical analysis reveals managed money positioning often leads price by several weeks. Current restraint, combined with declining open interest (down 13,457 contracts weekly), suggests a market reset that could precede renewed directional conviction.
What Does Open Interest Decline Signal for Silver?
Total open interest has contracted to 143,180 contracts, down 13,457 contracts (8.6%) from the previous week. This decline occurs across all participant categories, suggesting broad-based position liquidation rather than rotation between trader types.
Declining open interest during price strength typically indicates profit-taking from existing longs rather than fresh buying interest. The pattern suggests silver's recent gains may be driven more by short covering and technical momentum than fundamental demand for new long positions.
The contraction becomes more significant when compared to gold futures, where open interest stands at 409,694 contracts. Silver's reduced positioning reflects either less institutional interest in the smaller market or tactical caution ahead of potential inventory-driven volatility.
Track these positioning changes in real-time with our COT Dashboard tool, which provides visual analysis of trader category shifts and historical context for current positioning levels.
How Do Concentration Risks Factor Into Silver Positioning?
Concentration data reveals potential volatility triggers embedded within current positioning. The top 4 short traders control 35.6% of all short positions, while the top 8 control 48.6%—indicating significant concentration among bearish participants.
On the long side, concentration is more distributed with top 4 long traders holding 22.6% of positions and top 8 controlling 33.3%. This asymmetry suggests short covering could create more violent price moves than long liquidation, as fewer players control larger short positions.
The concentration pattern aligns with typical silver market structure, where industrial hedgers and swap dealers maintain large, persistent short positions while speculative longs remain more fragmented. However, current levels suggest any forced covering by major shorts could trigger significant upside price action.
What Historical Patterns Suggest About Current Setup?
Examining COT positioning during previous inventory stress periods reveals important parallels to current conditions. The balanced speculative positioning at 18% of open interest mirrors setups that preceded significant price moves in both directions—the key catalyst being external fundamental developments.
During March 2020's delivery stress, similar balanced positioning preceded explosive upside moves once physical shortage concerns intensified. Conversely, periods of balanced positioning during demand destruction phases led to sustained downtrends as commercials maintained their hedges against weakening industrial consumption.
Current positioning suggests the market is poised for a decisive move but lacks clear directional conviction. The combination of moderate speculative longs, persistent commercial shorts, and declining open interest creates a coiled spring awaiting fundamental catalysts.
Silver's Gold/Silver ratio at 64.98 provides additional context, sitting near historical averages that suggest neither extreme bullishness nor bearishness in precious metals relative positioning. Monitor this key ratio with our Gold/Silver Ratio Calculator.
What Are the Key Catalysts for Positioning Shifts?
Several factors could trigger significant repositioning in silver futures:
Physical Supply Developments: Further COMEX inventory declines or delivery issues could force speculative money to chase price higher while pressuring commercial shorts to cover positions.
Industrial Demand Shifts: Changes in solar panel, electric vehicle, or 5G infrastructure demand could alter commercial hedging patterns as producers adjust output expectations.
Monetary Policy Changes: Federal Reserve policy shifts affecting real interest rates directly impact precious metals positioning as portfolio allocation models adjust for changing opportunity costs.
Geopolitical Events: BRICS nations' continued gold and silver accumulation, as detailed in our analysis of central bank gold buying, could spillover into silver positioning as Eastern demand competes for Western-controlled inventory.
The current setup suggests positioning could shift rapidly once catalyst clarity emerges. Conservative speculative positioning provides room for significant long accumulation, while concentrated commercial shorts create potential for volatile covering rallies.
How Should Investors Interpret Current COT Signals?
The balanced COT positioning in silver presents both opportunities and risks for different investor approaches:
Contrarian investors might view conservative speculative positioning as a contrary indicator suggesting limited downside risk with asymmetric upside potential once positioning normalizes.
Trend followers may prefer waiting for clearer directional conviction as declining open interest suggests institutional uncertainty about near-term direction.
Physical stackers could interpret persistent commercial shorts and inventory warnings as validation of supply tightness themes, though they should monitor whether shorts represent hedging or directional bets.
Current positioning suggests the silver market is in a transition phase, with traditional positioning relationships disrupted by unique supply dynamics. As explored in our Physical Silver Guide, understanding futures positioning helps inform physical purchase timing and premium expectations.
The key insight from current COT data is that silver positioning remains remarkably balanced despite mounting inventory concerns—a situation that historically precedes significant directional moves once catalysts provide clarity.
Frequently Asked Questions
Q: What does balanced COT positioning mean for silver prices? A: Balanced positioning typically indicates market uncertainty and often precedes significant price moves in either direction. Current silver positioning at 18% speculative net long suggests room for movement once directional catalysts emerge.
Q: Why do commercial traders maintain heavy short positions during inventory warnings? A: Commercial shorts often represent hedging by producers, industrial users, and dealers rather than directional bets. Heavy short positions during inventory stress may indicate confidence in alternative supply sources or expectations of demand destruction.
Q: How reliable is COT data for predicting silver price moves? A: COT data is most useful for understanding market structure and positioning extremes rather than precise timing. Extreme positioning often marks turning points, while balanced positioning like current levels suggests markets awaiting catalysts.
Q: What happens if COMEX inventory continues declining with current positioning? A: Continued inventory declines could force commercial short covering and attract speculative buying, potentially creating upward price spirals. However, industrial demand destruction at higher prices could limit gains.
Q: Should individual investors pay attention to COT reports? A: COT reports provide valuable context for market structure and professional positioning, helping individual investors understand institutional sentiment and potential turning points, though they shouldn't be used in isolation for trading decisions.
Sources
- CFTC Commitments of Traders Reports: https://www.cftc.gov/dea/futures/other_lf.htm
- CME Group COMEX Silver Data: https://www.cmegroup.com/markets/metals.html
- World Gold Council Central Bank Data: https://www.gold.org/goldhub/data
- Silver Institute Supply Analysis: https://www.silverinstitute.org
Understanding COT positioning provides crucial insight into silver market dynamics, especially during periods of inventory stress. For comprehensive analysis of these trends and real-time positioning data, explore the SilverOfTruth app—available on the App Store—which consolidates CFTC reports with COMEX inventory data and professional-grade market intelligence. Return to our COT Reports hub for additional educational resources on interpreting futures positioning data.
Disclaimer: This article is for informational and educational purposes only and does not constitute financial, investment, or trading advice. Past performance is not indicative of future results. Always conduct your own research and consult with a qualified financial advisor before making investment decisions. SilverOfTruth provides market data and analysis tools — it does not provide personalized financial advice.