
At exactly 65.53, the gold silver ratio today sits at a critical technical junction that demands attention from precious metals investors. This live ratio, calculated from gold's current price of $5,063.80 and silver's $77.27 per ounce, represents a 0.23% increase from yesterday's close—a modest uptick that masks deeper structural shifts brewing beneath the surface.
The current gold silver ratio today signals a market in transition, where both metals gained ground (+2.33% gold, +2.10% silver) yet maintained their historical pricing relationship within established parameters. Understanding what this 65.53 reading means requires examining multiple data layers: COMEX inventory dynamics, COT positioning shifts, and broader precious metals market sentiment that collectively shape this fundamental ratio.
This comprehensive analysis dissects the current gold silver ratio, its immediate market implications, and strategic considerations for both physical stackers and active traders navigating today's precious metals landscape.
Understanding the Gold Silver Ratio Today
The gold silver ratio represents the number of silver ounces needed to purchase one ounce of gold, calculated by dividing gold's spot price by silver's current price. At 65.53, today's ratio means it takes approximately 65.53 ounces of silver to equal the value of one ounce of gold.
This ratio serves as a relative value indicator between the two primary precious metals, helping investors identify potential opportunities when historical norms suggest one metal appears undervalued relative to the other. The current gold silver ratio of 65.53 sits above the 20-year average of approximately 68, placing it within normal trading ranges but closer to levels where silver traditionally shows relative strength.
Market dynamics driving today's ratio include synchronized price gains across both metals, with gold advancing $115.40 (+2.33%) while silver climbed $1.59 (+2.10%). This parallel movement preserved the ratio's stability, indicating both metals responded similarly to underlying market forces rather than diverging based on individual supply-demand factors.
The live nature of this ratio means constant fluctuation throughout trading sessions. Today's 65.53 reading represents a specific moment in time, with intraday movements typically ranging 1-3% around the daily average as spot prices adjust to news, technical levels, and trading flows across global markets.
Current Market Context and Price Action
Both gold and silver demonstrated strong performance in today's trading session, with precious metals investors tracking supply dynamics as supportive factors. Gold reached a 24-hour high of $5,069.10 before settling at current levels, while silver peaked at $79.27 amid robust industrial and investment demand signals.
The synchronized gains suggest broad-based precious metals strength rather than isolated moves in individual markets. According to World Gold Council data, central bank purchases continue supporting gold demand, while Silver Institute research indicates persistent industrial demand underpins silver's price floor.
COMEX inventory data reveals contrasting supply pictures between the metals. Gold's registered inventory stands at 17.58 million ounces with a 43.5% coverage ratio against open interest—classified as MEDIUM risk. Silver's registered inventory of 92.9 million ounces provides only 13.9% coverage, earning a HIGH risk classification that could support relative silver strength if delivery demands materialize.
Market volatility expanded today with gold's high-low range reaching $162 ($5,069.10 - $4,907.10) while silver's spread hit $5.52 ($79.27 - $73.75). These wider ranges indicate increased institutional participation and potentially renewed interest from systematic trading strategies targeting ratio relationships.
Historical Context of 65.53 Ratio Level
The current gold silver ratio today at 65.53 sits within historical norms established over the past two decades. During 2008's financial crisis, the ratio spiked above 80 as gold outperformed silver during initial flight-to-safety moves, before silver's subsequent catch-up compressed the ratio below 40 by 2011.
Over the past five years, the ratio has traded primarily between 60-85, with 65.53 representing the middle portion of this range. This positioning suggests neither metal appears extremely over or undervalued relative to the other based purely on historical precedent, though ratio analysis reveals subtle opportunities for positioned investors.
The ratio's stability around current levels reflects maturation in precious metals markets, where industrial silver demand growth offsets some of gold's monetary premium advantages. Mining sector dynamics also influence long-term ratio trends, as silver's byproduct nature (often mined alongside other metals) creates different supply elasticity compared to primary gold mines.
Seasonal patterns typically show ratio strength (gold outperformance) during Q4 jewelry demand and Q1 central bank accumulation periods, followed by potential silver catch-up during Q2-Q3 industrial demand seasons. Today's February reading aligns with historical tendencies for modest ratio elevation during this calendar period.
COMEX Data Impact on Ratio Dynamics
COMEX inventory and open interest data provide crucial context for understanding potential ratio movements ahead. Gold's coverage ratio at 43.5% indicates adequate but not abundant deliverable supply, while silver's 13.9% registered coverage suggests much tighter physical availability relative to paper positioning.
The stark difference in coverage ratios—43.5% for gold versus 13.9% for silver—creates asymmetric delivery risk that could favor silver if physical demand accelerates. COMEX inventory tracking shows silver's registered stocks have declined more aggressively than gold's in recent months, supporting potential supply-side pressure on the ratio.
Open interest analysis reveals 404,391 gold contracts outstanding versus 133,641 silver contracts. Converting to ounces (100-oz gold contracts, 5,000-oz silver contracts), gold open interest represents 40.4 million ounces while silver totals 668.2 million ounces—significantly higher relative to available registered inventory.
COT positioning data from the CFTC reports shows managed money maintaining net long positions in both metals, with gold specs holding 92,022 contracts net long and silver specs at 4,569 contracts net long. The much smaller relative silver positioning suggests room for additional speculative interest if momentum builds.
These inventory and positioning dynamics create potential catalysts for ratio movement if physical delivery demands increase or if speculative money shifts allocations between the metals based on relative value perceptions.
COT Positioning and Speculator Sentiment
Latest Commitment of Traders data reveals divergent sentiment patterns between gold and silver that could influence ratio direction. Gold shows a BEARISH COT sentiment as speculative net longs remain elevated at 160,012 contracts (39.6% of open interest), with recent position reduction suggesting distribution from crowded levels.
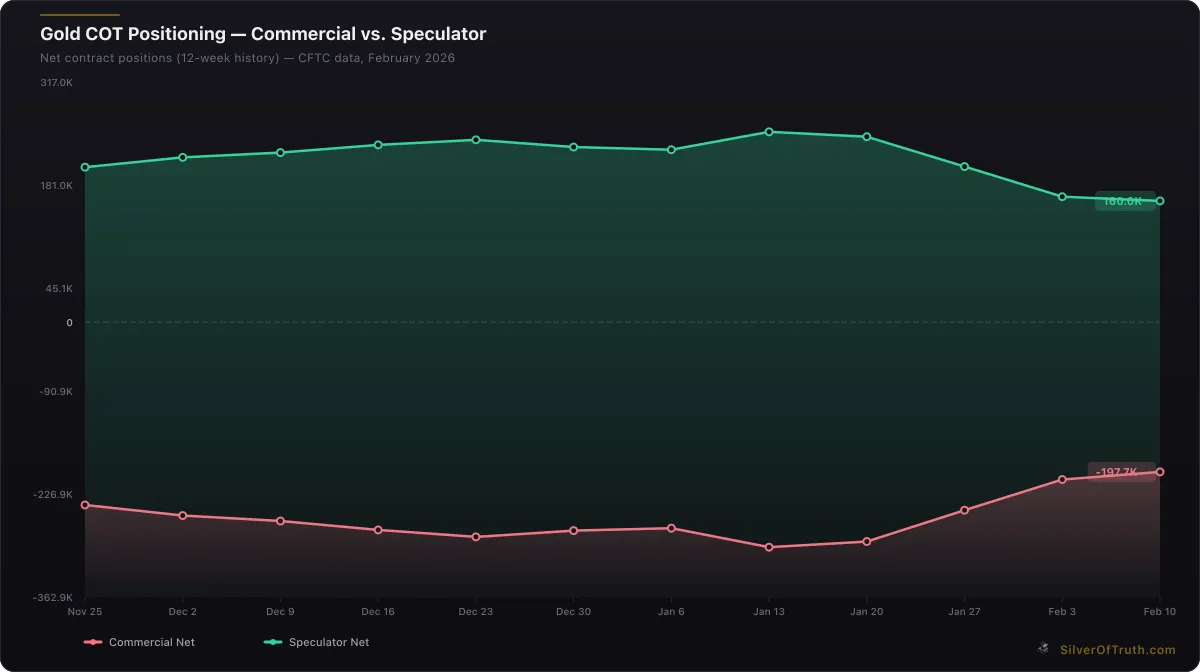
Gold COT positioning: commercial hedgers (red) vs. speculators (green). Source: CFTC via SilverOfTruth, February 2026
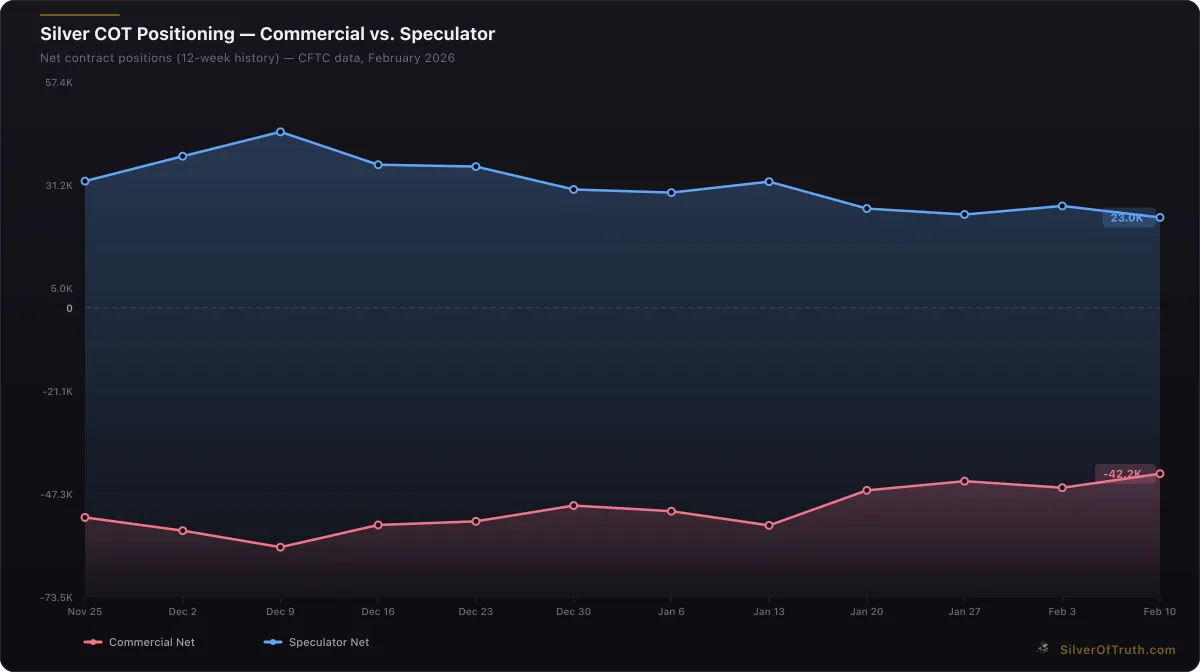
Silver COT positioning: commercial hedgers (red) vs. speculators (blue). Source: CFTC via SilverOfTruth, February 2026
Silver's COT sentiment reads NEUTRAL with speculative net longs at just 22,955 contracts (17.2% of open interest)—significantly less crowded than gold's positioning. This disparity indicates silver may have more room for speculative accumulation if broader precious metals momentum continues, potentially supporting ratio compression.
Commercial hedgers maintain substantial net short positions in both markets: -197,738 contracts in gold versus -42,163 contracts in silver. The larger relative gold short position suggests commercial concerns about elevated price levels, while smaller silver shorts indicate less commercial resistance to upward price movement.
Understanding COT reports reveals that current positioning favors potential silver outperformance if precious metals continue advancing. Gold's crowded long positioning creates vulnerability to profit-taking, while silver's cleaner technical picture provides room for fresh speculative interest.
Concentration data shows top 4 traders control 33.8% of gold shorts versus 33.7% of silver shorts, indicating similar institutional concentration. However, the absolute size differences mean gold faces more potential volatility from large trader position changes given the bigger contract values involved.
Industrial Demand Factors Affecting Silver
Silver's dual role as both precious and industrial metal creates unique supply-demand dynamics that influence the gold silver ratio. Industrial silver demand continues expanding across technology sectors, with electric vehicles, solar panels, and 5G infrastructure driving structural consumption growth.
The industrial component distinguishes silver from gold's primarily monetary function, creating different price elasticity during economic cycles. During growth periods, industrial demand supports silver's relative performance, potentially compressing the ratio. During contractions, silver's industrial exposure can create underperformance that widens the ratio.
Current economic indicators suggest mixed signals for industrial metals demand. Supply chain resilience improvements support steady industrial silver consumption, while potential interest rate pressures create headwinds for growth-sensitive sectors that consume significant silver quantities.
Silver's role in renewable energy particularly influences long-term ratio dynamics as solar installations continue expanding globally. Each solar panel requires approximately 0.75 ounces of silver, translating to meaningful incremental demand as renewable energy adoption accelerates worldwide.
Electric vehicle penetration also drives structural silver demand through electronics, charging infrastructure, and battery management systems. Silver in electric vehicles represents a growing consumption category that supports long-term demand forecasts independent of precious metals investment flows.
Trading Implications at Current Levels
The gold silver ratio today at 65.53 presents specific trading considerations for different investor strategies. Mean reversion traders might consider this level relatively neutral, lacking extreme readings that typically trigger contrarian positioning. Trend followers await clear directional breaks above 70 or below 60 to establish positions.
Pair trading strategies can exploit ratio movements through simultaneous long/short positions in the metals. At 65.53, the ratio offers modest opportunities for those expecting silver outperformance (selling the ratio) or gold strength (buying the ratio), though position sizing should reflect the neutral technical setup.
Physical stackers might use current levels for rebalancing portfolio allocations between gold and silver holdings. Those overweighted in gold relative to silver could consider modest reallocation, while silver-heavy portfolios might maintain current positions given reasonable ratio levels.
Options strategies around the ratio include selling volatility through straddles or strangles if expecting continued range-bound behavior, or buying directional exposure through calls/puts on individual metals based on ratio breakout expectations.
Risk management becomes crucial at current levels given the technical neutrality. Stop-losses for ratio trades should reflect historical volatility patterns, typically 5-8% from entry levels to avoid premature exits from normal ratio fluctuations while protecting against adverse moves.
Central Bank Activity and Monetary Policy Impact
Central bank gold purchases continue influencing the gold silver ratio through direct demand for monetary gold reserves. According to the World Gold Council, central banks added 483 tons of gold in Q3 2025, maintaining multi-decade purchasing trends that support gold's monetary premium over silver.
Federal Reserve monetary policy affects both metals but through different transmission mechanisms. Higher real interest rates typically pressure both metals, though gold's monetary properties often provide better relative performance during early tightening cycles. Silver's industrial exposure makes it more sensitive to growth expectations embedded in Fed policy changes.
Current market pricing reflects expectations for continued Fed policy normalization, with precious metals prices incorporating roughly 2-3 additional rate increases over the coming year. This backdrop generally supports modest ratio elevation as gold's store-of-value characteristics outweigh silver's cyclical growth exposure.
International central bank diversification away from dollar reserves continues supporting structural gold demand. Recent purchases by emerging market central banks, particularly in Asia and Eastern Europe, create sustained buying pressure that benefits gold more directly than silver given central bank portfolio mandates.
The interplay between monetary policy, currency movements, and precious metals creates complex ratio dynamics. Dollar strength typically pressures both metals but often affects silver more severely given its smaller market size and higher industrial correlation with global growth trends.
Technical Analysis and Chart Patterns
From a technical perspective, the gold silver ratio at 65.53 trades within established support and resistance levels. Key resistance appears around 68-70, representing the upper end of recent trading ranges and levels where ratio selling typically emerges from silver advocates and industrial buyers.
Support levels cluster around 62-64, where gold profit-taking and silver accumulation often converge. The current reading near the middle of this range suggests consolidation rather than directional conviction from technical trading perspectives.
Moving average analysis shows the ratio trading slightly above its 50-day average but below 200-day levels, indicating mixed intermediate-term momentum. RSI readings remain neutral around 45-55, lacking the extreme levels (>70 or <30) that often precede significant ratio movements.
Volume analysis reveals average participation levels in both gold and silver markets today, with no unusual institutional flows suggesting impending ratio breakouts. Options positioning shows balanced put/call ratios, indicating absent consensus directional bias among sophisticated traders.
Chart pattern recognition identifies potential triangle formation in the ratio over recent months, with converging trendlines suggesting eventual breakout direction. Resolution above 68 could target 72-75 levels, while breaks below 62 might reach 58-60 support zones.
Global Market Influences on Precious Metals
International precious metals markets significantly influence the gold silver ratio through arbitrage flows and regional supply-demand imbalances. Asian markets, particularly China and India, drive substantial physical demand that affects both metals differently based on cultural preferences and economic conditions.
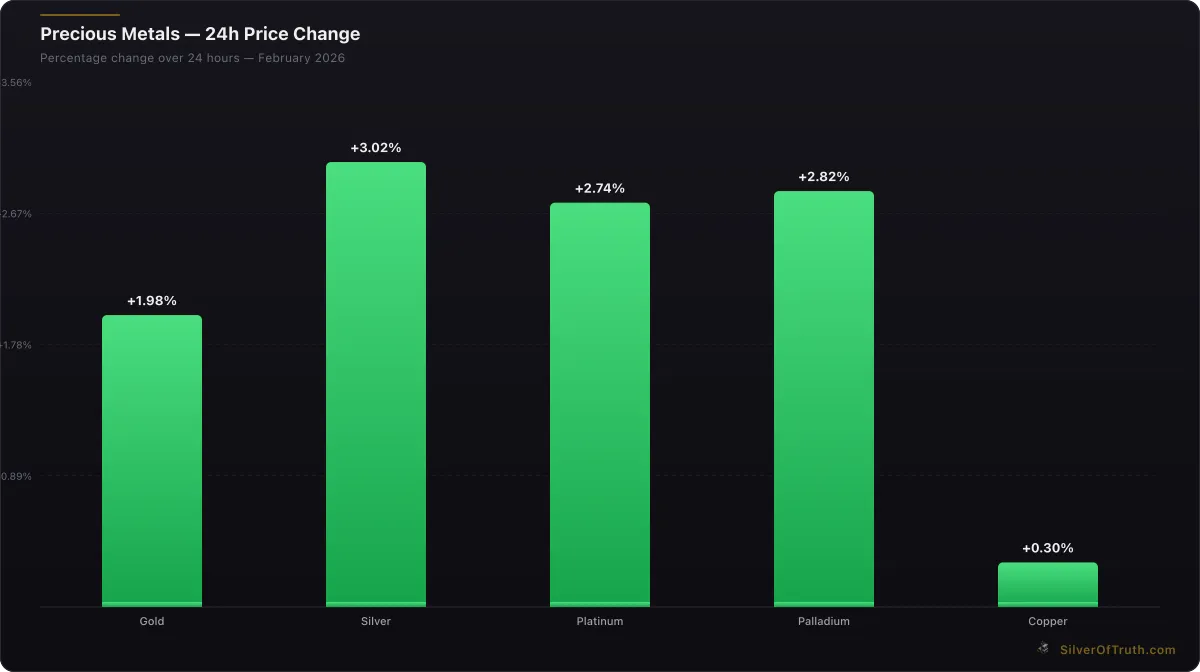
24-hour precious metals price changes. Source: SilverOfTruth, February 2026
Shanghai Gold Exchange premiums over London spot prices indicate Chinese physical demand strength, while Indian jewelry demand patterns show seasonal preferences that impact both metals. Current premiums suggest steady but not exceptional Eastern demand, supporting stable ratio conditions.
European precious metals markets contribute through institutional ETF flows and mining company hedging activities. Recent ETF data shows modest inflows to both gold and silver funds, maintaining balanced investment demand that supports current ratio stability.
Geopolitical tensions continue providing safe-haven demand for precious metals, though current levels reflect relatively calm international conditions. Any escalation in global conflicts typically benefits gold more than silver initially, creating ratio widening pressure before eventual mean reversion.
Currency movements, particularly USD strength or weakness, affect both metals but with varying sensitivity. Silver's smaller market cap makes it more volatile to currency-driven flows, creating ratio fluctuations during periods of significant dollar movement that may not reflect fundamental supply-demand changes.
Supply Chain Dynamics and Mining Sector Impact
Mining sector fundamentals provide important context for long-term ratio stability. Gold production costs have risen significantly due to inflation pressures, energy costs, and declining ore grades, supporting higher gold prices. Silver production, often a byproduct of other metals mining, faces different cost structures that may not support prices equally.
Silver mine supply continues declining from mature deposits, while new discovery rates remain below replacement levels. This structural supply deficit supports silver's long-term value proposition relative to gold, though timing of price impacts remains uncertain.
All-in sustaining costs (AISC) for primary silver mines average $18-22 per ounce, providing strong support at current $77 prices. Gold's AISC around $1,200-1,400 per ounce offers similar proportional support at $5,063 prices, maintaining relative cost-based support for both metals.
Mining company hedging activities influence near-term supply availability. Current hedging levels remain modest in both gold and silver sectors, indicating producers aren't aggressively selling forward production at current price levels, potentially supporting continued price strength.
Exploration spending allocation between gold and silver projects affects long-term supply pipelines. Recent industry data shows continued preference for gold-focused exploration, potentially creating future supply shortages in silver that could compress the ratio over multi-year horizons.
Investment Portfolio Considerations
Portfolio allocation decisions using the gold silver ratio require understanding individual investment objectives and risk tolerance levels. At 65.53, the ratio provides reasonable entry points for either metal based on different investment thesis approaches.
Conservative investors might maintain traditional 80-20 gold-silver allocations, using current ratio levels for periodic rebalancing rather than tactical trading. This approach captures long-term precious metals appreciation while minimizing ratio timing risks.
Aggressive investors could consider overweighting silver at current ratio levels, expecting eventual compression toward historical averages below 60. This strategy requires accepting higher volatility in exchange for potential outperformance during silver strength cycles.
Tax implications affect precious metals allocation strategies, with physical holdings versus ETFs or mining stocks creating different treatment under current regulations. Understanding these differences becomes crucial for optimizing after-tax returns from precious metals investments.
Modern portfolio theory suggests precious metals allocations of 5-10% of total assets, with the gold-silver split depending on individual risk preferences and market outlook. Current ratio levels support either metal choice based on different fundamental expectations for monetary versus industrial demand growth.
Frequently Asked Questions
What does a gold silver ratio of 65.53 mean for investors?
A gold silver ratio of 65.53 means it takes 65.53 ounces of silver to equal one ounce of gold in value. This level sits within normal historical ranges, suggesting neither metal appears extremely over or undervalued relative to the other. Investors can use this information for portfolio rebalancing or tactical trading decisions.
Is 65.53 a good level to buy silver or gold?
The 65.53 ratio represents a relatively neutral level historically. Silver advocates might consider this reasonable for accumulation given ratios have traded below 50 in previous precious metals bull markets. Gold supporters might prefer waiting for higher ratios above 70-75 for better relative value entry points.
How often does the gold silver ratio change?
The gold silver ratio changes continuously during trading hours as spot prices for both metals fluctuate. Intraday movements typically range 1-3% around daily averages, with more significant changes occurring during major market events or when one metal faces specific supply-demand pressures.
What historical levels should investors watch in the gold silver ratio?
Key historical levels include ratios below 50 (extreme silver strength), above 80 (extreme gold strength), and the 65-70 range representing long-term averages. Ratios below 40 or above 100 have occurred rarely and typically marked major market turning points.
How do COMEX inventories affect the gold silver ratio?
COMEX inventories influence the ratio through delivery risk and physical supply availability. Currently, silver's 13.9% registered coverage ratio versus gold's 43.5% suggests tighter silver physical supplies, which could support ratio compression if delivery demands increase or physical investment accelerates.
Conclusion
The gold silver ratio today at 65.53 reflects a precious metals market in technical balance, with both metals advancing in tandem while maintaining established relative valuations. Current levels offer reasonable entry points for either metal based on individual investment strategies, though ratio traders might prefer waiting for more extreme readings above 70 or below 60.
Key factors supporting near-term ratio stability include balanced COT positioning, adequate COMEX inventories in gold contrasted with tighter silver supplies, and synchronized precious metals strength amid broader market uncertainty. Industrial silver demand growth provides long-term compression potential, while gold's monetary premium maintains ratio support during economic stress periods.
Strategic investors can use current levels for portfolio rebalancing, while tactical traders should monitor technical breaks above 68 or below 62 for directional confirmation. The combination of neutral positioning, moderate volatility, and structural supply-demand factors suggests continued range-bound ratio behavior around current levels.
Track live gold silver ratio movements and comprehensive precious metals data with the SilverOfTruth app, available on the App Store. Get real-time ratio alerts, COMEX inventory updates, and professional-grade market analysis tools designed for serious precious metals investors.
Disclaimer: This article is for informational and educational purposes only and does not constitute financial, investment, or trading advice. Past performance is not indicative of future results. Always conduct your own research and consult with a qualified financial advisor before making investment decisions. SilverOfTruth provides market data and analysis tools — it does not provide personalized financial advice.