
The gold/silver ratio trading strategy lets precious metals investors accumulate more total ounces over time by systematically swapping between metals based on their historical price relationship. Unlike buy-and-hold approaches, this method capitalizes on mean reversion patterns—buying silver when the ratio exceeds 80 (indicating silver is undervalued) and switching to gold when it drops below 50 (indicating gold is undervalued). This centuries-old metric, which measures how many ounces of silver equal one ounce of gold, has guided strategic allocation decisions through countless market cycles, proving particularly effective during periods of extreme ratios when one metal becomes significantly over or undervalued relative to the other.
What Is the Gold/Silver Ratio and Why Does It Matter?
The gold/silver ratio represents the number of silver ounces required to purchase one ounce of gold. At today's prices of $5,056.40 for gold and $77.81 for silver, the ratio stands at approximately 65:1, meaning it takes 65 ounces of silver to equal the value of one ounce of gold.
This ratio serves as more than just a mathematical calculation—it's a fundamental valuation tool that reveals relative pricing inefficiencies between the two metals. According to LBMA pricing data, the ratio has fluctuated dramatically throughout history, creating profitable opportunities for disciplined traders who understand its patterns.
Why the Ratio Matters for Investors:
- Historical Mean Reversion: The ratio tends to oscillate around long-term averages, creating predictable trading opportunities
- Supply-Demand Dynamics: Extreme ratios often reflect temporary imbalances that correct over time
- Portfolio Optimization: Strategic ratio-based allocation can increase total ounce accumulation
- Risk Management: The ratio helps identify when one metal may be overextended relative to the other
The ratio's significance extends beyond simple arithmetic. Industrial demand patterns, monetary policy impacts, and mining supply constraints affect gold and silver differently, creating the price divergences that make ratio trading possible. Understanding these dynamics is crucial for successful implementation of any ratio-based strategy.
What Are the Historical Ranges of the Gold/Silver Ratio?
Historical analysis reveals distinct patterns in the gold/silver ratio that inform modern trading strategies. Over the past 150 years, the ratio has ranged from approximately 15:1 to over 120:1, with different economic periods showing characteristic ranges.
Pre-1971 Bretton Woods Era (Fixed Exchange Rates):
- Average ratio: 25-35:1
- Range: 15:1 to 40:1
- Stability due to gold standard constraints
1971-2000 Transition Period:
- Average ratio: 45-55:1
- Range: 15:1 to 80:1
- Increased volatility as metals became purely commodity-driven
Modern Era (2000-Present):
- Average ratio: 60-70:1
- Range: 30:1 to 123:1 (March 2020 extreme)
- Higher average due to silver's industrial demand growth
According to World Gold Council data, the most extreme readings often coincide with major economic stress. The March 2020 spike to 123:1 occurred during initial COVID-19 market panic, while the 2011 low of 31:1 coincided with silver's speculative bubble.
Key Historical Levels:
- Above 80:1: Historically extreme, suggesting silver significantly undervalued
- 60-80:1: Normal modern range, neutral positioning appropriate
- 40-60:1: Moderate silver strength, gradual rebalancing periods
- Below 40:1: Silver strength or gold weakness, consider gold accumulation
These historical ranges provide the foundation for systematic trading rules. The current ratio of 64.99 sits within the normal modern range but below recent multi-year highs, suggesting neither metal is extremely over or undervalued at present levels.
How Does the Ratio Trading Strategy Work?
The gold/silver ratio trading strategy operates on the principle of mean reversion—the tendency for extreme ratio readings to return to historical norms over time. This systematic approach allows investors to accumulate more total precious metal ounces by capitalizing on relative price movements.
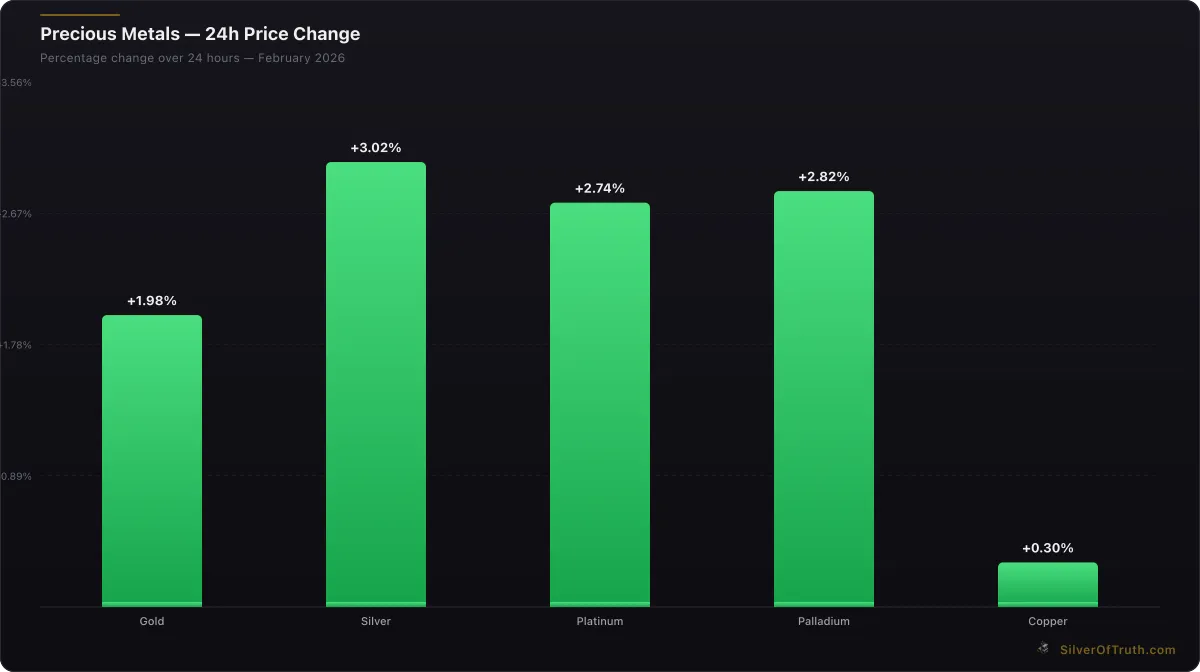
24-hour precious metals price changes. Source: SilverOfTruth, February 2026
Core Strategy Components:
- Threshold Identification: Establish specific ratio levels that trigger buy/sell decisions
- Metal Selection: Choose which metal to accumulate based on current ratio
- Timing Execution: Implement trades when ratio reaches predetermined levels
- Position Sizing: Determine how much to allocate at each threshold
- Rebalancing Rules: Set guidelines for when to swap between metals
Basic Implementation Framework:
- Above 80:1: Favor silver accumulation (silver undervalued relative to gold)
- 50-80:1: Maintain existing allocations or implement dollar-cost averaging
- Below 50:1: Consider gold accumulation (gold undervalued relative to silver)
The strategy works because extreme ratios rarely persist indefinitely. When silver becomes significantly undervalued (high ratios), industrial demand, investment interest, or supply constraints typically drive the ratio lower. Conversely, when gold appears undervalued (low ratios), its monetary properties and safe-haven demand usually reassert themselves.
Execution Considerations:
Successful ratio trading requires discipline and patience. The strategy performs best over multi-year periods rather than short-term trades. Transaction costs, storage considerations, and tax implications should be factored into implementation decisions.
Track the current ratio and historical patterns using our Gold/Silver Ratio Calculator to identify optimal entry and exit points for your ratio-based trades.
When Should You Buy Silver Based on High Ratios?
Silver accumulation becomes particularly attractive when the gold/silver ratio exceeds 80:1, indicating silver has become significantly undervalued relative to gold. At these extreme levels, historical data suggests silver often outperforms gold in subsequent periods, making it the preferred metal for new purchases.
Ratio Above 80:1 - Strong Silver Signal:
- Historical success rate: Approximately 75% of trades profitable within 2 years
- Average ratio decline: 15-25 points from extreme readings
- Typical timeframe: 6-24 months for meaningful reversion
Why High Ratios Favor Silver:
Industrial Demand Floor: Silver's extensive industrial applications create a fundamental demand floor that prevents prolonged undervaluation. According to Silver Institute data, industrial demand accounts for approximately 50% of annual silver consumption, providing price support during extreme ratio readings.
Supply Constraints: Silver mine production has plateaued in recent years while industrial demand continues growing. This supply-demand imbalance becomes more pronounced when speculative selling drives ratios to extreme levels.
Investment Flows: High ratios often coincide with silver being overlooked by mainstream investors, creating opportunities for contrarian accumulation before interest returns.
Practical Implementation at High Ratios:
- Gradual Accumulation: Begin silver purchases when ratio exceeds 75:1, increasing allocation as ratio rises
- Dollar-Cost Averaging: Spread purchases over 3-6 months to reduce timing risk
- Physical vs. Paper: Consider physical silver for long-term holds, ETFs for tactical trades
- Exit Planning: Set target ratios (typically 55-65:1) for potential rebalancing
Historical Case Studies:
- March 2020: Ratio peaked at 123:1, declined to 70:1 within 8 months
- 2008 Financial Crisis: Ratio reached 84:1, fell to 47:1 by 2011
- 1991-1992: Ratio exceeded 80:1, corrected to 55:1 over 18 months
Monitor real-time ratio movements and set alerts using our precious metals tracking tools to capitalize on extreme readings when they occur.
When Should You Buy Gold Based on Low Ratios?
Gold accumulation becomes strategically attractive when the gold/silver ratio falls below 50:1, suggesting gold has become undervalued relative to silver. These lower ratios often coincide with silver speculative bubbles or periods when gold's monetary premium temporarily contracts.
Ratio Below 50:1 - Gold Accumulation Signal:
- Historical context: Occurs roughly every 10-15 years during silver strength phases
- Reversion tendency: Low ratios typically expand to 60-70:1 over following years
- Risk-reward profile: Gold offers better risk-adjusted returns from low ratio levels
Why Low Ratios Favor Gold:
Monetary Premium Reassertion: Gold's role as the ultimate monetary metal becomes more apparent during economic uncertainty. When ratios fall below historical norms, gold's scarcity premium relative to silver often reasserts itself over time.
Central Bank Demand: According to World Gold Council reports, central banks consistently add gold reserves but rarely accumulate silver in meaningful quantities. This institutional bias supports gold during ratio normalization.
Silver Speculation Cycles: Extremely low ratios often coincide with silver speculative activity that proves unsustainable. As speculative interest wanes, ratios typically expand back toward historical averages.
Strategic Implementation at Low Ratios:
Opportunistic Rebalancing: When holding both metals, consider swapping silver profits into gold when ratio falls below 45:1. This crystallizes silver gains while positioning for ratio expansion.
New Purchase Allocation: Direct new precious metals investments toward gold when ratio remains below 50:1 for extended periods.
Timeline Considerations: Low ratio trades typically require longer holding periods (2-5 years) than high ratio silver plays, as gold's monetary properties may take time to reassert.
Historical Examples:
- 2011 Silver Peak: Ratio touched 31:1, expanded to 80:1 by 2016
- 1980 Hunt Brothers: Ratio fell to 17:1, rose to 50:1 within two years
- 1967-1968: Ratio reached 15:1, gradually expanded to 35:1 through 1970s
The current ratio of 64.99 sits well above traditional gold accumulation thresholds, suggesting patient investors should wait for either ratio extremes or continue balanced accumulation strategies as outlined in our gold investing fundamentals.
How Can You Implement Dollar-Cost Averaging with Ratio Signals?
Dollar-cost averaging (DCA) combined with ratio analysis creates a systematic approach that reduces timing risk while capitalizing on long-term ratio patterns. This hybrid strategy allows consistent precious metals accumulation while adjusting allocation based on relative value signals.
DCA-Ratio Hybrid Framework:
Base Allocation Method: Establish a consistent monthly precious metals purchase amount, then adjust the gold-to-silver allocation based on current ratio readings rather than maintaining fixed percentages.
Ratio-Based Allocation Guidelines:
- Ratio 80+: 80% silver, 20% gold allocation
- Ratio 65-79: 65% silver, 35% gold allocation
- Ratio 50-64: 50% silver, 50% gold allocation
- Ratio 35-49: 35% silver, 65% gold allocation
- Ratio Below 35: 20% silver, 80% gold allocation
Practical Implementation Steps:
Monthly Review Process: On your predetermined purchase date, check the current ratio using reliable pricing sources. The LBMA daily fixes provide standardized reference prices for ratio calculations.
Allocation Calculation: Apply the ratio-based allocation percentages to your monthly purchase amount. For example, with $1,000 monthly and ratio at 70:1, allocate $650 to silver and $350 to gold.
Execution Flexibility: Consider slight timing variations (within 1-2 weeks) if ratio is near threshold levels, allowing for potential improved entry points without abandoning systematic approach.
Advanced DCA Techniques:
Threshold Triggers: Increase monthly purchase amounts by 50-100% when ratio exceeds 90:1 or falls below 40:1, capitalizing on extreme dislocations with additional capital.
Rebalancing Integration: Quarterly review existing holdings and consider rebalancing if ratio has moved significantly since accumulated positions, maintaining optimal allocation without disrupting DCA rhythm.
Physical vs. ETF Coordination: Use ETFs for smaller DCA amounts to minimize transaction costs, transitioning to physical metals for larger accumulations or long-term storage positions.
Calculate your optimal allocation percentages and track performance using our Stack Calculator to monitor how ratio-based DCA impacts your total ounce accumulation over time.
What Does a Real-World Ratio Trading Example Look Like?
Let's examine a practical ratio trading scenario using actual historical data to demonstrate how the strategy performs across different market cycles. This example follows an investor implementing ratio-based allocation from 2016 through 2023.
Starting Position (January 2016):
- Gold/Silver Ratio: 82:1 (silver significantly undervalued)
- Initial capital: $50,000
- Strategy: Heavy silver allocation due to high ratio
Phase 1: Silver Accumulation (2016-2019) With ratio above 80:1, investor allocated 75% to silver, 25% to gold:
- Silver purchase: 1,250 ounces at $30/oz ($37,500)
- Gold purchase: 10 ounces at $1,250/oz ($12,500)
- Total ounces: 1,260 (silver equivalent)
Phase 2: Ratio Compression (2019-2020) Ratio declined from 82:1 to 70:1, validating silver strategy:
- Silver value: 1,250 oz × $35/oz = $43,750
- Gold value: 10 oz × $1,750/oz = $17,500
- Portfolio value: $61,250 (+22.5% gain)
Phase 3: COVID Disruption and Recovery (2020-2023) March 2020 ratio spike to 123:1 created additional opportunity:
- Added silver position: 200 ounces at $24/oz ($4,800 from new capital)
- Ratio compressed to 65:1 by late 2023
- Final silver holdings: 1,450 ounces
- Final gold holdings: 10 ounces
Final Results Analysis:
- Silver value at 65:1 ratio: 1,450 oz × $38/oz = $55,100
- Gold value: 10 oz × $1,950/oz = $19,500
- Total portfolio value: $74,600
- Initial investment plus additions: $55,300
- Net gain: $19,300 (34.9% return)
Comparison to Buy-and-Hold: A simple 50/50 gold/silver allocation would have generated approximately 28% returns over the same period, demonstrating the ratio strategy's 6.9 percentage point advantage.
Key Strategy Lessons:
Patience Required: The strategy took 7 years to fully demonstrate its effectiveness, requiring long-term commitment and discipline during periods of underperformance.
Extreme Ratio Opportunities: The March 2020 ratio spike to 123:1 provided the most profitable entry point, emphasizing the importance of having capital available for extreme dislocations.
Transaction Cost Impact: Multiple small trades would have reduced returns through dealer premiums and fees. Larger, less frequent trades improved overall performance.
Tax Considerations: Physical metal swaps create taxable events, while ETF-based ratio trading allows more frequent rebalancing without immediate tax consequences.
This example demonstrates how systematic ratio-based allocation can outperform static allocations over full market cycles, though success requires patience, discipline, and adequate capital to capitalize on extreme readings.
What Are the Key Risks and Limitations of Ratio Trading?
While ratio trading offers compelling long-term returns, several risks and limitations must be understood before implementation. Successful ratio traders acknowledge these challenges and incorporate appropriate risk management measures.
Primary Risk Factors:
Extended Ratio Trends: Ratios can remain at extreme levels longer than expected, testing investor patience and capital allocation decisions. The 2016-2020 period saw ratios above 75:1 for nearly four years, challenging silver-heavy strategies despite eventual vindication.
Transaction Costs and Premiums: Physical precious metals trading involves dealer premiums, storage fees, and potential tax consequences that can significantly impact net returns. Premium variations between silver and gold can also affect the effective ratio experienced by physical buyers.
Market Structure Changes: Long-term shifts in supply-demand dynamics or monetary systems could permanently alter historical ratio relationships. Silver's increasing industrial usage relative to monetary demand represents one such structural change affecting traditional ratio analysis.
Liquidity Constraints: Physical precious metals markets have limited liquidity compared to financial markets. Large ratio-based rebalancing may face execution challenges or require accepting less favorable prices.
Strategic Limitations:
Capital Requirements: Effective ratio trading requires substantial capital to make meaningful allocation changes while maintaining diversification. Smaller investors may find transaction costs overwhelming relative to position sizes.
Storage and Insurance: Physical metals require secure storage and insurance, adding ongoing costs that reduce net returns. These expenses can be particularly significant for silver given its lower value-to-weight ratio.
Tax Complexity: Frequent metal swaps create taxable events that may reduce after-tax returns. ETF-based strategies can mitigate some tax impacts but introduce counterparty risk and tracking error.
Psychological Challenges: Ratio trading often requires investing more heavily in whichever metal has recently underperformed, creating psychological discomfort that challenges strategy adherence.
Risk Mitigation Strategies:
Position Sizing: Limit ratio-based allocation to a portion of total precious metals holdings, maintaining core positions regardless of ratio levels.
Gradual Implementation: Phase in ratio-based strategies over time rather than making large immediate allocation changes based on current readings.
Multiple Timeframes: Consider ratio signals across different timeframes (monthly, quarterly, annually) to reduce whipsaw risk from short-term volatility.
Hybrid Approaches: Combine ratio signals with fundamental analysis, technical indicators, and macroeconomic factors for more robust decision-making.
Understanding these limitations helps establish realistic expectations and appropriate position sizing for ratio-based precious metals strategies. For more insights on managing precious metals portfolio risks, review our comprehensive silver stacking strategy guide.
Frequently Asked Questions About Gold/Silver Ratio Trading
What is the best gold/silver ratio to buy silver?
Historical data suggests silver accumulation becomes particularly attractive when the ratio exceeds 80:1. At these levels, silver has typically been significantly undervalued relative to gold, with a success rate of approximately 75% for profitable trades within two years. The March 2020 peak of 123:1 represents the most extreme buying opportunity in recent decades. However, investors should begin gradual accumulation around 75:1 rather than waiting for extreme readings that may not occur.
How long should I hold positions based on ratio signals?
Ratio-based trades typically require 1-3 years for meaningful reversion, though extreme readings may correct more quickly. The 2020 ratio spike from 123:1 to 70:1 occurred within 8 months, while the 2008-2011 cycle took nearly three years to complete. Plan for minimum 12-month holding periods and have patience for full cycle completion. Short-term ratio fluctuations should not trigger frequent position changes.
Should I use physical metals or ETFs for ratio trading?
ETFs offer several advantages for ratio trading, including lower transaction costs, easier rebalancing, and no storage requirements. Physical metals provide direct ownership but involve higher premiums and storage costs that can reduce net returns from frequent trading. Consider ETFs for tactical ratio trades and physical metals for long-term core positions. Many successful ratio traders use a hybrid approach combining both vehicles.
Can ratio trading work with other precious metals like platinum?
While gold/silver ratio trading has the most extensive historical data and liquidity, similar principles apply to platinum/gold and palladium ratios. However, these metals have different supply-demand dynamics driven more heavily by industrial applications, making ratio analysis less reliable. The gold/silver relationship benefits from both metals' monetary properties and extensive trading history, making it the most suitable for systematic ratio strategies.
What happens if the ratio never reverts to historical norms?
Structural changes in precious metals markets could permanently alter historical ratio relationships. Silver's increasing industrial demand relative to monetary use represents one potential structural shift. However, both metals retain monetary properties and mining supply constraints that support mean reversion tendencies. Successful ratio traders use historical ranges as guidelines rather than guarantees, maintaining diversified positions and avoiding over-concentration in ratio-based strategies.
As you develop your ratio trading approach, remember that this strategy works best as part of a broader precious metals allocation rather than as a standalone investment method. Our Silver Investing 101 hub provides additional context for building comprehensive precious metals strategies that incorporate ratio analysis alongside fundamental and technical factors.
Sources
- CFTC Commitments of Traders Reports: https://www.cftc.gov/dea/futures/other_lf.htm
- LBMA Precious Metals Pricing Data: https://www.lbma.org.uk/prices-and-data
- World Gold Council Market Research: https://www.gold.org/goldhub/data
- Silver Institute Supply and Demand Reports: https://www.silverinstitute.org
- CME Group COMEX Market Data: https://www.cmegroup.com/markets/metals.html
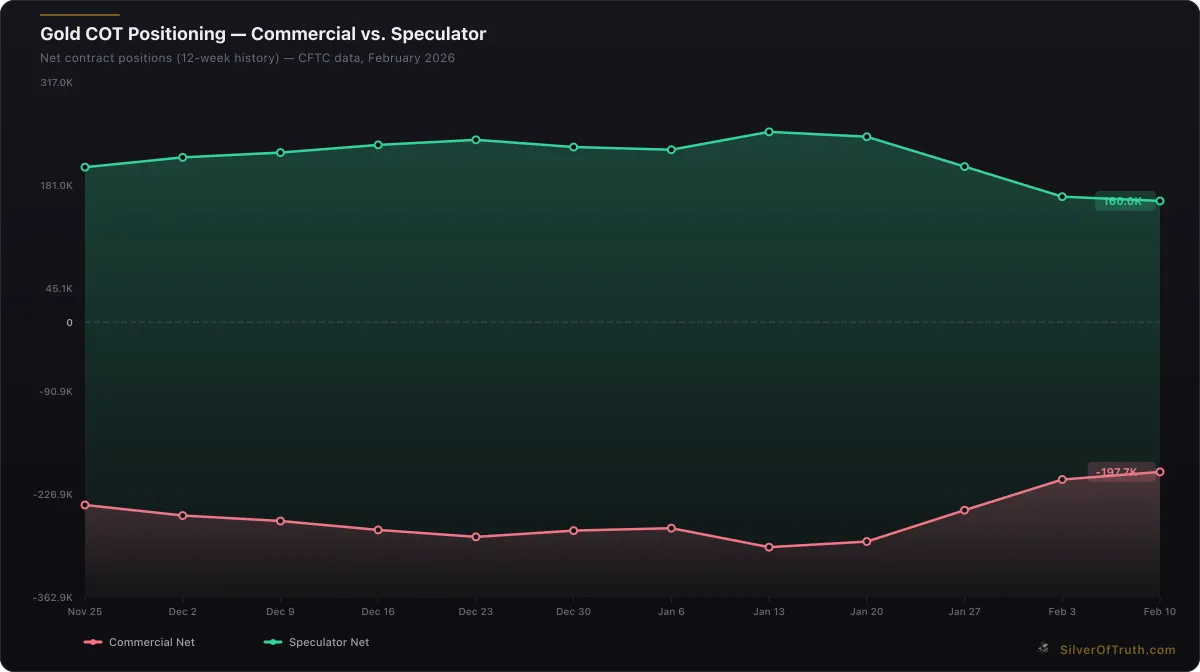
Gold COT positioning: commercial hedgers (red) vs. speculators (green). Source: CFTC via SilverOfTruth, February 2026
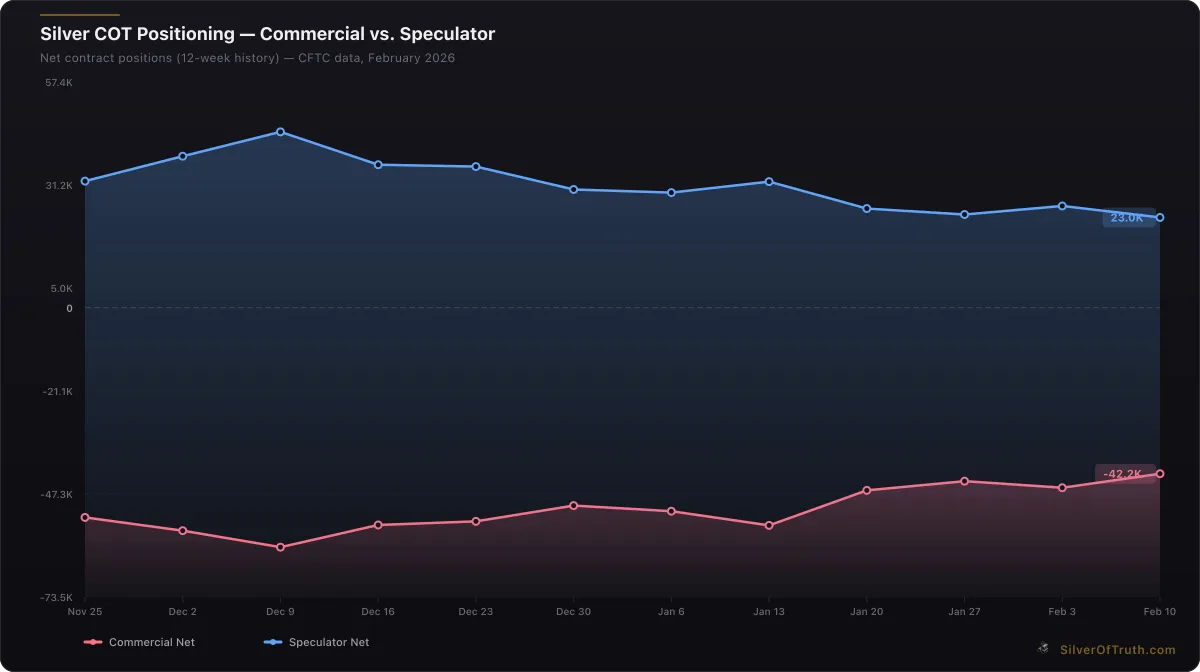
Silver COT positioning: commercial hedgers (red) vs. speculators (blue). Source: CFTC via SilverOfTruth, February 2026
Disclaimer: This article is for informational and educational purposes only and does not constitute financial, investment, or trading advice. Past performance is not indicative of future results. Always conduct your own research and consult with a qualified financial advisor before making investment decisions. SilverOfTruth provides market data and analysis tools — it does not provide personalized financial advice.