

Silver burst higher by 4.1% on Tuesday, reaching $76.57 per ounce as precious metals investors grapple with mounting supply concerns at COMEX warehouses. The silver price surge coincides with a troubling 55.7% coverage ratio, placing the exchange in high-risk territory where total inventory barely covers open interest obligations.
This dramatic price movement reflects deeper structural issues within the COMEX silver market. With 371.97 million ounces of total inventory facing 668.21 million ounces of potential delivery obligations, the exchange operates with increasingly thin margins of safety. The combination of rising prices and constrained physical supply creates a volatile environment that demands careful analysis from precious metals investors.
Silver's Explosive 4.1% Rally Analysis
Silver's surge to $76.57 represents the metal's strongest single-day performance in recent weeks, with intraday trading reaching a high of $76.94 before settling. The 4.1% gain significantly outpaced other precious metals, with gold advancing 1.4% to $4,975.10 and platinum gaining 2.8% to $2,075.
The rally's magnitude becomes more significant when viewed against recent market dynamics. Silver had traded in a tight range between $72-$74 for much of February before breaking decisively higher. According to CME Group data, trading volume spiked during the New York session as algorithmic systems responded to technical breakout signals.
Industrial demand factors appear to be supporting the price action. Silver's role in electric vehicle production and 5G infrastructure continues expanding, creating baseline demand that supports price floors even during speculative selling periods. The metal's unique position as both an industrial commodity and monetary metal amplifies volatility when supply concerns emerge.
Federal Reserve policy expectations also contributed to the surge. Recent comments from Fed officials suggesting potential pause in rate hiking cycles have weakened the dollar and reduced opportunity costs for holding non-yielding precious metals. Real interest rates, calculated as nominal rates minus inflation expectations, remain in negative territory according to CFTC positioning data, creating favorable conditions for precious metals investments.
COMEX Coverage Ratio Reaches High-Risk Territory
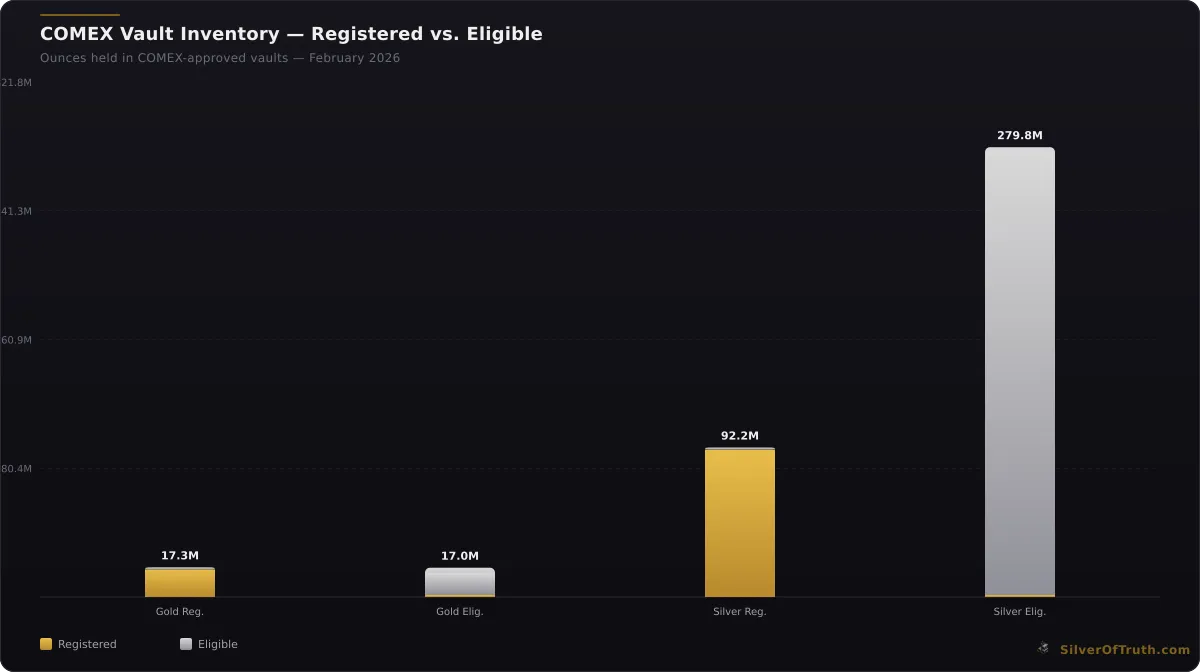
The COMEX silver coverage ratio of 55.7% represents a critical threshold that institutional traders monitor closely. This metric compares total warehouse inventory (371.97 million ounces) against potential delivery obligations from open interest (668.21 million ounces worth of contracts). When coverage falls below 60%, delivery squeeze risks escalate significantly.
Source: SilverOfTruth COMEX data, February 2026
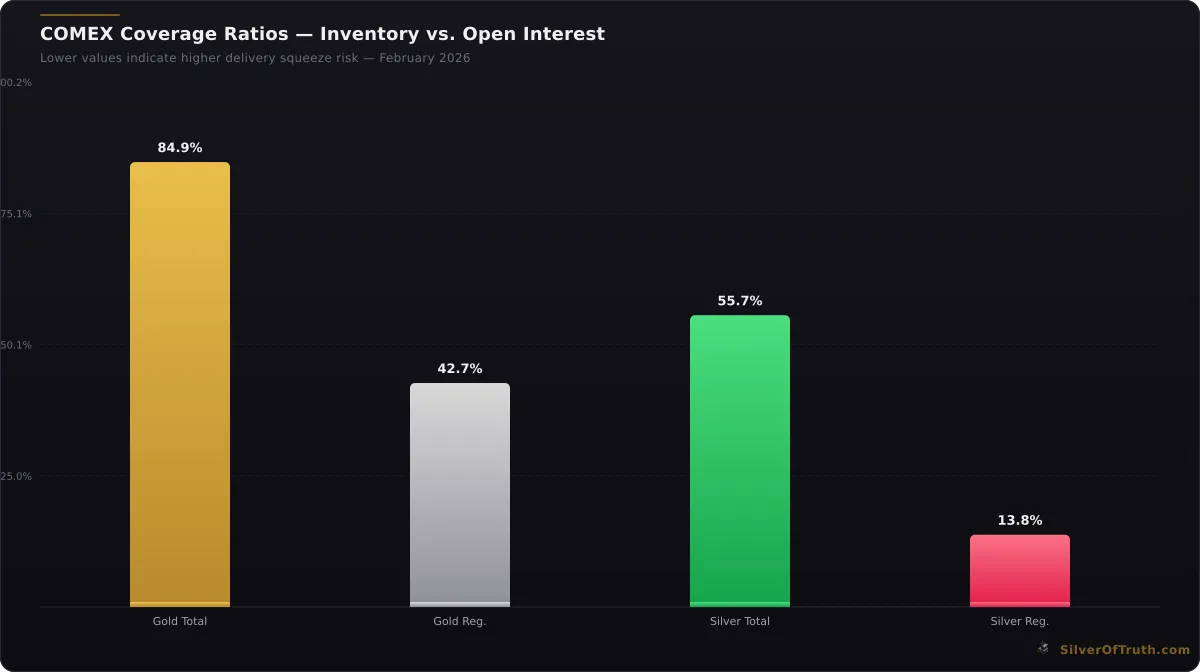
COMEX coverage ratios — lower values indicate higher delivery squeeze risk. Source: SilverOfTruth, February 2026
Registered inventory, the portion immediately available for delivery, totals just 92.15 million ounces. This creates an even more concerning registered coverage ratio of 13.8%, meaning only 13.8% of potential delivery demands can be satisfied with immediately deliverable metal. Historical analysis shows delivery stress typically emerges when registered coverage drops below 20%.
The current inventory composition reveals structural vulnerabilities. Eligible inventory accounts for 279.82 million ounces, but this metal requires additional documentation and potential transportation before becoming deliverable. During periods of high delivery demand, the conversion process from eligible to registered can create bottlenecks that amplify supply constraints.
Our guide to COMEX inventory mechanics explains how these classifications impact market dynamics. The large differential between eligible and registered creates false comfort, as eligible metal may not convert quickly enough during delivery periods to prevent supply shortages.
Recent inventory trends compound these concerns. COMEX silver inventories declined 1.2% in the past week according to warehouse reports, continuing a pattern of steady depletion that began in late January. Monthly data shows total inventories down 3.8% from December levels, suggesting sustained physical demand that exceeds new metal inflows.
Supply Chain Vulnerabilities and Market Structure
COMEX's inventory structure reflects broader supply chain challenges facing the silver market. The concentration of deliverable inventory in specific warehouse locations creates geographic risk factors that amplify during periods of high demand. Delaware and New York facilities hold the majority of registered inventory, creating potential logistical constraints during delivery periods.
Mining production data from the Silver Institute indicates global mine supply remains constrained by permitting delays and cost inflation affecting major producing regions. Mexico and Peru, which account for approximately 40% of global silver production, face ongoing challenges from labor disputes and environmental regulations that limit expansion capabilities.
Recycling flows, which typically provide 15-20% of annual silver supply, have weakened as consumer electronics replacement cycles extended and industrial users optimized recovery processes. This secondary supply decline places additional pressure on primary mining output to meet industrial and investment demand growth.
The silver market's unique industrial demand profile creates price inelasticity that differs from gold. Electronics manufacturers, solar panel producers, and medical device companies require silver regardless of price levels, creating baseline demand that supports price floors. Our analysis of industrial silver applications shows demand growth of 4-6% annually across key sectors.
Exchange-traded product (ETP) holdings add another demand layer. The largest silver ETFs hold over 600 million ounces globally, representing significant inventory that remains outside COMEX warehouse systems. When ETP demand increases, it competes directly with COMEX inventory for available physical silver.
CFTC Positioning Data Reveals Market Dynamics
The latest Commodity Futures Trading Commission (CFTC) Commitment of Traders report provides crucial insights into positioning that influenced Tuesday's price surge. Commercial traders, primarily mining companies and industrial users, maintain net short positions of -42,163 contracts, representing their hedging activities against future production and consumption needs.
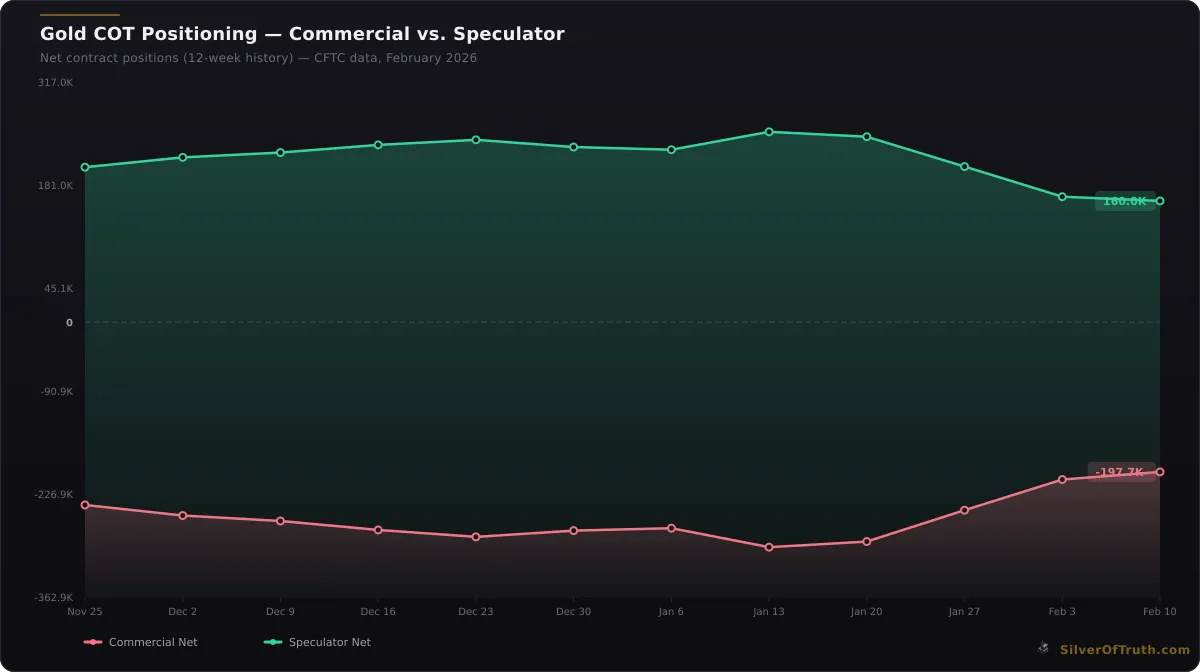
Gold COT positioning: commercial hedgers (red) vs. speculators (green). Source: CFTC via SilverOfTruth, February 2026
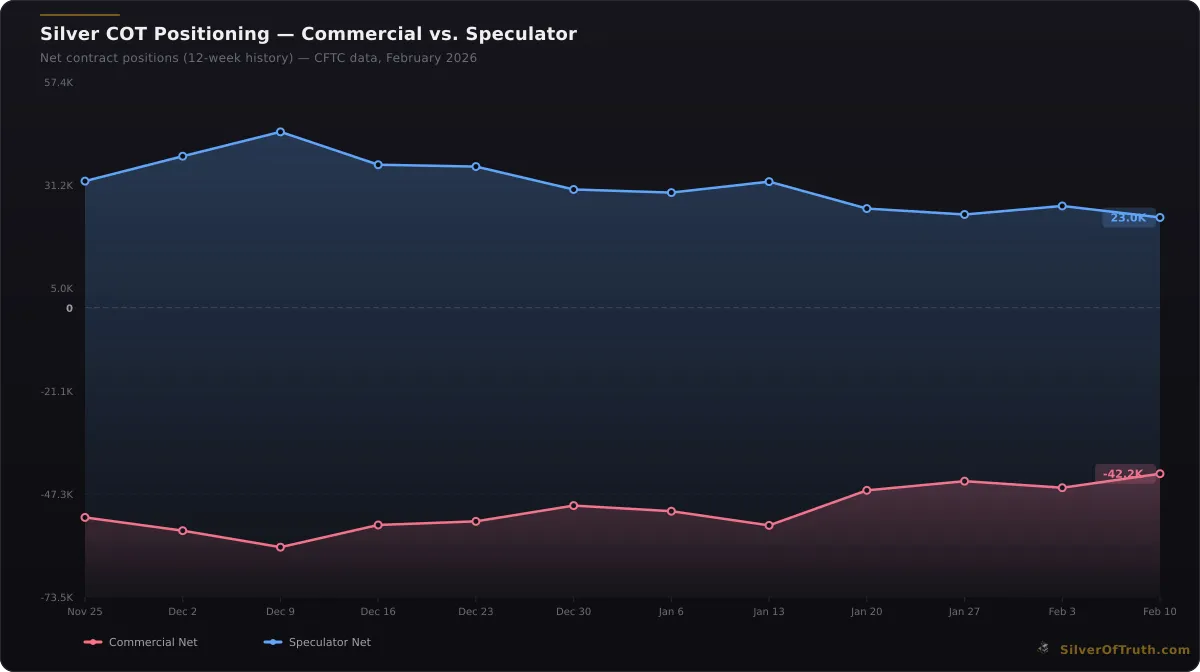
Silver COT positioning: commercial hedgers (red) vs. speculators (blue). Source: CFTC via SilverOfTruth, February 2026
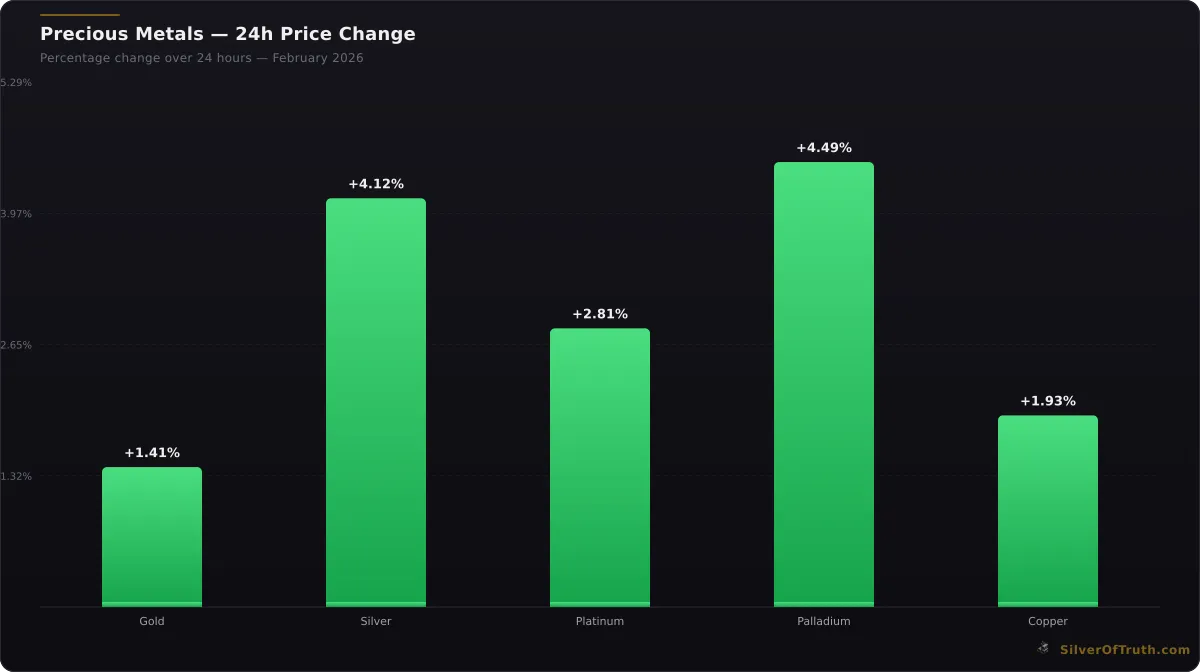
24-hour precious metals price changes. Source: SilverOfTruth, February 2026
Speculative positioning shows more balanced dynamics compared to historical extremes. Non-commercial traders hold net long positions of 22,955 contracts, representing moderate bullish sentiment without excessive leverage that characterized previous bubble periods. This positioning structure suggests room for additional speculative buying if supply concerns intensify.
Managed money positions within the speculative category show 12,222 long contracts versus 7,653 short contracts, indicating hedge fund and institutional momentum strategies remain modestly bullish. The relatively low net positioning of 4,569 contracts suggests these professional traders haven't yet fully embraced the supply shortage narrative.
Swap dealers, who facilitate client hedging and often represent bullion bank activities, hold net short positions of -25,373 contracts. These positions typically reflect customer hedging needs and inventory management activities rather than directional speculation. The size of swap dealer shorts indicates significant client demand for price protection.
Our comprehensive guide to COT analysis explains how these positioning metrics interact with physical market dynamics. The current setup shows modest speculative length combined with significant commercial shorts, suggesting potential for continued price appreciation if supply concerns intensify.
Gold/Silver Ratio Implications
The gold/silver ratio currently trades at 64.97, reflecting silver's outperformance during Tuesday's rally. This ratio declined 2.6% as silver's 4.1% gain significantly exceeded gold's 1.4% advance, indicating relative strength in the white metal that often signals industrial demand acceleration or supply constraint recognition.
Historical analysis shows the gold/silver ratio tends to compress during periods of silver supply stress. The current level remains above the 20-year average of 68, suggesting silver maintains relative value appeal compared to gold for investors focused on precious metals diversification.
The ratio's behavior during COMEX delivery periods provides additional context. When silver supply constraints emerge, the ratio typically compresses rapidly as silver prices rise faster than gold. The current 65 level provides room for further compression if delivery pressures intensify during upcoming COMEX contract months.
Technical analysis of the ratio suggests support levels near 62-63, representing potential targets if silver's supply shortage narrative gains broader recognition. Our detailed ratio analysis shows how these levels historically coincide with silver allocation increases in professional portfolios.
Currency dynamics also influence the ratio's direction. Dollar weakness, driven by Federal Reserve policy expectations, typically benefits both precious metals but creates larger percentage moves in silver due to its lower absolute price and higher volatility characteristics.
Investment Implications and Risk Assessment
The combination of silver's price surge and high COMEX coverage ratio creates complex investment implications that require careful analysis. The immediate risk involves potential delivery disruptions if open interest remains elevated while inventory continues declining. Such scenarios historically produce explosive price movements as market participants compete for limited physical supply.
Conservative investors should consider the coverage ratio as an early warning indicator rather than an immediate crisis signal. The 55.7% level represents elevated risk but not imminent delivery failure. However, continued inventory depletion combined with steady or rising open interest could quickly push coverage into crisis territory below 40%.
Portfolio allocation decisions should account for silver's dual nature as both industrial commodity and monetary metal. Industrial demand provides price support during economic expansion periods, while monetary demand accelerates during currency debasement concerns. The current environment combines both factors, potentially amplifying price volatility in either direction.
Risk management becomes crucial given the supply constraints and positioning dynamics. Physical silver ownership through allocated storage programs provides direct exposure without counterparty risk associated with paper instruments. However, premium levels over spot prices may increase if supply constraints intensify.
Mining equity investments offer leveraged exposure to silver price movements but carry operational and financial risks independent of metal prices. Our mining stock evaluation guide helps investors assess which companies benefit most from sustained higher silver prices versus those facing cost pressures.
Market Structure Evolution and Long-Term Outlook
The COMEX silver market continues evolving as physical demand growth outpaces traditional supply sources. Electronic trading systems now execute most transactions, creating rapid price discovery but potentially amplifying volatility during supply constraint periods. High-frequency trading algorithms respond instantly to inventory data releases, contributing to sharp price movements like Tuesday's surge.
Global silver market integration means COMEX dynamics influence worldwide pricing despite representing only a fraction of total silver trading. The London Bullion Market Association (LBMA) and Shanghai Gold Exchange maintain their own inventory systems, but arbitrage mechanisms ensure price convergence across major trading centers.
Supply diversification efforts continue as market participants recognize concentration risks within current production and inventory systems. New warehouse facilities, expanded delivery options, and alternative settlement mechanisms may reduce future supply constraint impacts. However, these structural changes require years to implement fully.
Central bank policies regarding precious metals backing for digital currencies could create additional demand layers that traditional supply forecasts haven't incorporated. Several monetary authorities explore precious metals reserves as backing for central bank digital currencies (CBDCs), potentially creating sustained institutional demand.
Environmental, social, and governance (ESG) considerations increasingly influence silver mining investment and production decisions. These factors may constrain future supply growth even if economic incentives support expansion, creating long-term supply tightness that supports higher price levels.
Frequently Asked Questions
What does a 55.7% COMEX coverage ratio mean for silver prices?
A 55.7% coverage ratio indicates COMEX warehouses hold 371.97 million ounces of silver inventory against 668.21 million ounces of potential delivery obligations from open interest. This high-risk level suggests limited buffer against delivery demands, historically leading to increased price volatility and potential supply squeeze scenarios if demand intensifies.
How quickly can COMEX silver inventory be depleted during high delivery periods?
COMEX silver inventory can face significant pressure within days during high delivery periods. Registered inventory of 92.15 million ounces represents immediate delivery capability, but monthly delivery demands can reach 50-100 million ounces during squeeze periods. Eligible inventory requires additional processing time, creating potential bottlenecks during crisis periods.
Should investors buy physical silver during COMEX supply constraints?
Physical silver purchases during supply constraints offer direct exposure without counterparty risk, but investors should expect higher premiums over spot prices. Allocated storage programs provide security while maintaining liquidity, though premium levels may increase 20-40% during supply stress periods. Consider dollar-cost averaging to manage timing risks.
How do COMEX inventory levels compare to historical delivery squeeze periods?
Current inventory levels remain above crisis thresholds seen during 2011 and 2020 delivery squeeze periods, when coverage ratios fell below 30%. However, the 55.7% level represents elevated risk territory where supply disruptions can escalate rapidly. Historical patterns suggest increased volatility and potential price acceleration if coverage continues declining.
What triggers COMEX delivery demand that could worsen supply constraints?
Delivery demand typically increases during currency debasement periods, inflation concerns, and industrial supply chain disruptions. Large institutional investors, ETF creation activities, and industrial users facing supply shortages can generate significant delivery pressure. Federal Reserve policy changes and geopolitical tensions often catalyze demand spikes that stress inventory levels.
Track real-time COMEX silver inventory and coverage ratios with the SilverOfTruth app, available on the App Store. Get instant alerts when coverage ratios reach critical levels and access professional-grade precious metals analysis.
Disclaimer: This article is for informational and educational purposes only and does not constitute financial, investment, or trading advice. Past performance is not indicative of future results. Always conduct your own research and consult with a qualified financial advisor before making investment decisions. SilverOfTruth provides market data and analysis tools. It does not provide personalized financial advice.