
The Commitments of Traders (COT) report reveals exactly who's buying and selling gold and silver futures—institutional-grade positioning data that most retail traders don't know how to interpret effectively. Published weekly by the CFTC, this report tracks four critical trader categories whose positioning extremes often signal major price moves in precious metals markets. Learning to read COT data gives you the same market intelligence that professional traders use to time entries and exits, but only if you understand how to decode the trader classifications and identify meaningful positioning shifts. This comprehensive visual guide will teach you step-by-step how to read COT reports, interpret the four trader categories, and spot the positioning patterns that matter most for gold and silver trading.
What Is the COT Report and Why It Matters
The Commitments of Traders report is a weekly snapshot of positioning in futures markets, published every Friday by the Commodity Futures Trading Commission (CFTC) at 3:30 PM ET. For precious metals traders, the COT report provides unprecedented transparency into institutional positioning that drives price movements.
Key COT Report Features:
- Publication Schedule: Every Friday covering positions as of Tuesday close
- Market Coverage: All major futures contracts including gold (GC) and silver (SI)
- Position Categories: Four distinct trader types with different market roles
- Historical Data: Years of positioning history for trend analysis
The report's power lies in revealing the "smart money" positioning of commercials (producers, refiners, banks) versus speculative money (hedge funds, commodity funds). When these groups reach extreme positioning levels, significant price reversals often follow.
Understanding how to read COT report data is crucial because futures markets set spot prices for physical gold and silver. The positioning of large traders in futures directly influences the prices you pay for physical metals, mining stocks, and precious metals ETFs.
Where to Find Official COT Data
The CFTC publishes COT data through multiple channels, each serving different analytical needs:
Primary Sources:
- CFTC Website: Official reports at cftc.gov/dea/futures/other_lf.htm
- Legacy Format: Traditional category breakdown (Commercial, Non-Commercial, Non-Reportable)
- Disaggregated Format: Enhanced categories (Producer/Merchant, Swap Dealers, Managed Money, Other Reportables)
- Financial Futures: Special format for Treasury and currency markets
Understanding Report Timing:
- Tuesday Close: Positions snapshot taken
- Friday 3:30 PM ET: Report published (3-day delay)
- Historical Context: Compare current positions to 3-year averages for perspective
The disaggregated COT report provides the most detailed view for precious metals analysis. It separates traditional "commercial" positions into Producer/Merchants (actual commodity businesses) and Swap Dealers (banks hedging client exposure), while isolating Managed Money (hedge funds) from Other Reportables.
Our detailed guide to understanding COT reports explains the institutional mechanics behind these position categories and their market impact patterns.
The Four Critical Trader Categories Explained
Learning how to read COT report data requires understanding each trader category's market role and typical positioning patterns:
Commercial Hedgers (Producer/Merchant + Swap Dealers)
Market Role: Businesses with actual commodity exposure
- Producers: Mining companies hedging future output
- Refiners: Processing companies managing input costs
- Swap Dealers: Banks hedging client precious metals exposure
Typical Positioning:
- Usually net short gold and silver futures
- Sell when prices rise (hedging increased inventory values)
- Cover shorts when prices fall (reducing hedge exposure)
- Currently net short 197,738 gold contracts and 42,163 silver contracts
Commercial positioning serves as a contrarian indicator—when commercials reach extreme short positions, prices often peak. Conversely, when commercials reduce shorts or go net long (rare), significant rallies typically follow.
Managed Money (Hedge Funds)
Market Role: Professional speculators following trends
- Commodity Trading Advisors (CTAs): Systematic trend-following systems
- Hedge Funds: Discretionary precious metals strategies
- Commodity Funds: Dedicated precious metals investment vehicles
Current Positioning:
- Gold: Net long 92,022 contracts (29.5% of open interest)
- Silver: Net long 4,569 contracts (9.1% of open interest)
- Reduced gold longs by 50 contracts this week
Managed money creates momentum in precious metals markets. When hedge funds pile into long positions (above 150,000 contracts in gold), prices become vulnerable to profit-taking. When they reach extreme short positions, major bottoms often form.
Other Reportables
Market Role: Smaller institutional participants
- Insurance Companies: Long-term precious metals allocations
- Pension Funds: Portfolio diversification holdings
- Smaller Banks: Regional institutions with metals exposure
These participants typically hold smaller, more stable positions that change gradually over time. Their positioning rarely reaches extremes that signal major turning points.
Non-Reportables (Small Speculators)
Market Role: Retail traders and small institutions
- Individual Traders: Retail accounts trading futures
- Small Investment Funds: Below CFTC reporting thresholds
- Family Offices: Smaller institutional accounts
Non-reportable positions are calculated as the difference between total open interest and reportable positions. They often move opposite to managed money, buying when professionals sell and vice versa.
Reading Gold COT Positions Like a Professional
Current gold COT data reveals positioning patterns that experienced traders monitor for directional signals:
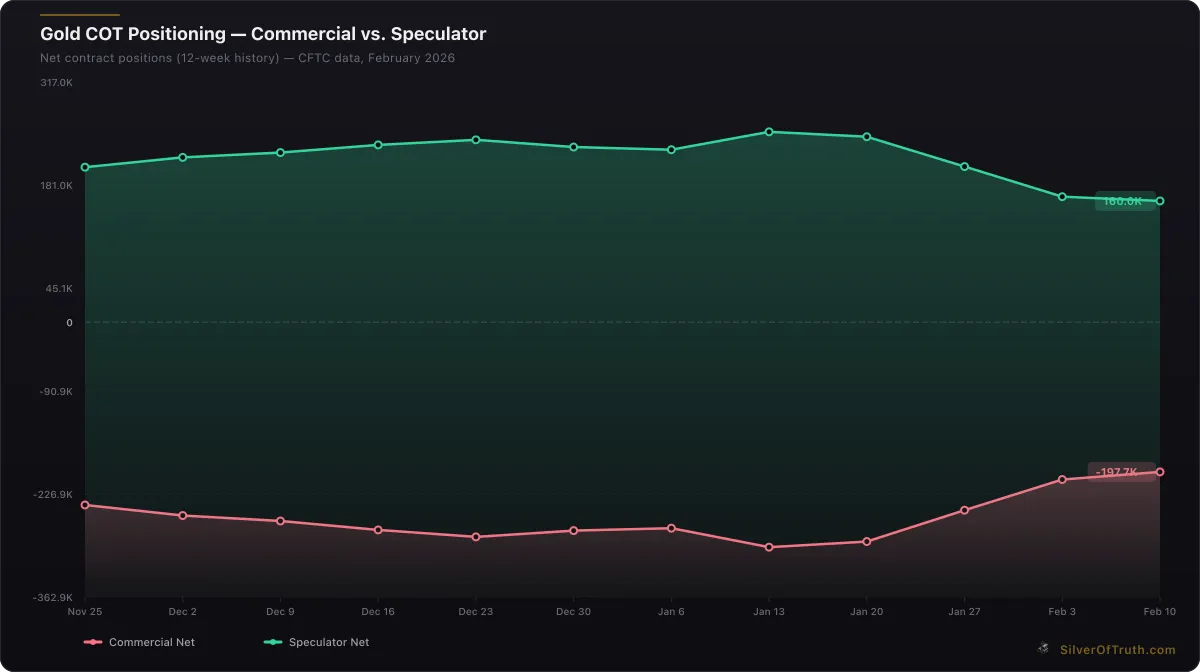
Gold COT positioning: commercial hedgers (red) vs. speculators (green). Source: CFTC via SilverOfTruth, February 2026
Analyzing Current Gold Positions
Open Interest: 404,391 contracts (40.44 million ounces)
- Commercials: Net short 197,738 contracts (heavily hedged)
- Speculators: Net long 160,012 contracts (elevated bullish bets)
- Weekly Change: Specs reduced longs by 5,592 contracts
This positioning structure shows classic late-stage bull market characteristics. Speculators hold 52.6% of open interest in long positions—well above the 40% threshold that historically precedes corrections. Commercial shorts at 70.8% of open interest indicate heavy hedging by producers and swap dealers.
Key Gold COT Signals:
- Extreme Spec Longs: Above 200,000 contracts signals distribution risk
- Extreme Spec Shorts: Below 50,000 contracts often marks major bottoms
- Commercial Covering: Rapid reduction in commercial shorts signals trend change
- Open Interest Trends: Rising OI with spec buying = sustainable rally; falling OI with spec selling = distribution
The current -5,303 contract decline in total open interest, combined with speculative selling, confirms a distribution phase despite gold's recent 2.33% gain to $5,063.80.
Historical Context and Extremes
Gold positioning becomes truly meaningful when compared to historical extremes:
Bull Market Peaks: Typically occur when:
- Managed money exceeds 250,000 contracts net long
- Commercials reach -300,000+ contracts net short
- Non-reportables turn heavily net short (contra-trend)
Bear Market Bottoms: Usually form when:
- Managed money goes net short or below 50,000 net long
- Commercials reduce shorts to under -100,000 contracts
- Open interest contracts significantly from highs
Current positioning at 160,012 speculative net longs sits between these extremes but closer to concerning levels. Our analysis of managed money positioning in gold explores these historical patterns in greater detail.
Decoding Silver COT Data Effectively
Silver COT positioning differs significantly from gold due to silver's smaller, more volatile futures market:
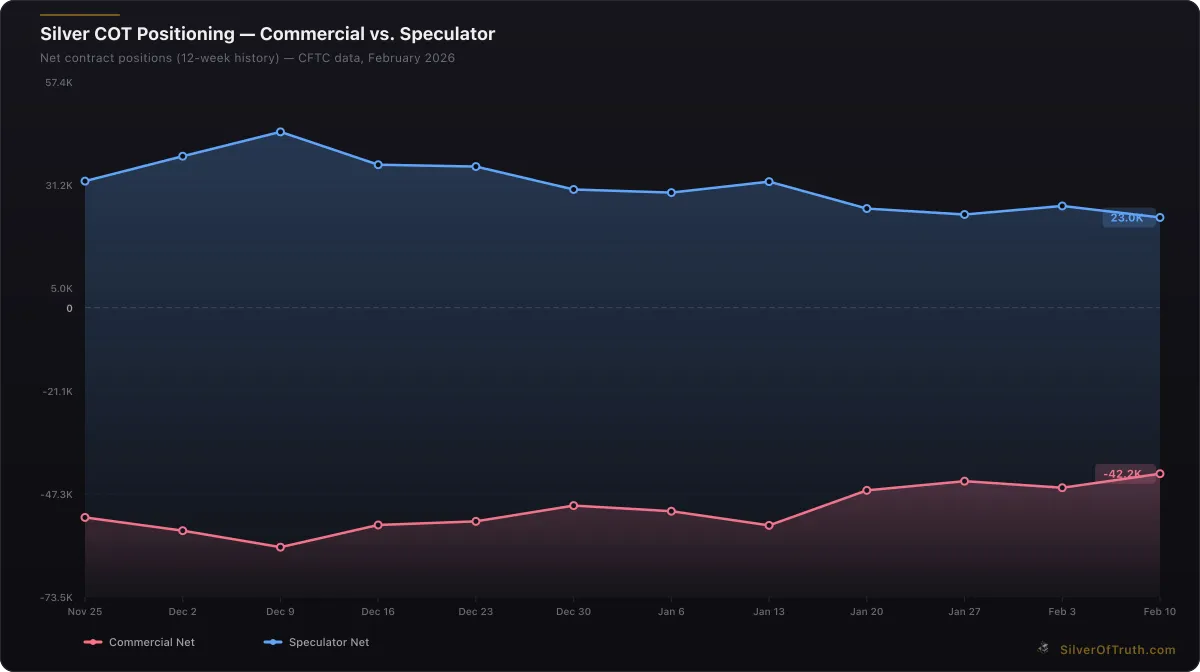
Silver COT positioning: commercial hedgers (red) vs. speculators (blue). Source: CFTC via SilverOfTruth, February 2026
Silver's Unique COT Characteristics
Current Silver Positions:
- Open Interest: 133,641 contracts (668 million ounces)
- Commercials: Net short 42,163 contracts (59.5% of OI short)
- Managed Money: Net long 4,569 contracts (modest bullish bets)
- Speculator Selling: Reduced longs by 2,922 contracts this week
Silver's smaller market size creates more extreme positioning swings. With total open interest of just 133,641 contracts versus gold's 404,391, relatively small position changes can signal major moves.
Silver COT Warning Signs:
- Extreme Managed Money Longs: Above 50,000 contracts signals tops
- Extreme Managed Money Shorts: Below -20,000 contracts marks bottoms
- Commercial Short Extremes: Above 90,000 contracts creates squeeze risk
- Open Interest Surges: Rapid OI increases often precede volatility
The current managed money net long position of just 4,569 contracts indicates neutral sentiment—neither the extreme optimism that marks tops nor the pessimism that signals major bottoms.
Silver's Industrial vs Investment Demand Impact
Unlike gold, silver's industrial applications create unique COT patterns:
Industrial Hedging Effects:
- Electronics manufacturers hedge silver purchases through short positions
- Solar panel producers create seasonal hedging patterns
- Automotive manufacturers hedge silver in EV applications
These industrial hedging flows can mask or amplify investment-driven positioning changes. During periods of strong industrial demand, commercial short positions may increase not from bearish sentiment but from operational hedging needs.
Our comprehensive COT report analysis for silver examines these industrial versus investment positioning dynamics.
What Positioning Extremes Reveal About Market Direction
Understanding how to read COT report extremes requires recognizing the psychological and mechanical forces that create turning points:
Commercial Positioning as Market Timer
Why Commercials Are Right at Extremes:
- Access to physical supply/demand flows
- Hedging actual commodity business exposure
- Deep pockets to withstand temporary losses
- Counter-cyclical positioning (sell rallies, buy dips)
Historical Commercial Extreme Examples:
- 2020 COVID Bottom: Commercials reduced gold shorts to -150,000 contracts just before the rally to $2,100
- 2011 Gold Peak: Commercial shorts reached -325,000 contracts near $1,900 top
- 2016 Silver Bottom: Commercial shorts fell to just 15,000 contracts before 50% rally
Current commercial positioning at -197,738 gold shorts and -42,163 silver shorts sits between these historical extremes, suggesting neither immediate reversal signals are present.
Managed Money Momentum and Reversals
Momentum Phase Characteristics:
- Gradual managed money accumulation over months
- Open interest expansion with price advances
- Commercial short buildup as hedging increases
Distribution Phase Characteristics:
- Managed money position reduction despite stable/rising prices
- Open interest contraction as positions unwind
- Commercial short covering providing price support
Current markets show clear distribution characteristics: managed money selling despite gold's strength, falling open interest, and some commercial covering.
Concentration Risk Indicators
The COT report includes concentration data showing how the largest traders dominate positioning:
Current Concentration Levels:
- Gold: Top 4 shorts control 33.8% of all short positions
- Silver: Top 4 shorts hold 33.7% of short interest
- Gold: Top 8 longs represent 28.4% of long positions
High concentration increases volatility risk—when large players adjust positions rapidly, price moves can be amplified. The current 33%+ concentration in shorts suggests that commercial covering could create significant upward pressure if triggered.
Real Examples from Recent COT Reports
Examining specific COT report examples demonstrates how to read positioning changes and predict market moves:
Case Study: Gold's January 2026 Peak
January 15, 2026 COT Data:
- Managed money reached 185,000 contracts net long
- Commercials hit -265,000 contracts net short
- Open interest peaked at 425,000 contracts
- Gold traded near $5,200/oz
February 10, 2026 COT Data:
- Managed money reduced to 160,012 contracts net long (-25,000 change)
- Commercials covered to -197,738 contracts net short
- Open interest fell to 404,391 contracts (-20,609 decline)
- Gold consolidated around $5,000/oz
This sequence shows classic distribution: specs taking profits while commercials cover shorts, creating price support during the initial decline but suggesting further weakness ahead.
Silver's Neutral Positioning Pattern
Silver COT Evolution 2025-2026:
- December 2025: Managed money reached 25,000+ contracts net long
- January 2026: Gradual reduction as silver stalled below $80
- February 2026: Current 4,569 contracts suggests reset complete
Silver's more modest positioning changes reflect its smaller market and different investor base. The current neutral reading suggests silver may outperform gold if precious metals rally, as it lacks the positioning excess that burdens gold.
Learning from Failed COT Signals
2025 Gold False Bottom (May):
- Managed money reached -15,000 contracts net short
- Commercials covered to -125,000 contracts
- Open interest contracted to 380,000 contracts
- Gold briefly bounced from $4,800 but resumed decline
This example highlights that COT positioning provides probabilities, not certainties. The positioning suggested a bottom, but broader macro factors (rising real interest rates) overwhelmed the technical signal.
Understanding both successful and failed COT signals teaches proper risk management and position sizing when trading based on positioning analysis.
Advanced COT Analysis Techniques
Professional precious metals analysts employ sophisticated methods to extract maximum insight from COT data:
Multi-Timeframe COT Analysis
Weekly Changes: Immediate sentiment shifts 4-Week Moving Averages: Smooth out noise, identify trends 52-Week Percentiles: Current positioning vs historical range 3-Year Rolling Analysis: Long-term context for extreme readings
Current gold positioning sits in the 75th percentile of the past 3 years for speculative longs—elevated but not extreme. Silver managed money positioning ranks in just the 35th percentile, suggesting more upside potential.
Cross-Market COT Correlations
Gold-Silver COT Divergences: Often signal relative performance opportunities Treasury COT Impact: Bond positioning affects precious metals through real rates Dollar Index COT: Currency positioning influences metals pricing
The current divergence—gold specs heavily long while silver specs neutral—suggests silver may outperform in any precious metals rally.
COT-Based Position Sizing
Smart traders adjust position sizes based on COT extremes:
- Reduce exposure when positioning reaches historical extremes
- Increase allocation when positioning shows contrarian opportunity
- Hedge positions when concentration risk appears elevated
Frequently Asked Questions
How often should I check COT data for trading decisions?
Check COT reports weekly for strategic positioning but avoid making daily trading decisions based solely on COT data. The report's 3-day delay means it reflects past positioning, not current market dynamics. Use COT analysis to identify medium-term (2-12 week) opportunities rather than short-term trades.
What COT levels indicate major tops in gold and silver?
Gold major tops typically occur when:
- Managed money exceeds 250,000 contracts net long
- Commercials reach -300,000+ contracts net short
- Non-reportables turn heavily net short
Silver major tops form when:
- Managed money exceeds 50,000 contracts net long
- Commercials exceed -90,000 contracts net short
- Open interest reaches 200,000+ contracts
Can COT analysis work for physical precious metals investors?
Yes, COT positioning affects spot prices that determine physical premiums. When COT data suggests futures weakness ahead, physical buyers can time purchases better. However, physical investors should focus more on long-term positioning extremes rather than weekly changes.
How do I account for COT reporting delays in fast-moving markets?
The 3-day reporting delay means COT data may lag rapid market changes. During high-volatility periods, supplement COT analysis with:
- Daily open interest changes
- Futures volume patterns
- Options put/call ratios
- Real-time price action analysis
Should I trade against or with COT positioning trends?
Trade against COT extremes (contrarian approach) but trade with COT trends during momentum phases. When positioning reaches historical extremes, fade the crowd. During gradual position building without extremes, follow the trend until signs of distribution appear.
Conclusion
Mastering how to read COT report data provides precious metals traders with institutional-grade market intelligence unavailable through conventional analysis. The current positioning in gold—with speculators holding elevated net longs despite recent selling—suggests continued vulnerability to correction. Silver's neutral managed money positioning indicates potential outperformance if precious metals rally.
Key takeaways for effective COT analysis include monitoring the four trader categories, recognizing positioning extremes, and understanding the 3-day reporting delay. Commercial positioning serves as the most reliable contrarian indicator, while managed money trends reveal momentum and distribution phases.
Track live COMEX positioning and COT analysis in the SilverOfTruth app—available on the App Store for comprehensive precious metals market intelligence.
Disclaimer: This article is for informational and educational purposes only and does not constitute financial, investment, or trading advice. Past performance is not indicative of future results. Always conduct your own research and consult with a qualified financial advisor before making investment decisions. SilverOfTruth provides market data and analysis tools — it does not provide personalized financial advice.