
Commercial short positions gold data reveals the most sophisticated market participants' true intentions—but deciphering bank hedging strategies requires understanding the intricate dynamics behind these massive positions. With commercials currently holding 286,476 short contracts in gold (70.8% of open interest) and 79,458 in silver (59.5% of OI), their positioning offers crucial insights into precious metals direction.
Unlike speculative traders who chase momentum, commercial hedgers represent the "smart money"—banks, mining companies, and bullion dealers who use futures markets to manage actual physical exposure. Their positioning patterns have historically preceded major market turning points, making commercial short positions one of the most reliable contrarian indicators in precious metals trading.
This comprehensive analysis examines how to interpret commercial hedging behavior, what extreme positioning levels signal, and why understanding bank hedging strategies can transform your precious metals investment approach. We'll decode the mechanics behind commercial shorts, explore historical patterns that predict market reversals, and reveal how today's positioning compares to past inflection points.
Understanding Commercial Hedgers in Precious Metals Markets
Commercial hedgers form the backbone of futures markets, representing entities with actual business exposure to precious metals prices. Unlike speculators who seek profit from price movements, commercials use futures contracts to offset risks from their underlying business operations.
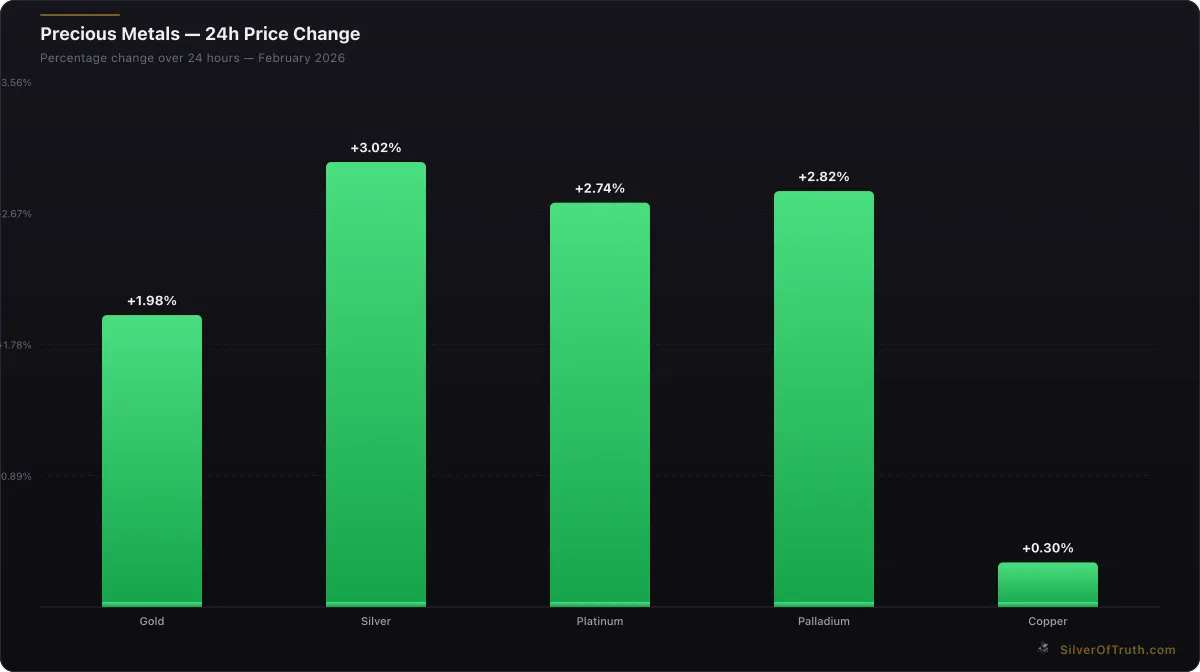
24-hour precious metals price changes. Source: SilverOfTruth, February 2026
Mining Companies constitute the largest segment of commercial shorts. Gold miners like Barrick Gold or Newmont hedge future production by selling futures contracts, locking in prices for metal they'll extract months ahead. When gold trades at $5,063 per ounce, a miner might sell December futures to guarantee profitability regardless of spot price fluctuations. This hedging creates natural short interest that increases as prices rise and mining becomes more profitable to hedge.
Bullion Banks represent another critical commercial category. JPMorgan, HSBC, and other major banks facilitate precious metals trading for institutional clients, often taking the opposite side of speculative positions. When hedge funds buy gold futures aggressively, banks frequently short the market to provide liquidity, then hedge their exposure through physical markets or other derivative instruments.
Refiners and Fabricators use commercial shorts to lock in raw material costs. Electronics manufacturers requiring silver for industrial applications might short silver futures to hedge against price spikes that would increase production costs. Similarly, jewelry manufacturers hedge gold exposure to maintain predictable margins despite volatile spot prices.
The CFTC COT reports classify these participants under "Commercial" positions, distinguishing them from "Non-Commercial" speculators. This distinction proves crucial because commercials' hedging needs create predictable positioning patterns that often conflict with speculative sentiment.
Current positioning shows commercials net short 197,738 gold contracts and 42,163 silver contracts. These massive short positions don't indicate bearishness—they reflect hedging against physical holdings or future production. When commercial shorts reach extreme levels, it typically signals speculative excess rather than fundamental weakness.
The Mechanics of Bank Hedging Gold Operations
Bank hedging gold operations involve sophisticated strategies that extend far beyond simple directional bets. Major bullion banks operate as market makers, providing liquidity while managing complex risk exposures across multiple timeframes and geographic regions.
Flow Trading Dynamics drive much commercial positioning. When institutional clients want to buy 10,000 gold contracts, banks take the short side to facilitate the trade. Rather than holding naked short exposure, banks hedge through various mechanisms: borrowing physical gold, shorting mining stocks, or offsetting positions in London's over-the-counter market. This creates apparent "short" positions that actually reflect balanced books.
Basis Trading represents another key hedging strategy. Banks exploit price differences between futures and physical markets, buying physical gold while simultaneously shorting futures when the basis widens. Current COMEX gold futures trade at slight premiums to spot, encouraging this arbitrage that manifests as commercial short interest in COT data.
Cross-Hedging Operations complicate positioning analysis further. Banks might short gold futures to hedge silver exposure, or use precious metals derivatives to offset currency risks. A bank with large EUR/USD exposure might short gold futures as a dollar-strength hedge, creating precious metals positions unrelated to metals market views.
Understanding swap dealers provides additional insight into bank hedging operations. Current data shows swap dealers net short 179,293 gold contracts (44.3% of commercial shorts), indicating substantial derivative-related hedging. These positions often reflect structured products sold to clients—when banks sell gold-linked notes to investors, they hedge by shorting futures.
The concentration data reveals the sophistication of commercial operations. The top 4 commercial shorts control 33.8% of total short interest, while top 8 hold 52.7%. This concentration suggests major banks dominate commercial positioning, using their capital and infrastructure advantages to provide market liquidity while managing risks through complex hedging strategies.
For investors, recognizing these mechanics prevents misinterpreting commercial shorts as bearish signals. Instead, extreme commercial short positioning often indicates speculative excess that banks are hedging against, creating contrarian opportunities when positioning reaches historical extremes.
Historical Patterns: When Commercial Shorts Signal Reversals
Commercial short positions gold have demonstrated remarkable predictive power at major market inflection points throughout precious metals history. Analyzing patterns from past cycles reveals how extreme commercial positioning precedes significant price reversals, offering valuable timing insights for investors.
The 2011 Gold Peak provides a classic example of commercial positioning as a contrarian indicator. As gold approached $1,900 per ounce, commercial shorts reached extreme levels above 300,000 contracts net short—similar to today's elevated positioning. Speculators held record net long positions while commercials warned of speculative excess through their unprecedented hedging. The subsequent correction to $1,200 validated commercial positioning as smart money.
Silver's 2011 Parabolic Rise demonstrated even more dramatic commercial hedging. Commercial shorts in silver exceeded 60,000 contracts net short as prices rocketed toward $50 per ounce. Mining companies and industrial users hedged aggressively against unsustainable price levels, while speculators chased momentum. The collapse from $50 to $26 within months proved commercials' timing prescient.
2008 Financial Crisis Patterns revealed commercials' defensive positioning ahead of major corrections. Throughout 2008's first half, commercial shorts remained elevated even as gold declined from $1,000 to $700. Their persistent hedging against speculative positioning anticipated the eventual rally to new highs above $1,200 by 2009.
The 2016-2020 Bull Market showcased commercial adaptation to changing dynamics. As gold began its ascent from $1,200, commercial shorts initially increased, hedging against early speculation. However, as fundamentals strengthened (negative real rates, QE programs), commercials gradually covered shorts, reducing net short positions from 280,000+ to under 200,000 contracts. This covering phase coincided with gold's rise to $2,070.
Current positioning of 197,738 contracts net short sits at historically significant levels, though not at the extreme readings that marked 2011 peaks. Historical analysis suggests major reversals occur when commercial shorts exceed 250,000 contracts combined with speculator net longs above 200,000—conditions not yet reached but worth monitoring.
The key insight from historical patterns is timing. Commercial positioning provides early warning signals but can remain extreme for months before reversals materialize. Successful application requires patience and confirmation from other technical or fundamental indicators rather than immediate position changes based solely on COT data.
Our complete guide to COT positioning signals explores these historical patterns in greater detail, including specific threshold levels that have marked major turning points across different market cycles.
Decoding Current Commercial Positioning in Gold and Silver
Current commercial positioning reveals sophisticated hedging strategies amid complex market dynamics, with commercial short positions gold providing crucial insights into institutional sentiment and potential market direction. Let's dissect the latest CFTC data to understand what commercial hedgers see that retail investors might miss.
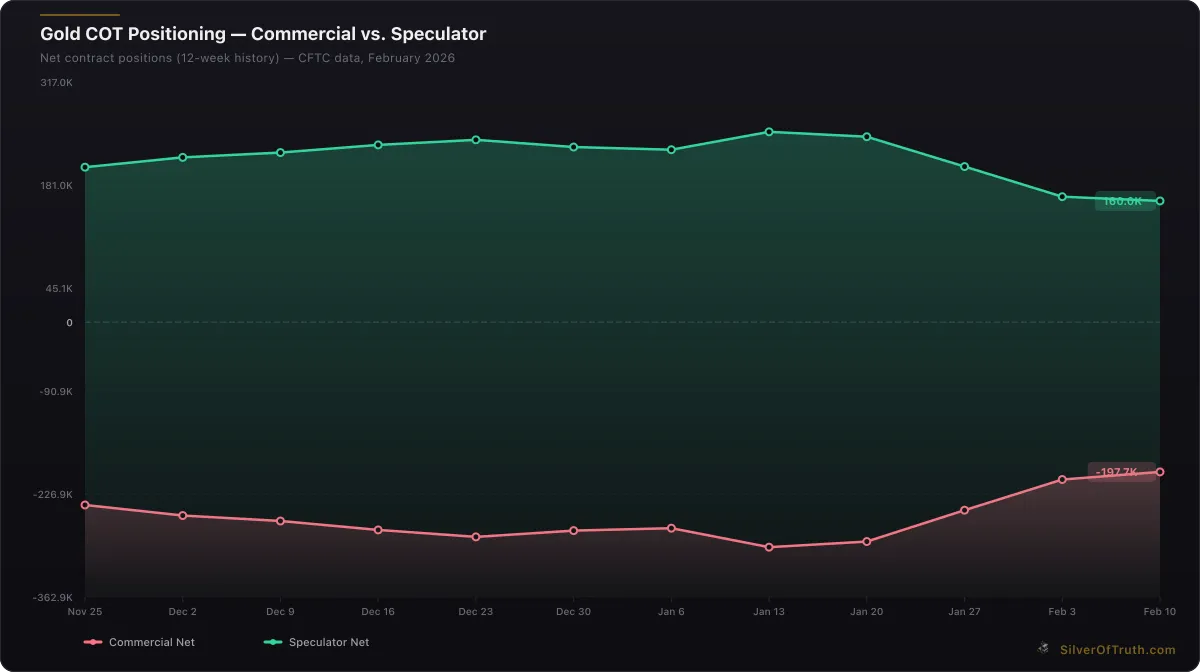
Gold COT positioning: commercial hedgers (red) vs. speculators (green). Source: CFTC via SilverOfTruth, February 2026
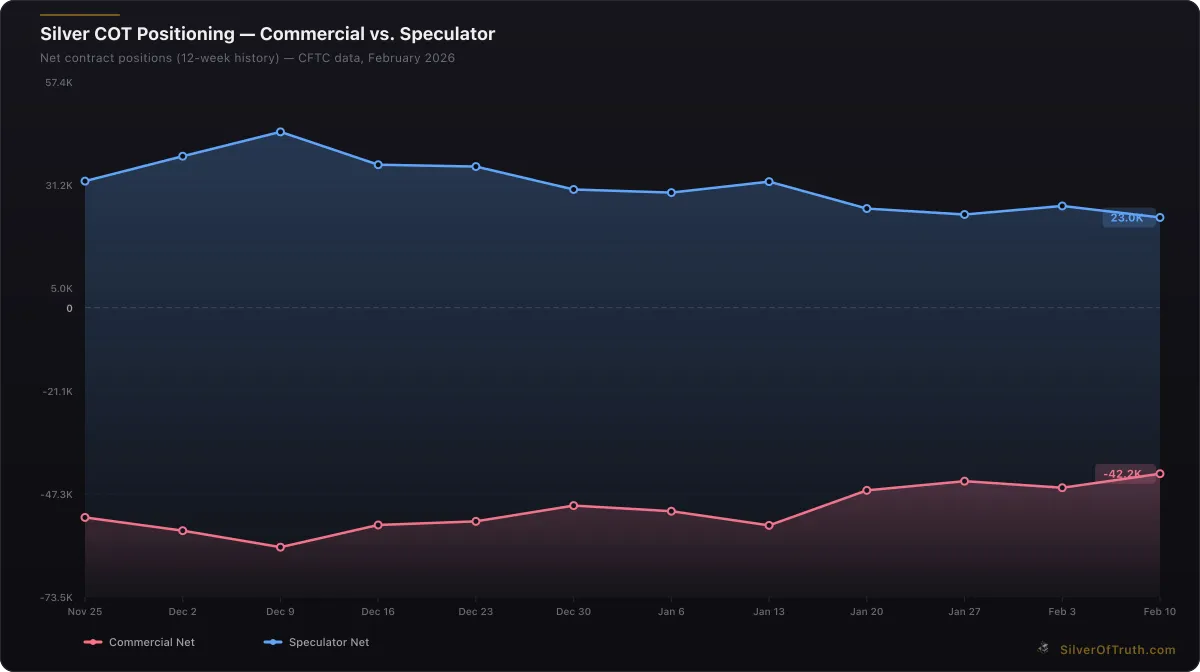
Silver COT positioning: commercial hedgers (red) vs. speculators (blue). Source: CFTC via SilverOfTruth, February 2026
Gold Commercial Analysis shows commercials holding 88,738 long contracts versus 286,476 shorts, creating a net short position of 197,738 contracts. This represents 70.8% of total open interest in short positions—a substantial but not extreme level historically. The weekly change reveals commercials reduced shorts by 9,266 contracts while adding 774 longs, improving their net position by 10,040 contracts. This covering suggests commercial hedgers view current levels as less risky than previous weeks.
Silver Commercial Dynamics present a different picture with 37,295 long contracts and 79,458 shorts, netting 42,163 contracts short (59.5% of OI). Commercials added 2,047 longs while reducing shorts by 1,515 contracts, improving their net position by 3,562 contracts. This simultaneous buying and covering indicates more balanced commercial sentiment in silver compared to gold's historically elevated short interest.
Swap Dealer Positioning provides additional insight into bank hedging operations. In gold, swap dealers hold 43,244 longs against 222,537 shorts (net short 179,293 contracts), representing 44.3% of total commercial shorts. Silver swap dealers show 21,652 longs versus 47,025 shorts (net short 25,373), comprising 60.2% of commercial silver shorts. These massive positions reflect structured product hedging and client flow accommodation rather than directional market views.
Producer-Merchant Activity remains minimal in both markets, with zero reported positions. This absence suggests mining companies either hedge through other venues or maintain minimal futures hedging currently. Given elevated precious metals prices, this limited producer hedging could indicate confidence in sustained higher prices or alternative hedging strategies.
Comparing current positioning to recent patterns from our COT report analysis for gold, commercials' net short position has moderated from more extreme levels seen in late 2025. The 10,040 contract improvement in gold positioning suggests commercials view $5,000+ gold as potentially sustainable rather than unsustainably high.
The concentration data reveals significant market control by major players. Top 4 commercial shorts hold 33.8% of all short positions in gold, while top 8 control 52.7%—indicating major banks dominate commercial positioning. This concentration provides both stability (deep pockets to maintain positions) and risk (potential for rapid position changes if market conditions shift).
For investors, current positioning suggests cautious optimism from commercial hedgers. While still net short, the recent covering indicates reduced fear of immediate corrections. However, the elevated absolute levels of commercial shorts maintain contrarian warning signals should speculative positioning become more extreme.
What Bank Hedging Reveals About Market Direction
Bank hedging patterns provide unprecedented insight into institutional market expectations, with commercial short positions gold serving as a sophisticated early warning system for major price movements. Understanding what drives bank hedging decisions reveals the institutional perspective often missing from retail market analysis.
Hedging Intensity Analysis examines the relationship between commercial positioning and price volatility. Current commercial shorts of 197,738 gold contracts and 42,163 silver contracts reflect moderate hedging intensity—significant enough to indicate institutional caution but not at panic levels. Historical analysis shows hedging intensity peaks before major corrections, as banks position defensively against speculative excess. The recent 10,040 contract improvement in gold commercial positioning suggests reduced hedging urgency, implying banks view current price levels as more sustainable.
Flow-Based Positioning Signals reveal institutional order flow through commercial hedging patterns. When commercials rapidly increase shorts, it typically reflects heavy speculative buying that banks hedge against. Conversely, commercial covering often precedes or accompanies speculative selling. Current data shows moderate commercial covering in both metals, suggesting institutional flow has turned slightly more supportive despite elevated absolute positioning levels.
Regional Arbitrage Hedging provides additional market direction clues through cross-market positioning. Banks hedge regional price differences between COMEX, London, and Shanghai markets, with their positioning reflecting expected arbitrage convergence or divergence. Current Shanghai gold premiums around $0.85 per ounce above London spot create arbitrage opportunities that banks hedge through COMEX futures, contributing to commercial short positioning while indicating Eastern demand strength.
Volatility Hedging Strategies influence commercial positioning as banks adjust exposure based on expected volatility. During low volatility periods, banks can maintain larger positions with acceptable risk. As volatility increases, they typically reduce exposure or increase hedging. Current commercial positioning occurs amid moderate volatility, suggesting banks expect continued range-bound trading rather than explosive moves in either direction.
The key insight from bank hedging analysis lies in understanding their dual role as liquidity providers and risk managers. Banks don't position based on price predictions but rather on client flows, risk management requirements, and arbitrage opportunities. When commercial shorts reach extreme levels, it indicates speculative excess that banks hedge against, creating contrarian signals.
Recent commercial behavior suggests institutional comfort with current precious metals price levels. The covering of shorts in both gold and silver indicates reduced hedging urgency, while still-elevated absolute positions maintain cautionary signals against speculative excess. This positioning profile typically occurs during consolidation phases rather than before major directional moves.
For traders and investors, current bank hedging patterns suggest:
- Near-term direction: Neutral to slightly positive, given recent commercial covering
- Medium-term outlook: Range-bound trading with upside bias if commercial covering continues
- Risk management: Elevated commercial shorts provide downside protection signals if speculation becomes excessive
Understanding these institutional hedging dynamics through resources like our managed money positioning analysis helps investors align with rather than fight institutional flows.
Trading Strategies Based on Commercial Short Analysis
Commercial short positions gold analysis provides actionable trading insights when properly interpreted within broader market context. Successful implementation requires understanding timing, confirmation signals, and risk management principles that leverage commercial positioning as a contrarian indicator rather than a timing device.
Contrarian Entry Strategies focus on extreme commercial positioning as reversal signals. Historical analysis shows optimal entry points occur when commercial shorts exceed 250,000 contracts in gold or 60,000 in silver, combined with speculative net longs reaching similarly extreme levels. Current positioning of 197,738 gold shorts approaches but hasn't reached these extremes, suggesting patience rather than immediate contrarian positions.
Trend Confirmation Approaches use commercial positioning to validate existing trends rather than predict reversals. When commercial shorts decrease during uptrends, it confirms institutional acceptance of higher prices. Current 10,040 contract improvement in gold commercial positioning supports bullish trend continuation, while elevated absolute levels maintain caution against excessive speculation.
Risk Management Integration incorporates commercial positioning into broader risk frameworks. Extreme commercial shorts provide natural stop-loss guidance—when commercials begin aggressive covering after extreme positioning, it often signals trend exhaustion. Conversely, continued commercial short accumulation during rallies suggests underlying resistance that could cap advances.
Sector Rotation Insights emerge from relative commercial positioning between metals. Current silver commercial shorts at 59.5% of open interest versus gold at 70.8% suggest institutional preference for silver over gold—potentially indicating relative value opportunities. This positioning dynamic, combined with silver's higher industrial demand, creates strategic allocation considerations.
Timing Optimization Techniques require patience and confirmation signals beyond COT data alone. Commercial positioning provides directional bias but poor short-term timing. Successful strategies combine extreme commercial positioning with:
- Technical confirmation (key support/resistance breaks)
- Fundamental catalysts (Fed policy shifts, inflation data)
- Sentiment extremes (VIX spikes, retail capitulation)
Position Sizing Based on COT Extremes adjusts risk allocation based on commercial positioning intensity. During extreme commercial short periods, larger contrarian positions become justified given historical reversal probability. Current moderate extreme levels suggest standard position sizing rather than aggressive contrarian bets.
The most effective approach combines commercial short analysis with comprehensive market assessment. Our silver COT report analysis demonstrates how to integrate positioning data with technical and fundamental factors for improved trading outcomes.
Implementation Framework:
- Identify Extremes: Monitor commercial positioning relative to historical ranges
- Wait for Confirmation: Require additional signals before major position changes
- Manage Risk: Use commercial covering as potential exit signals
- Stay Patient: COT-based strategies require extended time horizons
Current commercial positioning suggests cautious optimism with continued vigilance for extremes that would trigger more aggressive contrarian strategies.
Comparing Commercial vs Speculative Positioning Dynamics
The relationship between commercial short positions gold and speculative positioning reveals the fundamental tension that drives precious metals markets. Understanding how these two groups interact provides crucial insight into market structure, liquidity dynamics, and potential turning points that purely technical or fundamental analysis might miss.
Current Positioning Contrast shows stark differences between commercial and speculative approaches. Commercials hold net short positions of 197,738 gold contracts (48.9% of total OI) while non-commercials maintain net long positions of 160,012 contracts (39.6% of OI). This 357,750 contract differential represents the core structural imbalance that creates market tension and eventual resolution through price movement or position adjustment.
Managed Money Behavior provides the clearest speculative positioning signal. Managed money (hedge funds) currently holds 119,232 long contracts versus 27,210 shorts in gold, creating a net long position of 92,022 contracts. Their minimal weekly change of just -50 contracts suggests stable speculative sentiment, contrasting with more dynamic commercial positioning changes. This stability indicates speculative conviction in current price levels rather than momentum chasing.
Risk Tolerance Differences manifest through position concentration and volatility response. Commercials maintain large, persistent positions backed by physical business needs or deep capital reserves. Speculators typically adjust positions rapidly based on price momentum or volatility changes. Current data shows managed money maintaining steady positioning despite 2.33% daily gold price volatility, suggesting speculative comfort with current market conditions.
Leverage and Capital Efficiency create different positioning behaviors between groups. Commercials often use futures markets for hedging rather than profit maximization, maintaining positions longer regardless of interim volatility. Speculators focus on capital efficiency and risk-adjusted returns, leading to more frequent position adjustments and concentration in liquid contract months.
The relationship between commercial and speculative positioning often follows predictable patterns:
- Market Tops: Speculative longs reach extremes while commercial shorts peak
- Market Bottoms: Speculative selling exhaustion coincides with commercial covering
- Trending Markets: Gradual convergence as commercials adjust to new price realities
- Range-Bound Markets: Oscillating relationship as both groups trade ranges
Silver Positioning Comparison reveals different dynamics with commercial net shorts of 42,163 contracts versus non-commercial net longs of 22,955 contracts—a much smaller 65,118 contract differential compared to gold's 357,750. This suggests more balanced institutional sentiment in silver, potentially explaining silver's recent outperformance relative to gold.
Historical Perspective shows extreme positioning differentials often precede major market moves. The 2011 precious metals peak featured commercial-speculative positioning gaps exceeding 400,000 contracts in gold, compared to today's 357,750 differential. While elevated, current positioning hasn't reached the extremes that typically mark major turning points.
For practical application, monitor the positioning differential trends rather than absolute levels. Expanding differentials suggest building tension requiring eventual resolution, while contracting differentials indicate market balance and potential range-bound trading.
Our understanding COT reports guide provides deeper insight into interpreting these positioning relationships across different market environments and their predictive value for precious metals direction.
Industry Applications: Mining Companies and Commercial Hedging
Commercial short positions gold analysis extends beyond trading applications to provide crucial insights for mining industry participants, equipment manufacturers, and industrial users who must navigate precious metals price volatility while maintaining operational efficiency and profitability.
Mining Company Hedging Strategies form the foundation of commercial positioning in precious metals futures. Major producers like Barrick Gold, Newmont, and Agnico Eagle use futures markets to lock in prices for future production, managing shareholder expectations while protecting against adverse price movements. Current low producer-merchant positioning (zero reported in recent COT data) suggests mining companies either utilize alternative hedging venues or maintain minimal hedging given favorable price levels.
Hedge Ratio Optimization requires mining companies to balance price protection against participation in potential upside. Traditional hedge ratios of 30-50% of production provide protection while maintaining upside exposure. When commercial shorts reach extreme levels, it often indicates mining sector hedging at unsustainably high price levels, creating potential reversal signals as hedges expire or get rolled forward at lower prices.
Cost Curve Analysis Integration combines commercial positioning with mining cost structures to identify optimal hedging levels. With all-in sustaining costs (AISC) for gold producers averaging $1,200-$1,400 per ounce, current gold prices above $5,000 provide substantial margins that justify reduced hedging intensity. The absence of significant producer-merchant positioning supports this cost curve analysis.
Jewelry and Industrial Hedging Applications represent another commercial category using precious metals futures for risk management. Electronics manufacturers requiring silver for components, dental suppliers using gold and silver, and jewelry manufacturers all use futures markets to hedge input costs. Current commercial positioning reflects this industrial hedging demand alongside mining sector activity.
Supply Chain Risk Management increasingly drives commercial hedging decisions as geopolitical tensions and supply chain disruptions create price volatility beyond traditional market factors. Companies with exposure to precious metals prices use futures markets to provide predictable cost structures regardless of supply chain disruptions affecting physical markets.
Regional Hedging Considerations become crucial for multinational companies dealing with currency exposure alongside precious metals price risk. A Canadian mining company selling gold priced in USD but operating with CAD costs faces dual exposure that commercial hedging can address through both metals futures and currency hedging strategies.
The practical implications for industry participants include:
For Mining Companies:
- Current moderate commercial short levels suggest balanced industry hedging
- Absence of extreme positioning provides flexibility for additional hedging if prices rise further
- Historical patterns suggest patient hedging approaches during stable commercial positioning periods
For Industrial Users:
- Elevated commercial shorts provide downside price protection signals
- Supply chain hedging should consider both futures positioning and physical availability
- Cross-hedging strategies may be necessary given concentrated commercial positioning
For Equipment and Service Providers:
- Commercial positioning trends indicate industry capital allocation patterns
- Extreme commercial hedging often precedes mining sector capital discipline
- Current positioning suggests stable industry outlook supporting equipment demand
Understanding these industry applications helps explain the mechanics behind commercial positioning while providing practical guidance for companies managing precious metals price exposure throughout their operations.
Global Market Integration and Commercial Positioning
Commercial short positions gold reflect not just domestic hedging needs but complex international arbitrage, cross-border flows, and regional market dynamics that increasingly integrate precious metals markets globally. Understanding these international dimensions provides crucial context for interpreting commercial positioning and its implications for market direction.
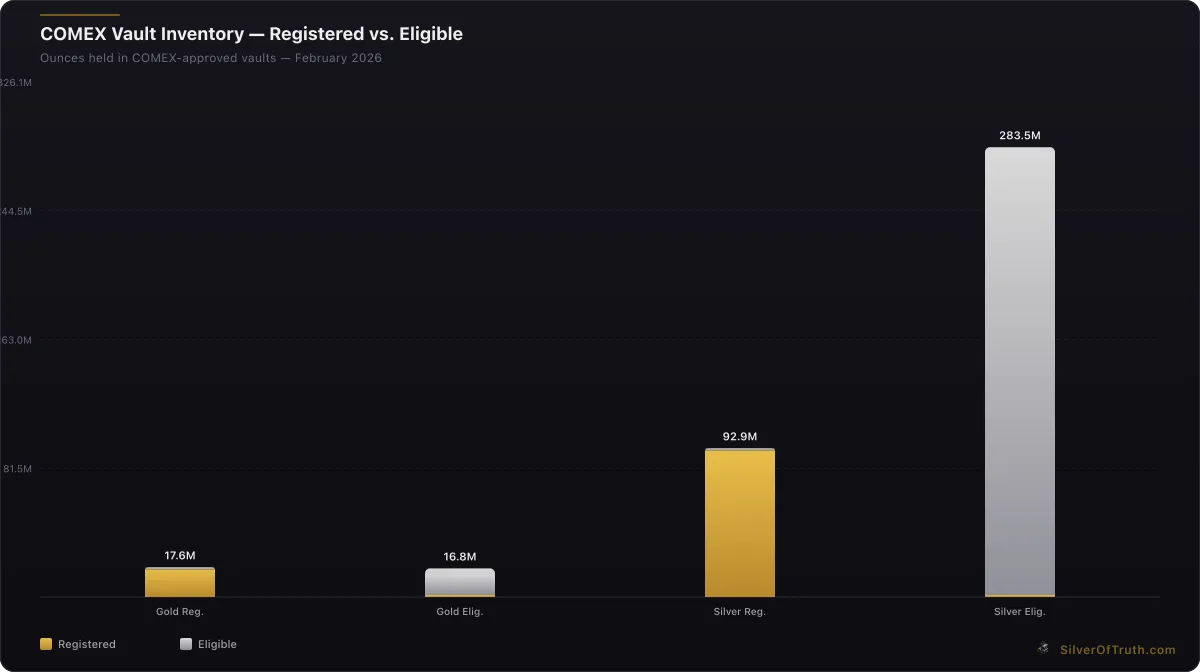
Source: SilverOfTruth COMEX data, February 2026
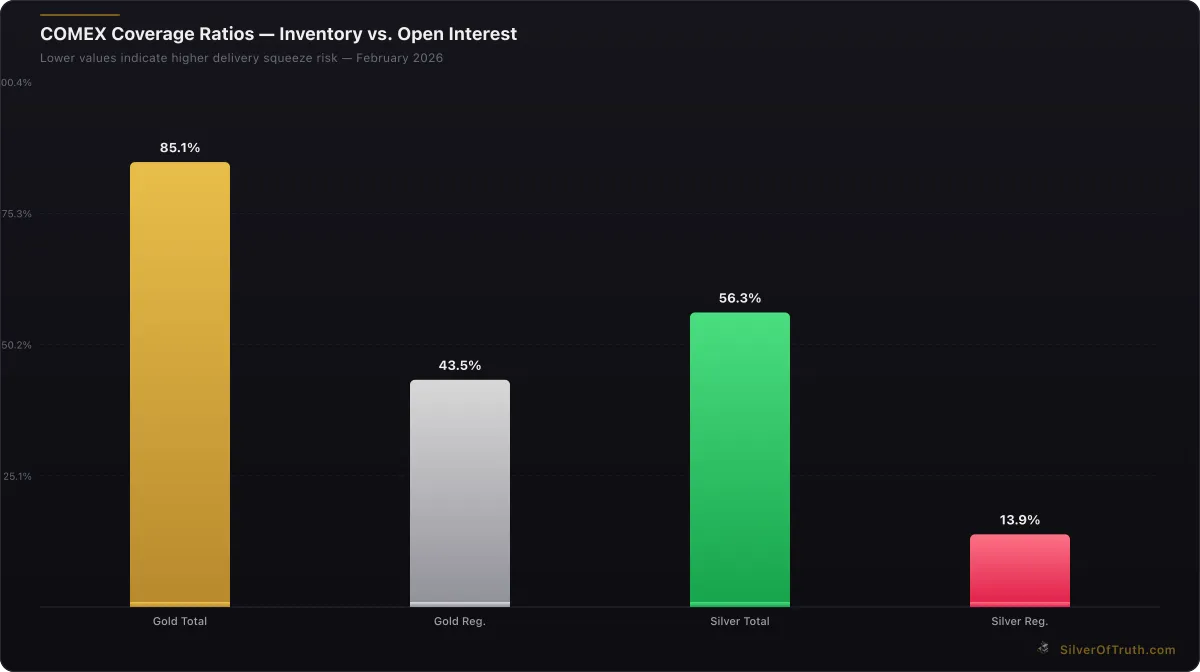
COMEX coverage ratios — lower values indicate higher delivery squeeze risk. Source: SilverOfTruth, February 2026
London-COMEX Arbitrage drives significant commercial positioning as banks exploit price differences between London's over-the-counter market and COMEX futures. Current gold futures premiums to London spot of approximately $2-3 per ounce create profitable arbitrage opportunities where banks buy London gold while selling COMEX futures. This arbitrage activity contributes to commercial short positioning while providing market efficiency and liquidity.
Shanghai Premium Dynamics create additional complexity in commercial hedging strategies. Shanghai Gold Exchange premiums averaging $0.85 per ounce above London spot reflect strong Eastern demand that banks hedge through various mechanisms. Some commercial shorts in COMEX represent hedging against long Shanghai exposure, creating positioning that appears bearish but actually reflects bullish Eastern demand patterns.
Central Bank Activity Integration influences commercial positioning as central banks' gold purchases affect market dynamics globally. Recent central bank buying exceeding 800 tonnes annually creates underlying bid support that commercial hedgers must consider in their positioning strategies. While central banks don't directly participate in COMEX futures, their physical market activity affects the supply-demand balance that commercial hedgers position against.
Currency Hedging Interactions complicate commercial positioning analysis as multinational entities hedge both precious metals exposure and currency risk simultaneously. A European bank with gold exposure might short COMEX futures not just to hedge gold price risk but also to create USD exposure that offsets EUR weakness. These dual-purpose hedging strategies contribute to commercial positioning while serving multiple risk management objectives.
Cross-Border Regulatory Arbitrage affects commercial positioning as different regulatory environments create opportunities and constraints for international participants. Basel III regulations affecting European banks' precious metals activities influence their COMEX positioning strategies, while Chinese capital controls create specific hedging needs for institutions with international precious metals exposure.
Regional Demand Patterns manifest through commercial hedging of international supply chains. Indian jewelry demand seasonality, Chinese New Year buying patterns, and Western investment flows all create predictable hedging needs that contribute to commercial positioning. Understanding these seasonal and cultural factors helps interpret commercial positioning within broader global context.
Time Zone Trading Dynamics affect commercial positioning as banks provide 24-hour precious metals liquidity across Asian, European, and American trading sessions. Commercial shorts often reflect positioning necessary to maintain market making operations across multiple time zones, creating positioning that serves operational needs rather than expressing market views.
Emerging Market Integration increasingly influences commercial positioning as developing economies increase precious metals participation. Countries like India implementing gold monetization schemes or China developing domestic precious metals markets create new flows that commercial hedgers must accommodate through their COMEX positioning strategies.
The practical implications for investors include:
Global Context Understanding: Commercial positioning reflects international dynamics beyond domestic market factors Arbitrage Opportunity Recognition: Extreme positioning often indicates profitable arbitrage that eventually corrects pricing inefficiencies Risk Assessment Enhancement: Global integration means commercial positioning provides signals about worldwide precious metals demand patterns
For comprehensive analysis of these international market dynamics, our global gold market analysis examines how regional factors influence overall market structure and commercial positioning patterns.
Understanding commercial positioning within this global framework provides more nuanced interpretation of market signals and better recognition of opportunities created by international market inefficiencies that commercial hedgers actively exploit.
FAQ: Commercial Short Positions in Precious Metals
What does it mean when commercial shorts are high in gold and silver?
High commercial short positions typically indicate elevated precious metals prices that commercial hedgers view as potentially unsustainable. When commercials reach extreme short levels above 250,000 contracts in gold or 60,000 in silver, it historically signals speculative excess and potential reversal points. Current positioning of 197,738 gold shorts and 42,163 silver shorts represents elevated but not extreme levels. These positions reflect hedging against physical holdings, future production, or client flows rather than bearish market predictions.
How do I know if commercial positioning is extreme enough to signal a reversal?
Extreme commercial positioning requires both absolute levels and relative context. Historical reversal signals occur when: (1) Commercial shorts exceed 80th percentile of historical ranges, (2) Speculative net longs reach similar extremes in opposite direction, (3) Open interest expansion confirms new money entering positions, and (4) Position concentration increases among top traders. Current levels approach but haven't reached these extremes, suggesting monitoring rather than immediate contrarian positioning.
Why do mining companies contribute to commercial short positions?
Mining companies use futures markets to hedge future production against price declines, creating natural short positions that increase as prices rise. When gold trades above $5,000 per ounce, miners hedge 6-18 months of production to guarantee profitability and satisfy lender requirements. However, current COT data shows minimal producer-merchant positioning, indicating mining companies either hedge through other venues, maintain confidence in sustained higher prices, or utilize alternative risk management strategies like streaming agreements or options.
How should investors interpret commercial positioning alongside technical analysis?
Commercial positioning provides fundamental market structure insight that complements technical analysis rather than replacing it. Use commercial extremes to identify potential reversal zones, then wait for technical confirmation through support/resistance breaks, momentum divergences, or volume patterns. Current moderate commercial extremes suggest range-bound trading until positioning reaches more definitive levels or technical patterns provide clearer directional signals.
What's the difference between swap dealers and other commercial categories?
Swap dealers represent banks facilitating client transactions and managing derivative exposure, currently holding 179,293 net short contracts in gold (89% of commercial shorts). Producer-merchants represent actual mining companies hedging production. Swap dealer positioning reflects client flow accommodation and structured product hedging rather than mining industry hedging activity. The dominance of swap dealer shorts indicates bank intermediation rather than producer hedging drives current commercial positioning levels.
Disclaimer: This article is for informational and educational purposes only and does not constitute financial, investment, or trading advice. Past performance is not indicative of future results. Always conduct your own research and consult with a qualified financial advisor before making investment decisions. SilverOfTruth provides market data and analysis tools — it does not provide personalized financial advice.