

Silver's supply and demand fundamentals in 2026 reveal a structural imbalance reshaping the precious metals market, where industrial applications consume record volumes while mine production struggles to keep pace. This comprehensive analysis examines both sides of the equation—from mine production challenges and recycling limitations to explosive growth in emerging technologies and investment flows—providing investors the complete annual picture needed to understand silver's evolving market dynamics. The market has shifted dramatically from equilibrium conditions, creating what industry analysts describe as structural deficit conditions that extend far beyond traditional precious metals investing.
Global Silver Mine Production Analysis
Primary Silver Mine Output
Global silver mine production reached approximately 822.4 million ounces in 2025, marking a marginal 1.2% increase from the previous year according to World Gold Council data. However, 2026 projections suggest production growth will decelerate to just 0.8%, adding roughly 6.6 million ounces to total output.
The modest production increases mask significant regional variations and structural challenges. Mexico remains the world's largest silver producer at 189.5 million ounces annually, followed by Peru at 124.8 million ounces and China at 98.2 million ounces. These three countries account for approximately 50% of global mine supply, creating concentration risks that become critical during geopolitical tensions or operational disruptions.
Primary Silver Mines vs By-Product Production:
| Production Type | 2025 Output (M oz) | 2026 Projection | % of Total | |---|---|---|---| | Primary Silver Mines | 247.2 | 249.8 | 30.4% | | Lead/Zinc By-Product | 328.9 | 331.7 | 40.3% | | Copper By-Product | 164.1 | 165.9 | 20.2% | | Gold By-Product | 82.2 | 83.1 | 10.1% |
The heavy reliance on by-product production creates a unique supply dynamic where silver output depends more on base metal economics than silver prices themselves. When copper or lead/zinc operations become unprofitable, silver production inevitably declines regardless of prevailing silver prices.
Production Cost Pressures
All-in sustaining costs (AISC) for primary silver miners have risen dramatically, averaging $18.40/oz in 2025 compared to $13.20/oz in 2020. Energy costs, labor inflation, and increasingly complex ore bodies drive these increases. Several major silver producers report AISC above $22/oz, making them vulnerable to silver price volatility.
Our guide to evaluating mining stocks explains how these cost pressures affect individual company valuations and production decisions. Higher costs force mine closures, delay expansion projects, and reduce exploration budgets—all factors that constrain future supply growth.
Exploration and Development Pipeline
New silver discovery rates have declined 40% over the past decade, while lead times from discovery to production average 12-15 years. The pipeline of future silver mines appears insufficient to meet projected demand growth, particularly given the capital-intensive nature of modern mining operations and increasingly stringent environmental regulations.
Industrial Silver Demand Drivers
Electronics and Technology Consumption
Industrial silver demand reached 508.7 million ounces in 2025, representing 62% of total silver consumption. The electronics sector alone consumed 241.3 million ounces, driven by smartphone production, electric vehicle components, and renewable energy infrastructure.
5G technology deployment continues expanding silver consumption, with each 5G base station requiring approximately 1.5 ounces of silver compared to 0.3 ounces for 4G infrastructure. Industrial silver demand in electronics shows this trend accelerating through 2026 as carriers complete nationwide 5G rollouts.
Industrial Silver Consumption by Sector (2025):
| Sector | Consumption (M oz) | YoY Growth | 2026 Projection | |---|---|---|---| | Electronics | 241.3 | +8.2% | 260.9 | | Solar Panels | 118.6 | +12.4% | 133.3 | | Automotive | 61.4 | +15.7% | 71.0 | | Medical Devices | 33.2 | +6.1% | 35.2 | | Chemical Catalysts | 24.8 | +3.9% | 25.8 | | Other Industrial | 29.4 | +4.2% | 30.6 |
Solar panel manufacturing represents the fastest-growing industrial application, consuming silver for photovoltaic cell production. Despite ongoing efforts to reduce silver content per panel through thrifting technologies, total consumption continues rising due to massive solar installation growth globally.
Electric Vehicle Revolution
The automotive sector's silver consumption surge reflects the electric vehicle transition more than traditional automotive demand. Each electric vehicle requires 25-50 grams of silver compared to 15-28 grams for internal combustion engines. Battery management systems, charging infrastructure, and power electronics all demand significant silver content.
With global EV sales projected to reach 31.1 million units in 2026 (up from 21.7 million in 2025), automotive silver demand could exceed 75 million ounces annually by 2027. This represents nearly 15% of total industrial consumption concentrated in a single emerging sector.
Medical and Healthcare Applications
Silver's antimicrobial properties drive steady demand growth in medical devices, wound care products, and healthcare infrastructure. The COVID-19 pandemic highlighted silver's role in antimicrobial coatings, spurring development of silver-enhanced surfaces in hospitals, public transportation, and commercial buildings.
Medical silver demand grows at approximately 6-8% annually, supported by aging populations in developed countries and expanding healthcare access in emerging markets. While smaller than electronics consumption, medical applications typically command premium pricing and demonstrate strong demand elasticity.
Investment Demand Dynamics
Physical Silver Investment
Investment demand for physical silver reached 237.8 million ounces in 2025, representing 29% of total silver demand. This category includes silver coins, bars, medallions, and other fabricated investment products purchased by individual investors and institutions.
The U.S. Mint reported American Silver Eagle sales of 24.9 million ounces in 2025, while global coin and bar demand totaled 186.4 million ounces. Investment demand shows strong correlation with inflation expectations, currency debasement concerns, and geopolitical tensions.
Physical Investment Demand Breakdown:
- Silver Coins: 142.6M oz (retail investors, collectors)
- Silver Bars: 43.8M oz (institutional, high-net-worth)
- Medallions/Rounds: 35.2M oz (alternative coins)
- Industrial Stockpiling: 16.2M oz (manufacturers, traders)
Our analysis of silver stacking for beginners shows retail investment demand remains price-sensitive, with sales volumes typically inversely correlated to silver prices. However, sustained periods above $75/oz haven't significantly dampened retail appetite, suggesting evolving investor psychology around silver's monetary role.
ETF and Paper Silver Flows
Exchange-traded fund holdings tell a different story from physical investment. Global silver ETF holdings declined by 18.7 million ounces in 2025, as institutional investors rotated toward higher-yielding assets amid rising interest rates. The largest silver ETF, iShares Silver Trust (SLV), saw outflows of 12.3 million ounces.
This divergence between retail physical buying and institutional paper selling creates interesting market dynamics. Physical vs paper silver explains how ETF outflows can temporarily depress prices despite strong underlying physical demand.
However, paper silver selling appears to be moderating as real interest rates peak and inflation concerns persist. Several large hedge funds have increased silver ETF positions in early 2026, suggesting institutional sentiment may be shifting.
Silver Recycling and Secondary Supply
Recycling Market Overview
Silver recycling contributed approximately 156.8 million ounces to 2025 supply, representing 19% of total silver supply. Unlike gold, which maintains relatively stable recycling rates, silver recycling is highly sensitive to price levels and industrial scrap availability.
The majority of recycled silver comes from industrial waste streams rather than jewelry or investment products. Electronics manufacturing generates substantial silver-bearing waste, but recovery rates vary significantly based on processing costs and silver prices.
Silver Recycling Sources (2025):
| Source Category | Recycled Volume (M oz) | Recovery Rate | |---|---|---| | Electronics Scrap | 67.4 | 65% | | Photography (Legacy) | 23.8 | 85% | | Jewelry/Silverware | 31.2 | 78% | | Industrial Process Waste | 18.9 | 72% | | Medical Equipment | 8.7 | 81% | | Automotive Catalysts | 6.8 | 88% |
Photography remains a significant recycling source despite digital transition, as decades of accumulated photographic waste continues entering recycling streams. However, this legacy supply source is finite and declining approximately 8% annually.
Recycling Economics and Constraints
Silver recycling economics depend heavily on collection costs, processing efficiency, and prevailing silver prices. At current levels above $75/oz, most recycling operations remain profitable, but the distributed nature of silver consumption makes collection challenging compared to gold recycling.
Electronics recycling faces particular challenges due to low silver concentrations (typically 0.1-0.3% by weight) and complex separation processes. Urban mining initiatives show promise but require substantial investment in processing infrastructure and collection networks.
Government and Central Bank Activities
Strategic Stockpile Releases
Government silver stockpiles play a diminished role compared to historical periods when strategic stockpiles contained billions of ounces. Most major economies have largely depleted their silver reserves, with the U.S. Defense Logistics Agency holding minimal strategic stocks.
China maintains the largest government silver reserves, estimated at 41.3 million ounces, though official data remains limited. Russia's central bank continues modest silver purchases as part of dedollarization efforts, accumulating approximately 1.2 million ounces in 2025.
Regulatory and Policy Impacts
Environmental regulations increasingly affect silver mining operations, particularly in jurisdictions with strict water quality and tailings management requirements. The EU's Conflict Minerals Regulation and similar legislation create compliance costs that favor larger, established producers over smaller mining operations.
Carbon taxation and emission reduction mandates add operational costs while simultaneously increasing silver demand through renewable energy applications—creating a complex push-pull dynamic that generally favors higher silver prices over time.
Regional Market Analysis
North American Silver Market
North American silver consumption totaled 198.7 million ounces in 2025, with the United States representing 142.3 million ounces of that total. Industrial consumption dominates at 67% of total demand, driven by aerospace, defense electronics, and renewable energy infrastructure.
Mexico's unique position as both a major producer and growing consumer creates interesting regional flows. Mexican silver consumption increased 11.2% in 2025, primarily driven by industrial expansion and nearshoring manufacturing trends.
North American Silver Balance (2025):
- Production: 204.6M oz (Mexico 189.5M, US 11.8M, Canada 3.3M)
- Consumption: 198.7M oz (US 142.3M, Mexico 38.9M, Canada 17.5M)
- Net Position: +5.9M oz surplus
- Investment Flows: +41.7M oz (heavy US retail buying)
Asian Silver Dynamics
Asia represents the fastest-growing silver market, with consumption increasing 9.8% in 2025 to reach 287.4 million ounces. China leads regional demand at 156.8 million ounces, followed by India at 73.2 million ounces.
Industrial demand drives Asian growth, particularly electronics manufacturing and solar panel production. China's solar industry alone consumed approximately 89.3 million ounces in 2025, representing 76% of global solar silver consumption.
India's silver market shows unique characteristics, with jewelry and decorative applications accounting for 48% of consumption compared to just 12% globally. Cultural preferences and wedding season demand create strong seasonal patterns in Indian silver consumption.
European Silver Market
European silver consumption declined 2.1% in 2025 to 134.6 million ounces, reflecting broader economic challenges and reduced industrial activity. However, green energy initiatives support silver demand growth in specific applications.
Germany leads European consumption at 34.7 million ounces, with automotive and renewable energy sectors driving demand. Brexit created some supply chain disruptions, but impacts appear manageable through alternative sourcing arrangements.
Supply and Demand Balance Projections
2026 Market Balance Forecast
Based on current trends and confirmed project developments, 2026 silver supply and demand projections show a structural deficit of approximately 194.7 million ounces—the largest annual deficit in over two decades.
2026 Silver Supply and Demand Forecast:
| Supply Sources | 2026 Projection (M oz) | |---|---| | Mine Production | 829.0 | | Recycling | 151.2 | | Government Sales | 2.8 | | Total Supply | 983.0 |
| Demand Sources | 2026 Projection (M oz) | |---|---| | Industrial | 556.3 | | Investment | 264.2 | | Jewelry & Silverware | 186.4 | | Technology | 170.8 | | Total Demand | 1,177.7 |
| Net Balance | -194.7 (Deficit) |
This deficit must be met through inventory drawdowns, exchange-traded fund liquidations, or price-driven demand destruction. Current COMEX inventory levels at 376.4 million ounces total (92.9 million registered) could theoretically supply the deficit for approximately 1.9 years, though practical delivery constraints make this unlikely.
Price Implications and Market Response
Sustained deficits of this magnitude typically drive prices higher through inventory depletion and supply chain stress. However, price elasticity varies by application—industrial users show relatively inelastic demand given silver's small cost component in final products, while investment demand can be quite price sensitive.
The current silver price at $77.27/oz already reflects some deficit expectations, but full price discovery may require actual inventory stress or delivery disruptions to manifest. Silver supply deficit implications examines how deficits historically translate into price movements.
At what price levels might demand destruction occur? Electronics applications typically remain economical up to $120/oz silver, while jewelry demand shows significant price sensitivity above $85/oz. Investment demand could actually increase with rising prices if monetary debasement accelerates.
Long-Term Structural Trends
The silver market faces several long-term structural changes that extend well beyond 2026:
Supply-Side Challenges:
- Declining ore grades requiring more energy per ounce extracted
- Limited pipeline of new primary silver mines
- Increasing environmental and regulatory constraints
- By-product dependency on volatile base metals markets
Demand-Side Growth:
- Accelerating energy transition requiring massive solar installations
- Electric vehicle adoption creating new automotive demand
- 5G/6G infrastructure deployment
- Medical and healthcare technology expansion
- Emerging applications in quantum computing and advanced electronics
These structural trends suggest deficits may persist well beyond 2026 unless significant supply responses or demand substitution occurs. However, silver's unique properties make substitution challenging in many applications.
Investment Portfolio Implications
Strategic Silver Allocation
The fundamental supply-demand imbalance creates compelling arguments for strategic silver allocation in investment portfolios. Traditional asset allocation models typically suggest 3-5% precious metals exposure, but structural deficits may justify higher allocations for investors seeking inflation protection and monetary diversification.
Silver stacking strategies range from systematic accumulation programs to opportunistic buying on price weakness. Physical silver ownership provides direct exposure to supply-demand fundamentals without counterparty risks associated with paper silver investments.
However, investors must consider storage costs, insurance requirements, and liquidity constraints when building physical silver positions. Our silver storage options guide explains various approaches to secure silver ownership.
Mining Stock Considerations
Silver mining stocks offer leveraged exposure to silver price movements while providing dividend income and professional management. However, mining operations face operational risks, regulatory challenges, and cost inflation pressures that can significantly impact returns.
Primary silver miners typically show higher correlation to silver prices than by-product producers, who may prioritize base metal operations over silver production. Evaluating mining stocks requires analyzing production costs, reserve quality, and management effectiveness.
Geographic diversification across mining jurisdictions helps mitigate political and regulatory risks, while company size considerations balance growth potential against operational stability.
Technology and Innovation Impacts
Silver Demand from Emerging Technologies
Emerging technologies continue discovering new applications for silver's unique properties. Quantum computing research utilizes silver's superconductivity characteristics, while advanced battery technologies incorporate silver for improved conductivity and cycle life.
Nanotechnology applications, including silver nanoparticles for medical and industrial uses, represent potentially significant demand growth areas. However, these applications typically require minimal silver quantities compared to traditional industrial uses.
Supply-Side Innovation
Technological advancement in silver extraction and processing could partially offset supply constraints. Improved flotation techniques, heap leaching optimization, and more efficient recovery from electronic waste streams all contribute to supply-side innovation.
However, the distributed nature of silver consumption makes recovery challenging compared to gold, which concentrates in easily identifiable applications. Electronics recycling improvements show the most promise for meaningful supply additions.
Risk Factors and Considerations
Supply Disruption Risks
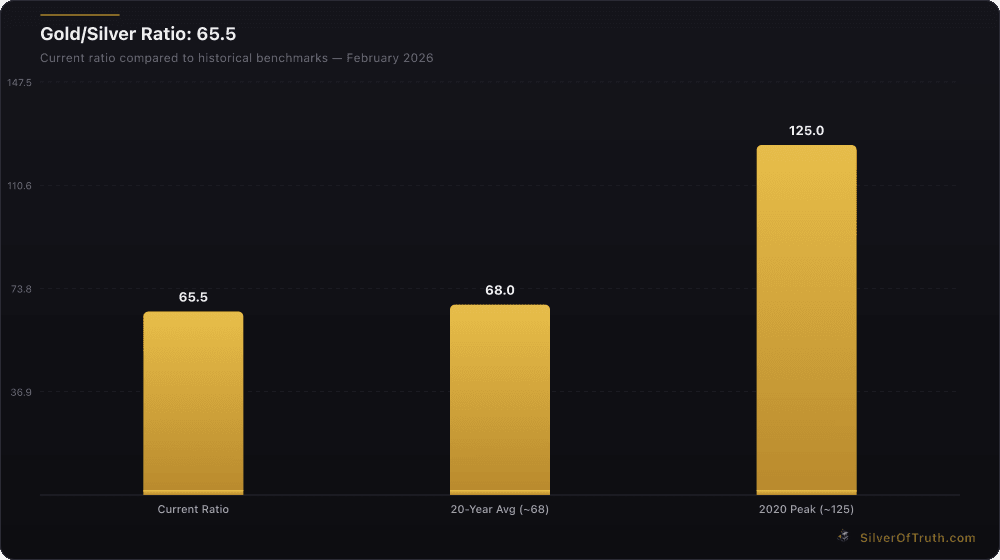
Gold/Silver Ratio at 65.5 — below the 20-year average suggests silver may be undervalued. Source: SilverOfTruth, February 2026
Silver supply faces various disruption risks that could exacerbate existing deficits:
Geopolitical Risks: Major producing countries include Mexico, Peru, and Chile—all facing varying degrees of political uncertainty and resource nationalism pressures.
Environmental Challenges: Water scarcity, tailings management, and emission regulations increasingly constrain mining operations, particularly in water-stressed regions.
Labor Disruptions: Mining operations are vulnerable to labor strikes and wage inflation, with several major silver mines experiencing work stoppages in 2025.
Infrastructure Constraints: Power grid reliability, transportation networks, and processing facility capacity all affect silver supply chains.
Demand Volatility Factors
While industrial demand shows relative stability, several factors could affect silver consumption:
Economic Recession Risk: Prolonged economic weakness could reduce industrial silver demand, though renewable energy investments may prove countercyclical.
Technological Substitution: Ongoing research seeks alternatives to silver in various applications, though current substitutes typically offer inferior performance.
Interest Rate Environment: Rising real interest rates reduce precious metals investment appeal, though inflation concerns provide offsetting support.
Currency Fluctuations: Dollar strength typically pressures commodity prices, while dollar weakness supports silver in international markets.
Market Monitoring and Data Sources
Key Indicators to Track
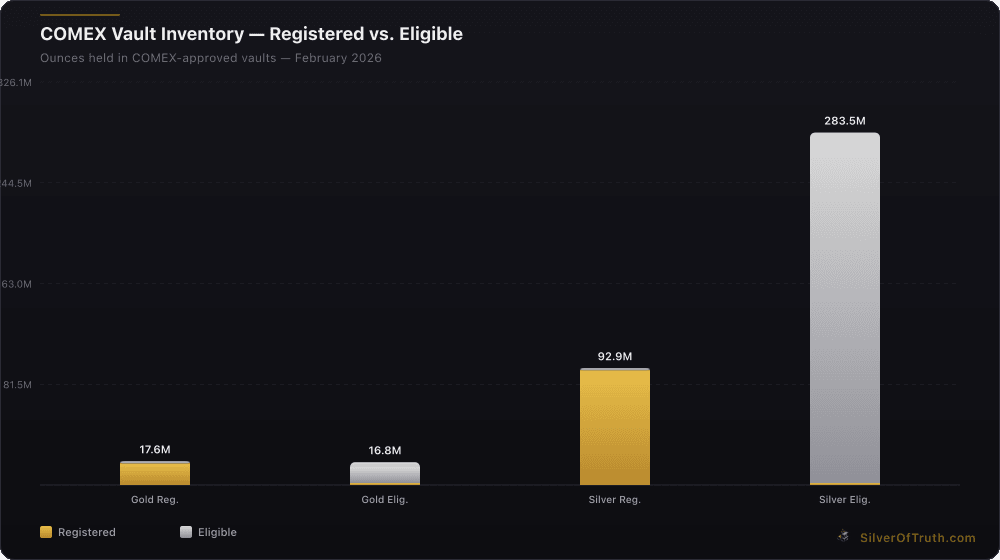
Source: SilverOfTruth COMEX data, February 2026
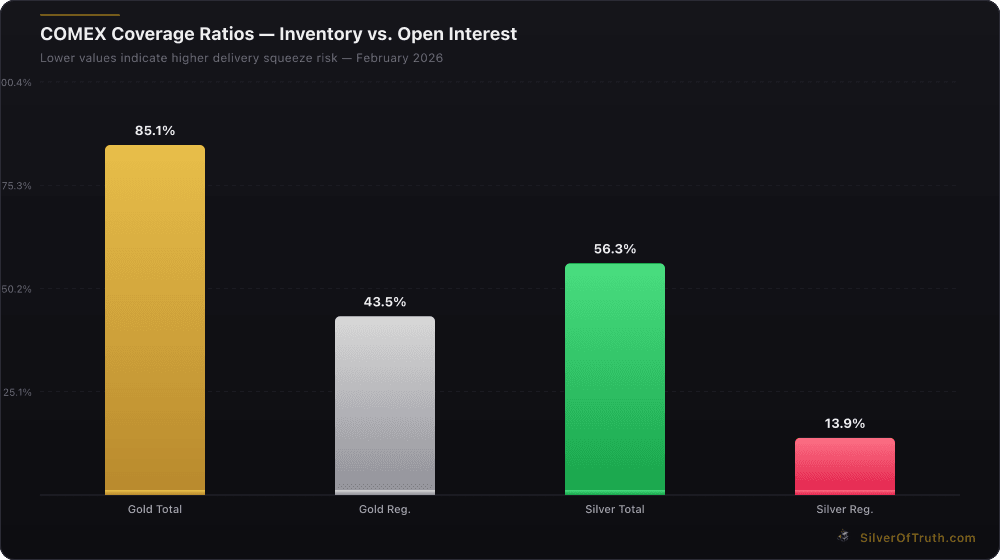
COMEX coverage ratios — lower values indicate higher delivery squeeze risk. Source: SilverOfTruth, February 2026
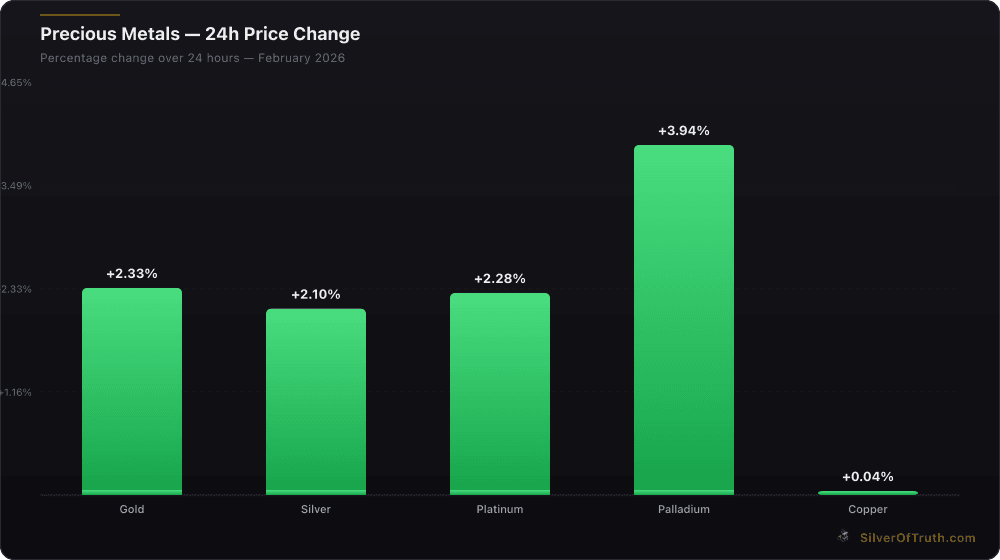
24-hour precious metals price changes. Source: SilverOfTruth, February 2026
Investors monitoring silver supply and demand should focus on several key indicators:
Supply Indicators:
- Monthly COMEX inventory reports via CME Group
- Mine production data from major producers
- Recycling volume estimates from industry associations
- Government stockpile release announcements
Demand Indicators:
- Electronics production data from semiconductor associations
- Solar panel installation statistics from renewable energy agencies
- EV sales data from automotive industry sources
- ETF holding changes and investment flows
Leading Indicators:
- Industrial metals demand (copper, lead/zinc) affecting by-product silver
- Technology sector capital expenditure trends
- Renewable energy policy announcements
- Central bank monetary policy shifts
Analytical Framework
Successful silver market analysis requires integrating multiple data sources and understanding lead-lag relationships between different market segments. Industrial demand changes typically appear with 3-6 month delays, while investment flows can shift rapidly based on sentiment and technical factors.
Understanding silver's unique position as both a precious metal and industrial commodity creates analytical complexity but also investment opportunity. The SilverOfTruth app provides real-time monitoring of key silver market indicators for investors tracking these evolving dynamics.
FAQ Section
What is driving the silver supply deficit in 2026? The 2026 silver deficit stems from stagnant mine production growth (+0.8%) while industrial demand expands rapidly (+9.4%), primarily driven by solar panel manufacturing, electric vehicle production, and 5G infrastructure deployment. Limited new mine development and declining recycling from legacy sources exacerbate supply constraints.
How does silver's industrial demand compare to its investment demand? Industrial applications consume approximately 62% of annual silver supply (556M oz projected for 2026) compared to investment demand at 22% (264M oz). This industrial dominance creates relatively inelastic demand, as silver represents a small cost component in final products like electronics and solar panels.
Can recycling fill the silver supply gap? Current silver recycling contributes 151M oz annually (15% of supply) but faces collection and processing constraints. While recycling rates could improve with higher prices, the distributed nature of silver consumption makes comprehensive recovery challenging compared to gold recycling.
What silver price level would trigger demand destruction? Price sensitivity varies by application. Electronics and industrial users typically remain economical up to $120/oz given silver's small cost share. Jewelry demand shows elasticity above $85/oz, while investment demand may actually increase with higher prices during monetary uncertainty periods.
How do government policies affect silver supply and demand? Environmental regulations increase mining costs while simultaneously boosting silver demand through renewable energy mandates. Trade policies, carbon taxation, and strategic stockpile decisions all influence silver flows, though government holdings are much smaller than historical levels.
Disclaimer: This article is for informational and educational purposes only and does not constitute financial, investment, or trading advice. Past performance is not indicative of future results. Always conduct your own research and consult with a qualified financial advisor before making investment decisions. SilverOfTruth provides market data and analysis tools — it does not provide personalized financial advice.