
Gold price forecasting for 2026 requires navigating an increasingly complex web of monetary policy shifts, geopolitical tensions, and evolving market dynamics that could drive significant price movements in either direction. This comprehensive analysis examines expert predictions from major financial institutions, breaks down the key factors likely to influence gold's trajectory, and provides strategic insights for investors seeking to position themselves effectively in the precious metals market. Understanding where gold prices are headed involves analyzing Federal Reserve policy decisions, global inflation trends, central bank buying patterns, and technical market signals that collectively shape the yellow metal's performance.
Major Bank Gold Price Predictions for 2026
Leading financial institutions have released their gold price forecasts for 2026, with predictions varying significantly based on different macroeconomic scenarios and risk assessments.
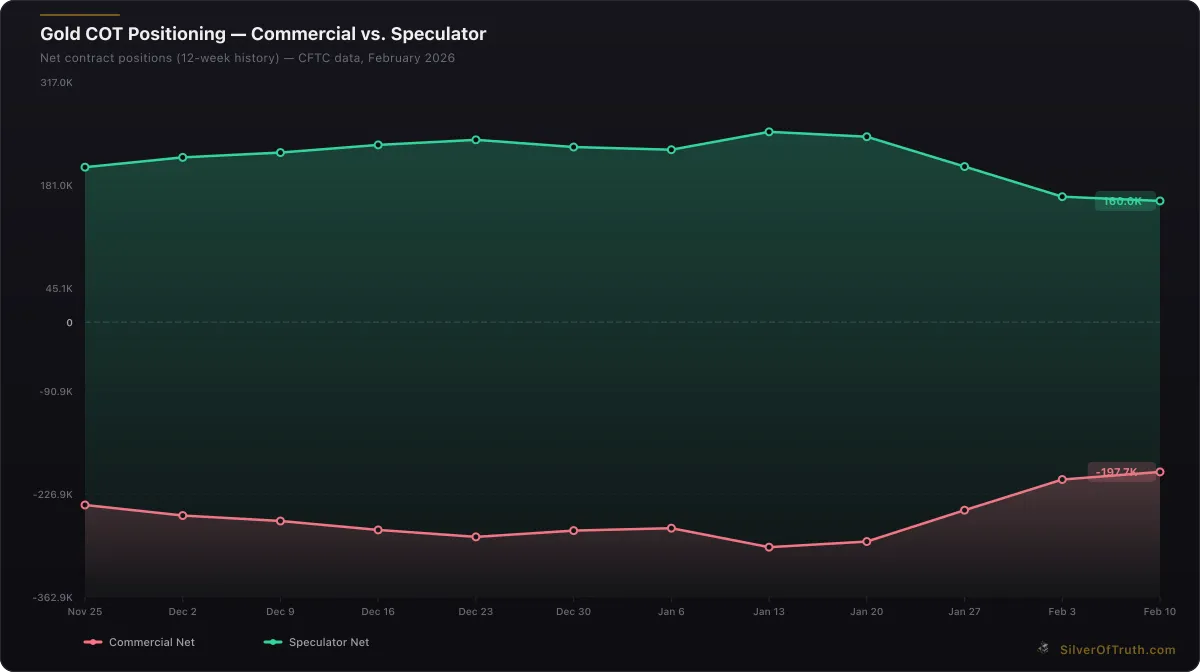
Gold COT positioning: commercial hedgers (red) vs. speculators (green). Source: CFTC via SilverOfTruth, February 2026
Goldman Sachs projects gold reaching $5,500-$5,800 per ounce by year-end 2026, citing persistent inflation concerns and central bank diversification away from dollar-denominated assets. Their analysis emphasizes de-dollarization trends as emerging economies build gold reserves to reduce dependency on the U.S. dollar. Goldman's commodity team specifically highlights how ongoing geopolitical tensions in Eastern Europe and the Middle East continue supporting safe-haven demand.
JPMorgan Chase offers a more conservative outlook, targeting $4,800-$5,200 per ounce, assuming the Federal Reserve successfully manages inflation without triggering recession. Their forecast incorporates expectations of gradual interest rate normalization and improved economic stability in the second half of 2026. JPMorgan's precious metals analysts note that gold's performance versus stocks will largely depend on whether equity markets maintain their current valuations.
Bank of America presents the most bullish case, with price targets of $6,000-$6,500 per ounce, driven by their "structural bull market" thesis. BofA emphasizes supply constraints, robust physical demand from Asia, and what they term "monetary debasement fears" as key drivers. Their research highlights how institutional investors are increasingly viewing gold as portfolio insurance against currency debasement and fiscal irresponsibility.
Citigroup projects a range of $5,000-$5,400, emphasizing downside risks from potential Federal Reserve hawkishness. Citi's commodities team warns that aggressive rate hikes to combat inflation could pressure gold prices in the near term, though they maintain a positive medium-term outlook based on fundamental supply-demand dynamics.
Federal Reserve Policy Impact on Gold Prices
The Federal Reserve's monetary policy decisions represent the single most important driver of gold prices in 2026. Current market dynamics show gold benefiting from expectations of eventual policy pivots, even as real interest rates remain elevated.
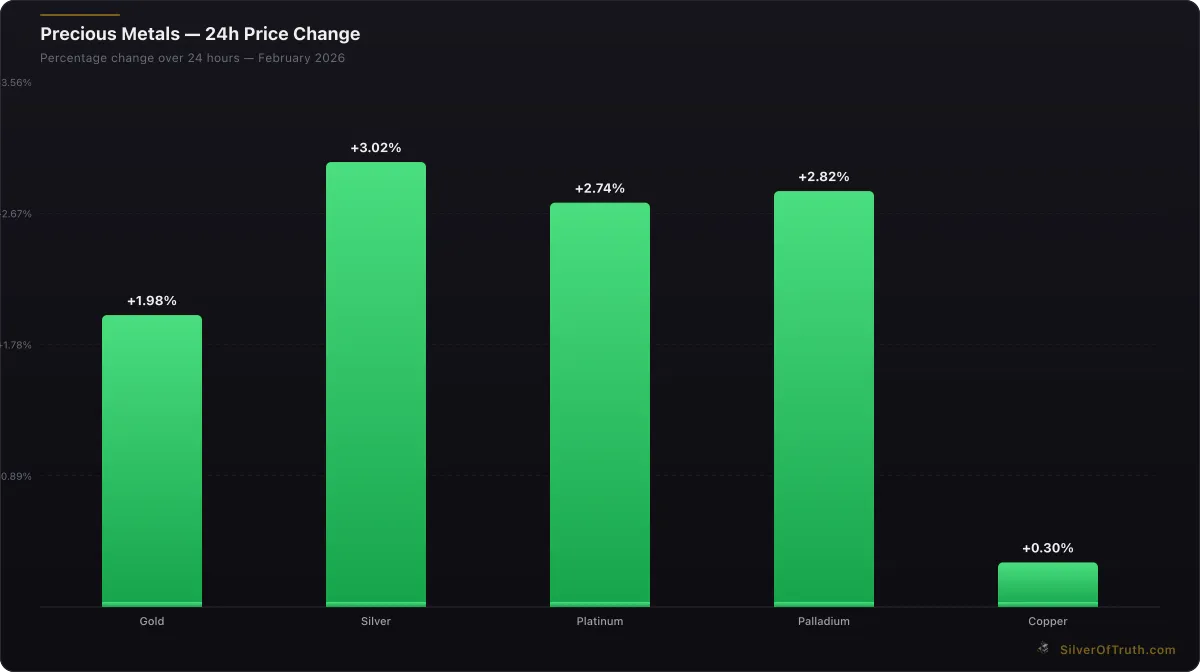
24-hour precious metals price changes. Source: SilverOfTruth, February 2026
Interest Rate Trajectory Analysis
With the federal funds rate currently in restrictive territory, gold's performance hinges on when and how quickly the Fed begins cutting rates. Historical analysis reveals gold typically performs best during periods of falling real interest rates—when nominal rates decline faster than inflation expectations. The precious metal has demonstrated particular strength when real yields (10-year Treasury yield minus inflation expectations) turn negative.
Market participants are closely watching Federal Reserve communications for signals about the "terminal rate"—the peak of the current tightening cycle. Each FOMC meeting and Fed governor speech is parsed for clues about policy durability versus flexibility. Understanding gold's relationship with inflation hedging becomes crucial as investors position for various Fed scenarios.
Quantitative Easing Possibilities
Should economic conditions deteriorate significantly, renewed quantitative easing (QE) programs could dramatically boost gold prices. Historical precedent from 2008-2012 and 2020-2021 demonstrates gold's powerful response to money supply expansion. Bank of America's analysts specifically cite this "QE put" as justification for their bullish price targets, arguing that fiscal constraints and debt burdens limit the Fed's ability to maintain tight policy indefinitely.
Global Economic Factors Driving Gold Demand
Beyond U.S. monetary policy, several global factors are shaping gold's 2026 outlook, creating both opportunities and risks for precious metals investors.
Central Bank Gold Purchasing Trends
Central bank gold buying reached record levels in 2025, with purchases exceeding 1,000 tons according to the World Gold Council. This trend shows little sign of abating in 2026, driven by several factors:
China's People's Bank continues expanding gold reserves as part of broader currency diversification efforts. Recent data suggests Chinese gold holdings have increased for 15 consecutive months, with no indication of slowing pace. Russia, despite sanctions constraints, maintains focus on gold accumulation through domestic mining output. Emerging market central banks from Turkey to India view gold as insurance against currency volatility and geopolitical risks.
Geopolitical Risk Premiums
Ongoing conflicts and tensions continue supporting gold's safe-haven premium. The Russia-Ukraine conflict, Middle East instability, and U.S.-China trade relations all contribute to elevated risk appetites. Geopolitical analysts note that unlike previous decades, current conflicts involve major commodity-producing regions, amplifying market impacts and sustaining risk premiums.
Asian Physical Demand Dynamics
Asian markets, particularly China and India, remain crucial demand drivers. Chinese New Year purchases, Indian wedding seasons, and broader wealth accumulation in emerging economies provide fundamental demand support. Shanghai Gold Exchange data shows consistent premiums to London spot prices, indicating strong regional demand that supports global price floors.
Technical Analysis and Price Targets
From a technical perspective, gold's 2026 outlook presents both opportunities and challenges, with key support and resistance levels defining potential trading ranges.
Chart Pattern Analysis
Gold's long-term weekly chart displays a massive ascending triangle formation dating back to 2020, with the upper resistance trend line around $5,200-$5,300 representing a critical breakout level. Successful breach of this resistance could target $5,800-$6,200 based on measured move calculations and Fibonacci extensions.
The 200-week moving average at approximately $4,400 provides major support, having successfully held during recent corrections. This level represents the dividing line between longer-term bull and bear scenarios. Technical analysts emphasize that sustained breaks below this support would signal significant trend change.
Momentum Indicators
Relative Strength Index (RSI) on monthly charts shows gold approaching overbought territory but not yet at extreme levels that preceded major corrections in 2011 and 1980. MACD indicators remain positive but are showing some convergence, suggesting momentum may be slowing without necessarily reversing.
Volume Analysis
Exchange-traded fund flows and futures positioning provide insights into institutional sentiment. Recent CFTC COT report data shows speculative net long positions at elevated but not extreme levels, with room for further accumulation before reaching historically stretched readings.
Supply-Side Constraints Supporting Higher Prices
Gold's supply dynamics present compelling arguments for higher prices, with mining industry challenges and declining ore grades creating structural headwinds.
Mining Production Challenges
Global gold mine production has plateaued in recent years despite higher prices, reflecting industry-wide challenges including resource depletion, regulatory constraints, and rising All-in Sustaining Costs (AISC). Major mining companies report AISC levels averaging $1,400-$1,600 per ounce, providing fundamental price support.
Exploration budgets remain constrained relative to historical levels, with few major discoveries in recent years. The pipeline of development projects shows a concerning gap, particularly for large-scale, low-cost deposits. This supply constraint becomes more pronounced as existing mines face declining ore grades and increased extraction costs.
Recycling and Scrap Supply
Secondary supply from recycling typically increases during periods of high prices, providing natural price stability. However, 2025 data suggests scrap supply responses have been muted compared to previous cycles, possibly due to changing ownership patterns and increased long-term holding by both institutional and retail investors.
Investment Strategies for Gold in 2026
Given the complex interplay of factors affecting gold prices, investors should consider multiple approaches to precious metals exposure while managing risk appropriately.
Physical Gold Allocation Strategies
For those seeking direct metal ownership, starting a silver stacking program provides insights applicable to gold accumulation. Physical gold ownership offers the purest exposure but requires consideration of storage, insurance, and liquidity factors.
Recommended allocation strategies typically suggest 5-15% of investment portfolios in precious metals, with the specific percentage dependent on individual risk tolerance and economic outlook. Dollar-cost averaging into physical positions helps manage timing risk while building long-term holdings.
ETF and Mining Stock Considerations
Gold ETFs provide liquid exposure without physical storage requirements, though investors should understand the differences between physically-backed funds and those using derivatives. Understanding how to evaluate mining stocks becomes crucial for investors seeking leveraged gold exposure through equities.
Mining stocks historically amplify gold price movements, both upward and downward. During gold bull markets, quality mining companies can outperform the underlying metal by 2-3x, though they also carry company-specific risks including operational challenges, environmental issues, and management quality.
Portfolio Integration and Risk Management
Modern portfolio theory suggests gold's negative correlation with stocks and bonds during crisis periods makes it valuable for risk reduction. However, these correlations can shift during different market regimes, requiring active monitoring and potential rebalancing.
Options strategies, including protective puts on gold ETFs or covered calls on mining stocks, can help manage downside risk while maintaining upside participation. These approaches require more sophisticated understanding but can enhance risk-adjusted returns.
Risks and Downside Scenarios
While many analysts maintain bullish gold outlooks, several risk factors could pressure prices lower in 2026.
Federal Reserve Hawkishness
The primary downside risk stems from more aggressive Federal Reserve policy than currently anticipated. Should inflation prove more persistent than expected, the Fed might maintain restrictive policy longer or raise rates higher than markets anticipate. Such scenarios could strengthen the dollar and raise opportunity costs of holding non-yielding gold.
Economic Growth Acceleration
Unexpectedly strong economic growth could reduce safe-haven demand while increasing competition from risk assets. Technology sector innovations, productivity improvements, or resolution of geopolitical tensions could shift investor preferences away from defensive assets.
Cryptocurrency Competition
Digital assets, particularly Bitcoin, present potential competition for gold's monetary role. While their correlation has been inconsistent, sustained cryptocurrency adoption could capture investment flows traditionally directed toward precious metals.
Technical Breakdown Scenarios
From a technical perspective, failure to hold key support levels around $4,400-$4,500 could trigger algorithmic selling and momentum-based strategies, potentially driving prices lower toward $4,000-$4,200 levels.
Frequently Asked Questions
What is the most likely gold price target for end of 2026?
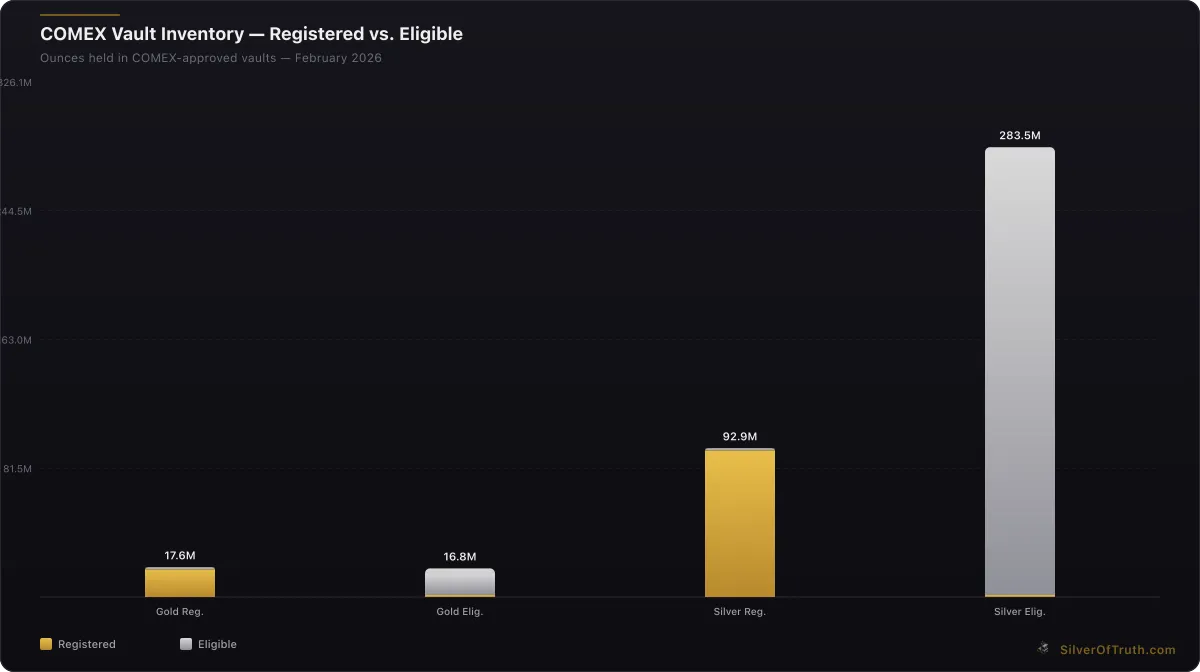
Source: SilverOfTruth COMEX data, February 2026
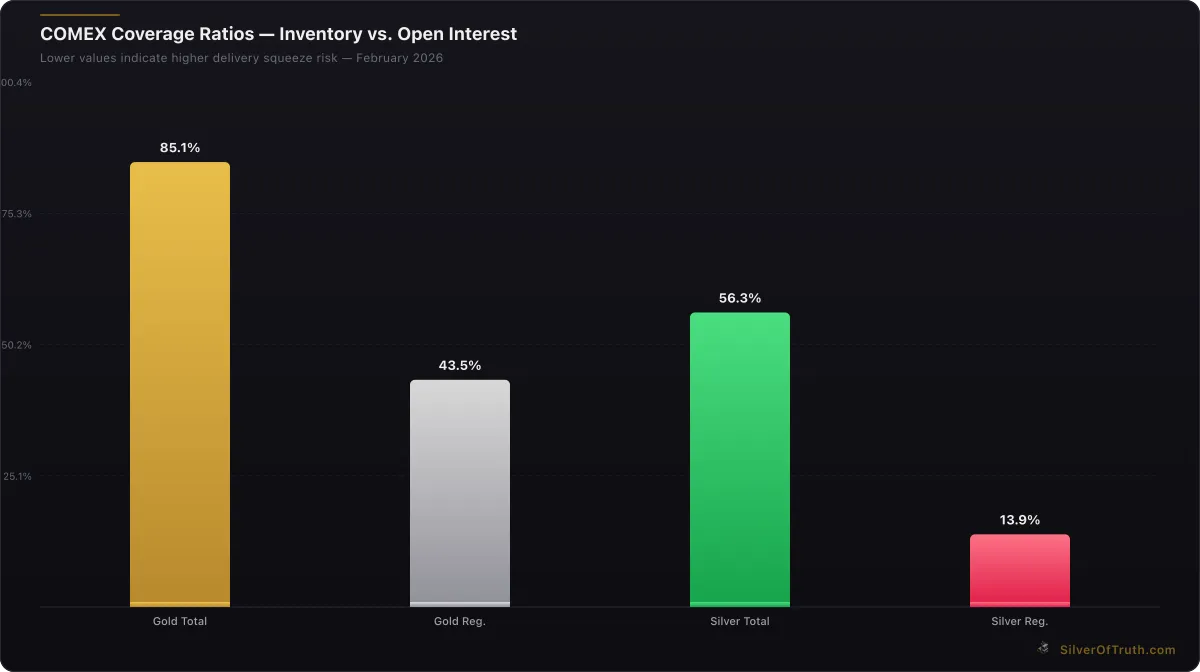
COMEX coverage ratios — lower values indicate higher delivery squeeze risk. Source: SilverOfTruth, February 2026
Based on consensus analyst forecasts, gold prices are likely to trade between $5,000-$5,800 per ounce by December 2026, with the median target around $5,400. This assumes moderate Federal Reserve policy easing and continued geopolitical uncertainties supporting safe-haven demand.
How does current gold inventory at COMEX affect price predictions?
COMEX registered inventory at 17.58 million ounces provides 43.5% coverage against open interest, indicating adequate but not excessive supply. While not immediately bullish, continued inventory declines could create delivery pressures that support higher prices, particularly if combined with increased physical demand.
What percentage of a portfolio should be allocated to gold in 2026?
Traditional portfolio allocation models suggest 5-15% in precious metals, with the specific percentage depending on individual risk tolerance and economic outlook. Conservative investors might target the lower end, while those expecting significant monetary or geopolitical disruption might increase allocations toward 15-20%.
Are mining stocks better than physical gold for 2026 gains?
Mining stocks typically provide leveraged exposure to gold prices, potentially amplifying gains during bull markets. However, they also carry company-specific risks and higher volatility. A balanced approach might include both physical gold for stability and quality mining stocks for growth potential.
How do cryptocurrency prices affect gold forecasts?
While correlations vary over time, cryptocurrencies and gold can compete for "alternative asset" investment flows. However, gold's 5,000-year history as a store of value and central bank reserve asset provides fundamental demand that Bitcoin cannot replicate. Both assets may coexist in portfolios serving different purposes.
The gold price forecast for 2026 reflects a complex interplay of monetary policy, geopolitical tensions, supply constraints, and evolving investment patterns. While expert predictions vary significantly, the consensus suggests continued strength driven by structural factors including central bank diversification, supply limitations, and persistent inflation concerns.
Investors considering gold exposure should evaluate their individual circumstances, risk tolerance, and investment objectives. Whether through physical ownership, ETFs, or mining stocks, precious metals can provide valuable portfolio diversification during uncertain times. Track real-time gold market developments and inventory data with the SilverOfTruth app, available on the App Store.
Disclaimer: This article is for informational and educational purposes only and does not constitute financial, investment, or trading advice. Past performance is not indicative of future results. Always conduct your own research and consult with a qualified financial advisor before making investment decisions. SilverOfTruth provides market data and analysis tools — it does not provide personalized financial advice.