
COMEX Gold Inventory Drop: Decoding the -0.8% Decline and Its Supply Chain Risks
COMEX gold inventory declined 0.8% this week to 34.4 million ounces, marking another concerning drop in deliverable metal at the world's largest precious metals exchange. With registered stocks at 17.6 million ounces and open interest at 409,694 contracts, the coverage ratio now sits at 84%—a medium-risk level that warrants close monitoring by precious metals investors tracking supply chain vulnerabilities.
This inventory decline comes as gold prices surge 2.18% to $5,056.40 per ounce, creating a puzzling dynamic where physical metal drains from COMEX vaults while futures positioning shows speculator profit-taking. Understanding these vault movements and their implications for supply chain stability is crucial for investors navigating today's precious metals landscape. Our comprehensive COMEX Explained guide provides the foundation for interpreting these critical market signals.
Quick Answer: COMEX gold inventory dropped 0.8% to 34.4M oz this week, bringing the coverage ratio to 84% against 409,694 open interest contracts. While not yet critical, this decline reflects potential supply chain pressures that could escalate if combined with increased delivery demand or further vault outflows.
What Does the -0.8% Inventory Drop Signal?
The latest COMEX gold inventory data reveals registered stocks at 17,576,525 ounces and eligible stocks at 16,839,336 ounces, totaling 34,415,861 ounces. This 0.8% weekly decline may seem modest, but it represents approximately 276,000 ounces of gold leaving COMEX-approved depositories—worth roughly $1.4 billion at current prices.
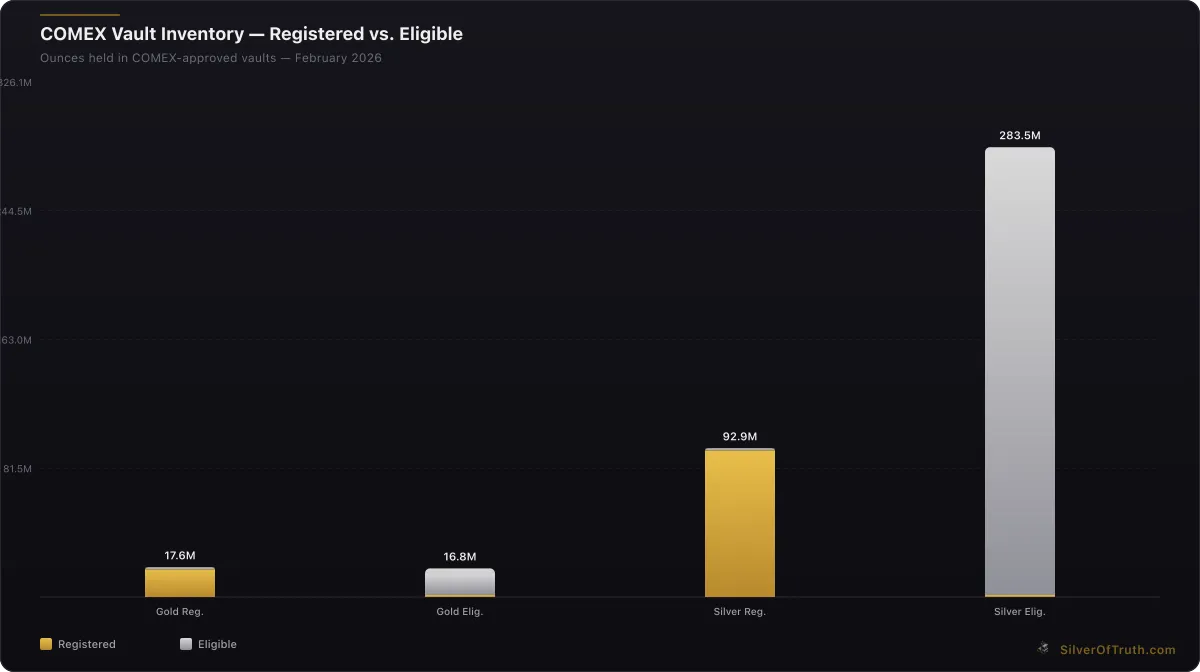
Source: SilverOfTruth COMEX data, February 2026
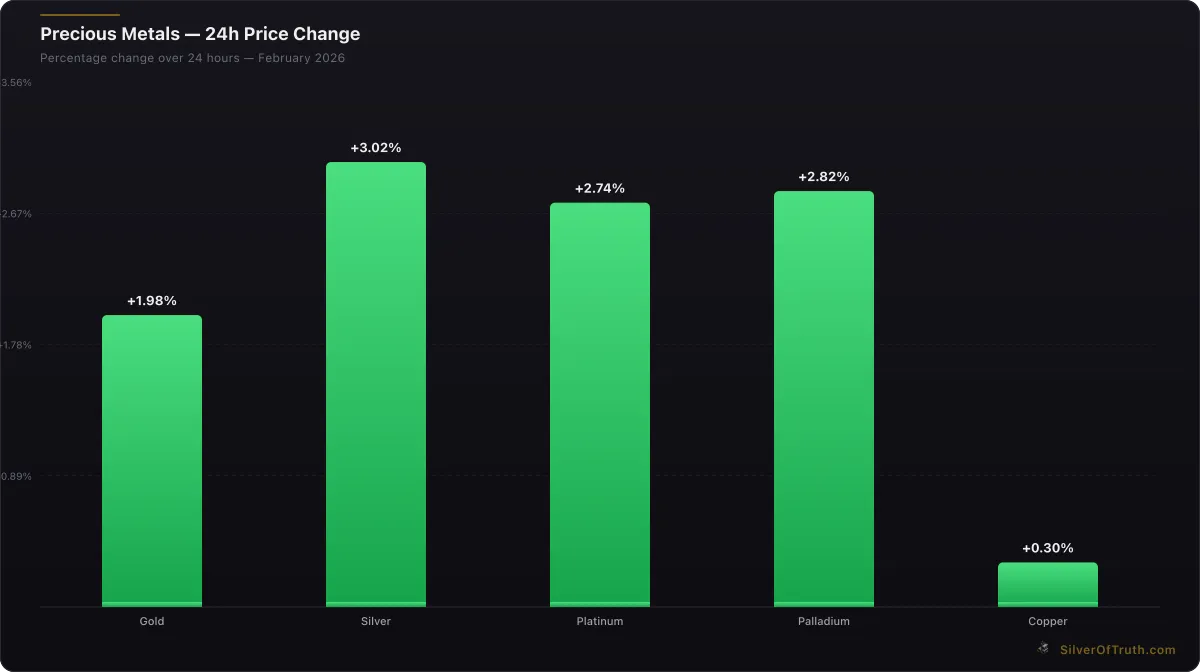
24-hour precious metals price changes. Source: SilverOfTruth, February 2026
According to CME Group warehouse reports, this inventory reduction occurred across multiple depositories, suggesting broad-based outflows rather than isolated movements. The decline affects both registered metal (available for delivery) and eligible metal (stored but not earmarked for futures delivery), indicating that holders are removing physical gold from the COMEX system entirely.
Historical context shows that sustained inventory declines often precede delivery stress periods. During the March 2020 market turmoil, similar weekly outflows of 2-3% preceded a coverage ratio crisis that forced the London Metals Exchange to establish emergency delivery procedures. While current levels remain manageable, the trend bears watching as central banks continue aggressive gold accumulation policies globally.
The World Gold Council data shows central bank purchases reached record levels in 2023-2024, with emerging market central banks leading the charge. This institutional demand creates a structural bid for physical gold that could accelerate COMEX outflows if delivery premiums widen significantly versus London or Shanghai markets.
How Do Coverage Ratios Reveal Supply Chain Stress?
The current coverage ratio of 84% means COMEX vaults hold 0.84 ounces of total inventory for every ounce of open interest outstanding. More critically, the registered coverage ratio sits at 42.9%, indicating less than half an ounce of deliverable metal backing each futures contract that could demand delivery.
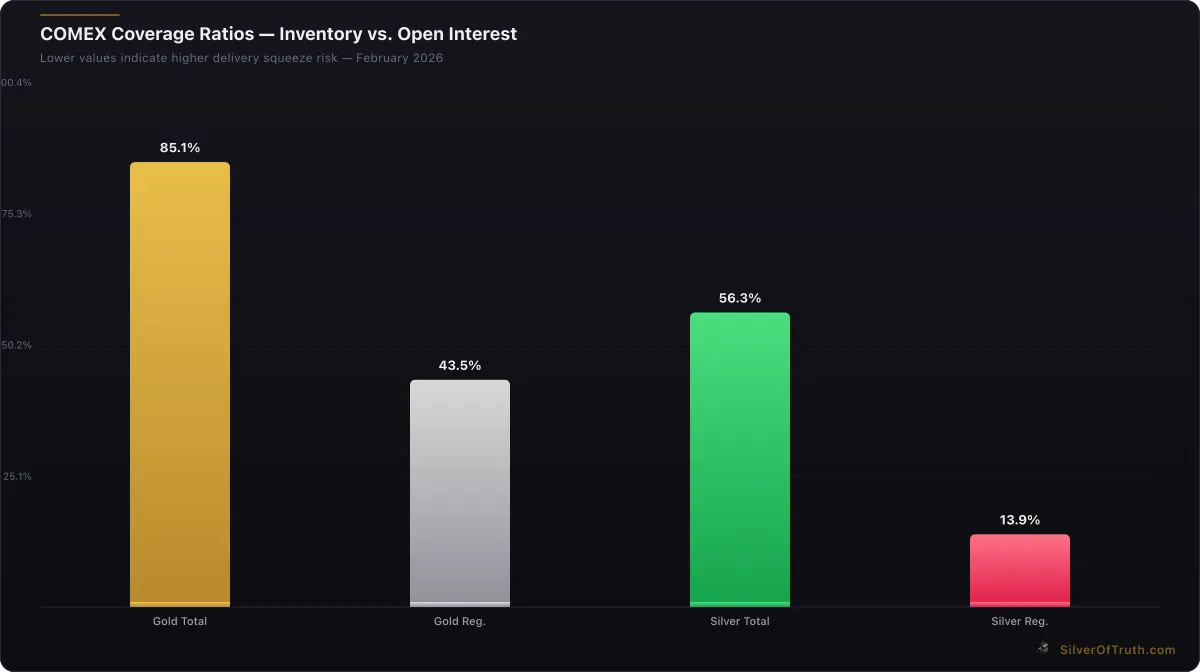
COMEX coverage ratios — lower values indicate higher delivery squeeze risk. Source: SilverOfTruth, February 2026
Coverage ratios below 50% historically correlate with increased delivery volatility and potential supply chain disruptions. The CFTC position data shows open interest at 409,694 contracts, equivalent to 40.97 million ounces of gold exposure. Against registered inventory of 17.6 million ounces, any significant uptick in delivery notices could quickly strain available supplies.
Supply chain vulnerabilities become apparent when comparing COMEX dynamics to global gold flows. London's LBMA vaults hold over 1,000 tonnes of gold, while COMEX registered stocks represent roughly 547 tonnes. This disparity means COMEX operates as a relatively small physical hub despite its outsized influence on global gold pricing through futures contracts.
The medium-risk classification at current coverage levels masks underlying tensions. Commercial hedgers hold net short positions of 207,778 contracts according to the latest COT data, representing potential delivery obligations if these positions remain unhedged at contract expiration. Track these dynamics live using our COMEX Inventory Tracker for real-time vault monitoring.
What Supply Chain Risks Are Emerging?
Supply chain risks in the COMEX gold market stem from multiple converging factors beyond simple inventory arithmetic. The vault ecosystem relies on a delicate balance between mining supply, refinery throughput, logistics networks, and storage capacity across approved depositories in New York, Delaware, and other locations.
Recent geopolitical tensions have disrupted traditional gold supply routes, particularly affecting flows from major producing regions. Russian gold sanctions have redirected substantial volumes away from Western markets, while Chinese domestic consumption has absorbed increasing mine production that previously fed international markets. These structural shifts reduce the pool of gold available for COMEX delivery, making inventory management more challenging.
Refinery capacity constraints present another vulnerability layer. The precious metals refining industry operates with thin margins and limited excess capacity, particularly for LBMA Good Delivery bar production—the standard required for COMEX registered inventory. When refineries prioritize fabricated products for jewelry and electronics over investment bars, it can create bottlenecks in deliverable supply replenishment.
Transportation and insurance costs have escalated significantly since 2020, affecting the economics of moving gold between markets. Higher logistics costs create larger arbitrage thresholds between COMEX, London, and Shanghai prices, reducing the efficiency of price convergence mechanisms that historically kept markets in balance. Our analysis in the COMEX vs LBMA comparison explores these cross-market dynamics in detail.
Storage capacity limitations at approved COMEX depositories create additional structural constraints. Unlike oil or agricultural commodities where storage can expand relatively quickly, precious metals vaulting requires specialized security infrastructure that takes years to develop. Any surge in gold inflows from mine production or central bank sales could quickly overwhelm available vault space.
Why Are Speculators Reducing Positions Despite Price Strength?
The latest CFTC Commitment of Traders data reveals a fascinating disconnect between price action and positioning. Managed money traders reduced net long positions by 26,087 contracts to 92,072, while non-commercial speculators cut net longs by 39,792 contracts to 165,604. This aggressive position reduction occurred as gold rallied above $5,000 per ounce, suggesting profit-taking from previously crowded long positions.
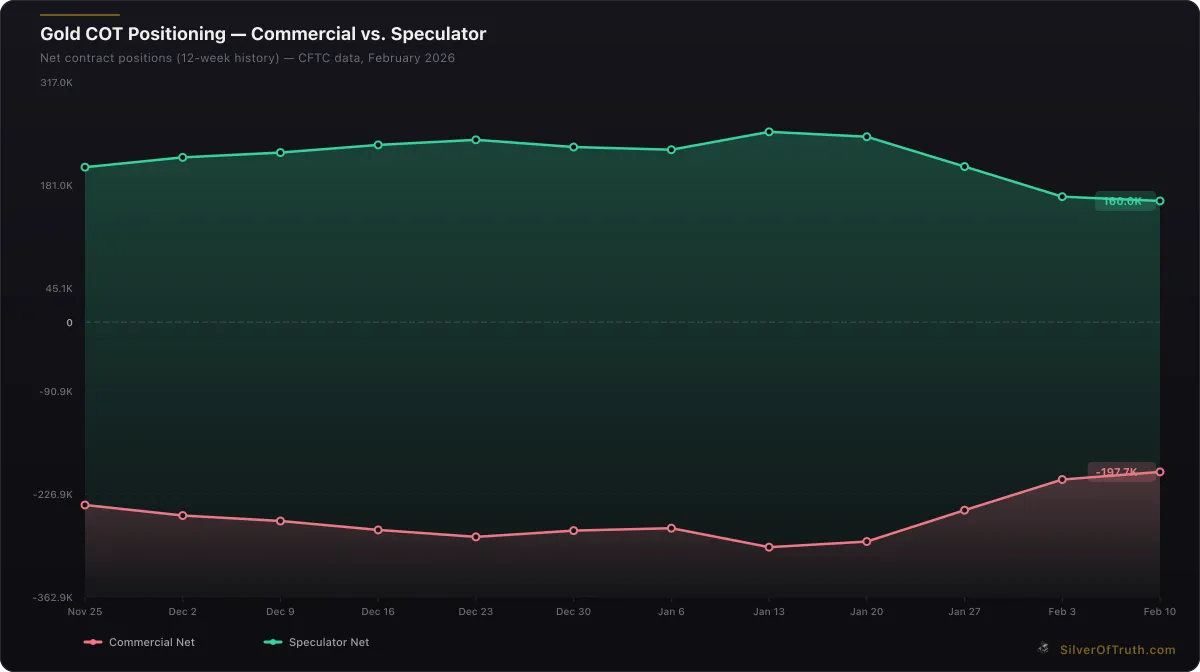
Gold COT positioning: commercial hedgers (red) vs. speculators (green). Source: CFTC via SilverOfTruth, February 2026
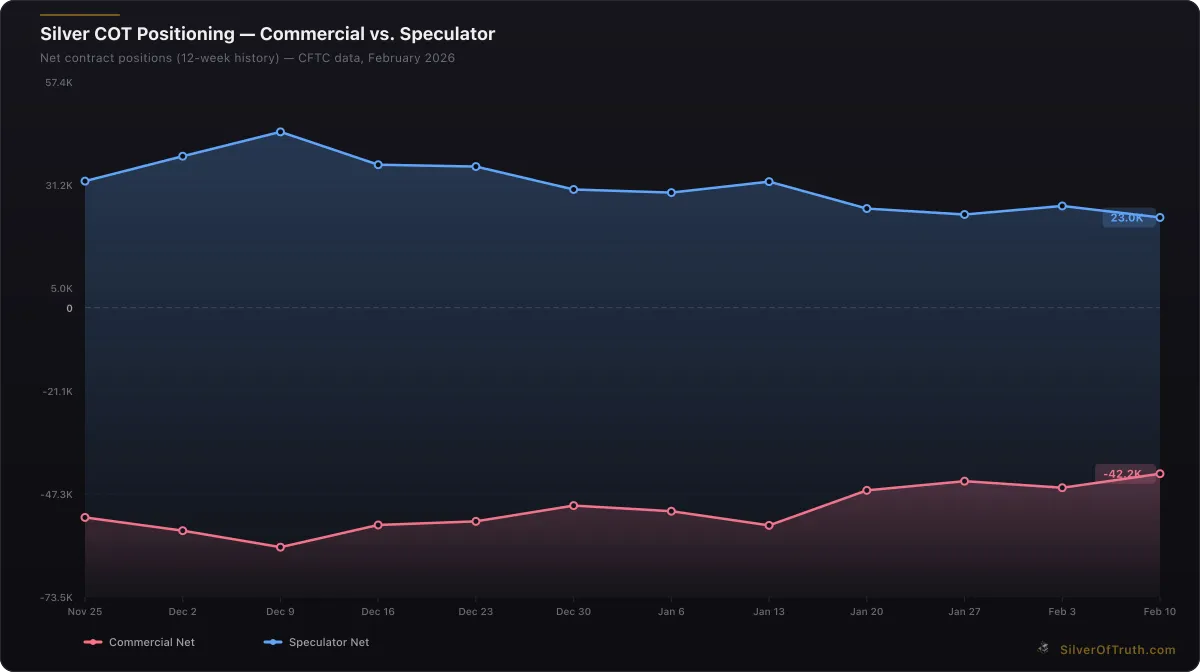
Silver COT positioning: commercial hedgers (red) vs. speculators (blue). Source: CFTC via SilverOfTruth, February 2026
Open interest declined by 78,769 contracts to 409,694, confirming that both longs and shorts are exiting positions rather than new money entering the market. This pattern typically indicates mature bull market conditions where early adopters take profits while late-arriving momentum buyers provide liquidity for exits.
Speculator positioning at 52.4% of total open interest remains elevated by historical standards, leaving room for further unwinding if gold prices stall or decline. Concentration data shows the top 4 short traders control 34.2% of short positions, compared to just 17.1% for the top 4 long traders, indicating asymmetric risk if any major short-covering develops.
The divergence between futures positioning and physical inventory flows suggests different market participants are driving each trend. While paper gold speculators book profits, central banks and institutional buyers continue accumulating physical metal, draining vault supplies. This two-tier market structure could lead to explosive price moves if physical shortages eventually force paper market reconciliation.
Commercial hedgers increased their net short positions by 40,507 contracts, indicating mining companies and gold dealers are hedging more aggressively as prices rise. This increased commercial selling provides a natural brake on further price advances but also suggests industry participants expect some mean reversion from current elevated levels.
How Do Global Supply Chains Impact COMEX Dynamics?
COMEX gold inventory fluctuations increasingly reflect global supply chain disruptions rather than isolated U.S. market dynamics. The exchange operates as a key hub in the international gold distribution network, where inventory changes signal broader shifts in worldwide metal flows and storage preferences.
China's gold market liberalization has created a powerful alternative to Western precious metals infrastructure. Shanghai Gold Exchange physical delivery volumes now rival COMEX, while Chinese banks offer storage services competitive with traditional Swiss and London facilities. This East-West bifurcation means gold can exit COMEX systems permanently when Asian buyers prefer local storage over New York vaults.
Central bank gold repatriation campaigns continue influencing vault dynamics globally. Countries like Germany, Austria, and Turkey have relocated gold reserves from New York and London to domestic facilities, reducing the pool of metal available for commercial lending and delivery into futures markets. While these movements don't directly affect COMEX registered stocks, they tighten overall supply conditions that eventually pressure exchange inventories.
Mine production trends create long-term supply chain pressures that inventory data reflects in real-time. Global gold production has plateaued around 3,300 tonnes annually despite higher prices, as easily accessible ore bodies become depleted and environmental regulations increase extraction costs. New mine development timelines of 7-10 years mean current production constraints will persist, supporting inventory values and delivery premiums.
The U.S. Mint gold sales data provides insight into retail demand pressures that can quickly drain available supplies. American Eagle gold coin sales often surge during market uncertainty, requiring the Mint to compete with futures markets for available refined gold blanks. These demand spikes can rapidly deplete dealer inventories and force increased COMEX withdrawals for fabrication.
What Does History Teach About Inventory Declines?
Historical analysis of COMEX gold inventory patterns reveals that sustained declines often precede significant market events, though the timing and magnitude vary considerably. The 1979-1980 gold bull market saw COMEX registered stocks fall below 1 million ounces as delivery demand overwhelmed available supplies, contributing to price spikes above $800 per ounce.
More recently, the 2008 financial crisis triggered massive COMEX gold outflows as investors demanded physical possession rather than paper claims. Inventory declines accelerated as credit spreads widened and counterparty risks increased, forcing many holders to withdraw metal from the exchange system entirely. This precedent suggests current outflows may reflect similar concerns about financial system stability.
The March 2020 COVID disruption provides the most relevant recent comparison. COMEX gold inventory fell sharply as transportation restrictions prevented normal arbitrage between London and New York markets. The resulting delivery crisis forced the CME to accept London Good Delivery bars in addition to traditional COMEX specifications, highlighting how supply chain disruptions can quickly overwhelm exchange infrastructure.
However, not all inventory declines signal crisis conditions. The 2010-2012 period saw steady outflows as ETF demand absorbed physical gold while mining supply remained constrained. These gradual declines reflected healthy demand rather than system stress, demonstrating that context matters more than absolute inventory levels.
Current decline patterns most closely resemble the early stages of previous bull markets, where rising prices attract initial selling from weak holders while strong hands accumulate physical metal. The key difference lies in the scale of central bank buying, which now represents a structural bid absent from historical episodes.
What Should Investors Monitor Going Forward?
Precious metals investors should track several key indicators to assess whether current COMEX gold inventory declines represent temporary volatility or emerging supply chain crisis. Weekly vault data provides the most immediate signal, with particular attention to registered versus eligible stock movements and cross-depository flow patterns.
Delivery notice trends offer crucial insight into physical demand pressures. Monthly contract expirations reveal whether futures holders are taking delivery or rolling positions forward, with increasing delivery activity signaling tightening supply conditions. Our COMEX delivery guide explains how to interpret these monthly patterns.
Shanghai Gold Exchange premium monitoring provides early warning of East-West arbitrage opportunities that could accelerate COMEX outflows. When Shanghai prices exceed London or New York quotes by more than transportation and insurance costs, it creates incentives for metal to flow eastward, draining Western vault supplies. Track these spreads continuously using our Gold Price tool for real-time market data.
COT positioning data helps predict whether speculator unwinding will continue or reverse, affecting futures demand and open interest levels. Extreme positioning in either direction often precedes sharp price moves that can trigger delivery activity spikes. Commercial hedger behavior provides additional insight into industry supply and demand expectations.
Central bank activity reports from the World Gold Council offer longer-term supply chain context. Accelerating official sector purchases reduce the pool of gold available for private markets, creating structural support for higher prices and delivery premiums. Monitor monthly and quarterly updates for shifts in official buying patterns.
Economic indicators affecting real interest rates—including inflation data, Federal Reserve policy signals, and currency movements—provide fundamental context for precious metals demand. Our inflation calculator tool helps assess the real return environment that drives gold investment flows.
Conclusion: Navigating Supply Chain Uncertainties
The recent 0.8% decline in COMEX gold inventory represents more than a simple statistical fluctuation—it reflects underlying supply chain pressures that could intensify as global monetary conditions evolve. With registered stocks at 17.6 million ounces and coverage ratios at medium-risk levels, investors must monitor these developments closely for signs of emerging delivery stress.
Current market dynamics reveal a two-tier structure where paper gold speculators take profits while physical metal continues flowing out of exchange vaults toward strong hands. This divergence could resolve through either price corrections that restore futures/physical equilibrium or supply shortages that force paper markets to reconcile with physical realities.
The supply chain risks highlighted by COMEX inventory declines extend beyond exchange mechanics to encompass global gold flows, central bank policies, and geopolitical tensions. Investors positioning for these uncertainties should consider the unique insights available through comprehensive precious metals analysis and tracking tools.
For deeper understanding of COMEX mechanics and their implications for precious metals investing, explore our complete COMEX Explained hub and monitor live vault data through the SilverOfTruth app for iOS—your complete precious metals command center available on the App Store.
FAQ
Q: Is an 0.8% inventory decline significant for COMEX gold? A: While not immediately critical, this decline represents approximately 276,000 ounces ($1.4B) leaving the system and contributes to medium-risk coverage ratios that warrant monitoring.
Q: How do coverage ratios indicate supply chain stress? A: The current 84% total coverage ratio and 42.9% registered coverage ratio approach levels where delivery demand could strain available supplies, particularly if open interest increases.
Q: Why are speculators reducing positions despite rising gold prices? A: Managed money and non-commercial traders are taking profits from previously crowded long positions, with open interest declining 78,769 contracts as both longs and shorts exit.
Q: What global factors affect COMEX inventory levels? A: Central bank repatriation, Chinese market growth, mine production constraints, and geopolitical tensions all influence gold flows into and out of COMEX depositories.
Q: Should investors be concerned about current inventory trends? A: Current levels remain manageable but trends suggest increasing supply chain pressures that could accelerate if delivery demand increases or global disruptions intensify.
Sources
- CME Group COMEX Warehouse Reports: https://www.cmegroup.com/markets/metals.html
- CFTC Commitment of Traders Reports: https://www.cftc.gov/dea/futures/other_lf.htm
- World Gold Council Gold Demand Trends: https://www.gold.org/goldhub/data
- U.S. Mint Production and Sales Figures: https://www.usmint.gov/about/production-sales-figures
- LBMA Precious Metals Statistics: https://www.lbma.org.uk/prices-and-data
Disclaimer: This article is for informational and educational purposes only and does not constitute financial, investment, or trading advice. Past performance is not indicative of future results. Always conduct your own research and consult with a qualified financial advisor before making investment decisions. SilverOfTruth provides market data and analysis tools — it does not provide personalized financial advice.
