
When to Buy Silver vs Gold: Using the Ratio as Your Guide
At 65.53, the current gold/silver ratio sits well above its 20-year average of 68, creating what many precious metals investors consider a strategic opportunity. But when exactly should you favor silver over gold in your allocation—and how can the ratio serve as your decision-making compass?
The gold/silver ratio represents how many ounces of silver it takes to buy one ounce of gold. According to LBMA pricing data, with gold at $5,063.80 and silver at $77.27, this ratio has fluctuated dramatically throughout history, from lows near 30 during precious metals bull markets to highs above 120 during severe market stress.
Understanding when to buy silver ratio signals versus gold requires analyzing historical patterns, current market dynamics, and your investment timeline. This comprehensive guide will equip you with the framework to make informed allocation decisions based on ratio analysis.
Understanding the Gold/Silver Ratio Fundamentals
The gold/silver ratio serves as more than a simple price comparison—it reveals the relative value proposition between these two monetary metals. Historically, the ratio has averaged around 68 over the past two decades, though it spent centuries closer to 16:1 when both metals served as official currency.
Modern ratio movements reflect several key factors: industrial demand shifts (silver's dual role as both precious and industrial metal), mining supply dynamics, investor sentiment, and monetary policy impacts. When the ratio rises above 80, it typically signals silver is undervalued relative to gold. Conversely, ratios below 50 often indicate gold is relatively cheap compared to silver.
Our complete guide to the gold/silver ratio explores these historical patterns in detail, showing how savvy investors have used ratio extremes to optimize their precious metals allocations for decades.
The current ratio at 65.53 sits in what technical analysts call the "decision zone"—neither extremely high nor low, requiring deeper analysis of supporting indicators. COMEX inventory data shows silver's registered coverage at just 13.9% versus gold's 43.5%, suggesting potential supply constraints that could drive the ratio lower.
For investors wondering when to buy silver ratio levels become compelling, history suggests patience pays when ratios exceed 70, while ratios below 60 often favor gold accumulation.
Historical Ratio Patterns and Buy Signals
Examining ratio behavior across different market cycles reveals consistent patterns that can guide allocation decisions. During the 2008 financial crisis, the ratio spiked above 80 as investors fled to gold's perceived safety, creating exceptional silver buying opportunities for those who recognized the signal.
The COVID-19 market disruption saw the ratio briefly touch 120—its highest level in modern history—before collapsing to 65 as silver's industrial demand recovered and monetary stimulus drove precious metals higher. Investors who bought silver when the ratio exceeded 100 saw outsized returns as it normalized.
These historical episodes demonstrate that extreme ratio readings often coincide with significant market stress or structural changes. The key insight: ratios above 80 have consistently marked excellent silver accumulation zones, while ratios below 50 have favored gold.
Between these extremes, the 60-80 range represents a "neutral zone" where other factors should guide decisions. Current COMEX data from our inventory analysis shows silver's high-risk coverage ratio at 56.3%, suggesting supply pressures that could push the ratio lower despite current neutral readings.
Mining supply trends also influence long-term ratio movements. According to Silver Institute data, silver mine production has declined in recent years while industrial demand continues growing, creating a structural supply deficit that should theoretically drive the ratio lower over time.
Current Market Environment Analysis
Today's ratio at 65.53 reflects a complex mix of factors that require careful analysis. Gold has benefited from central bank buying and safe-haven demand, while silver faces headwinds from industrial demand uncertainty and higher real interest rates that reduce its appeal as a monetary hedge.
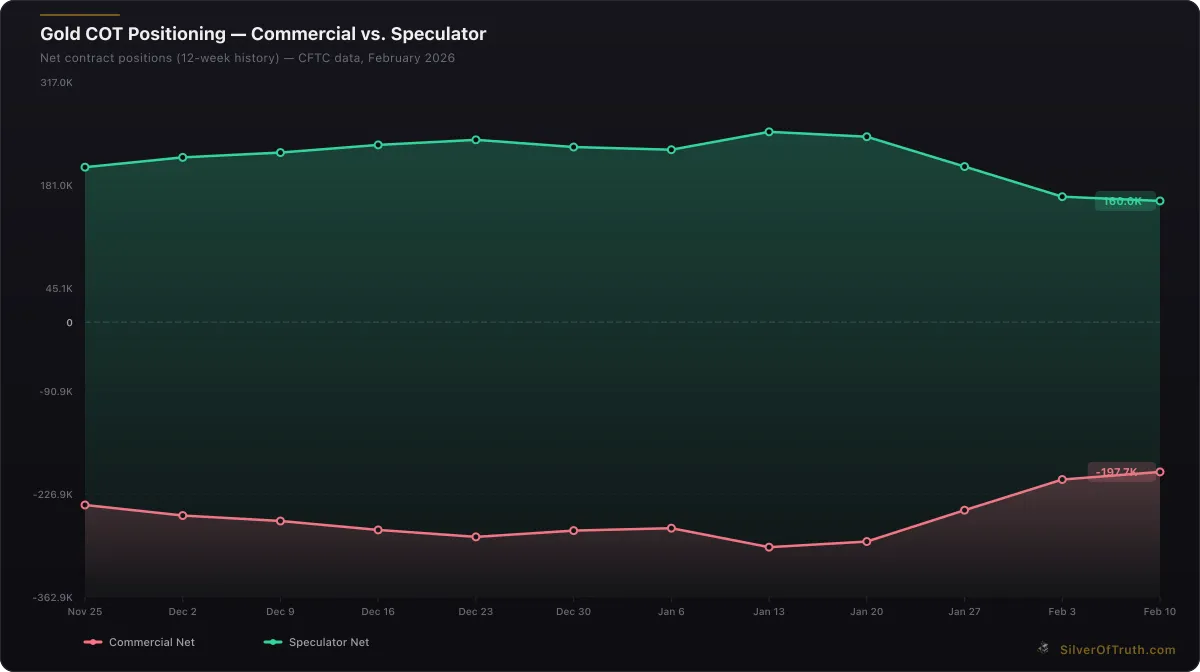
Gold COT positioning: commercial hedgers (red) vs. speculators (green). Source: CFTC via SilverOfTruth, February 2026
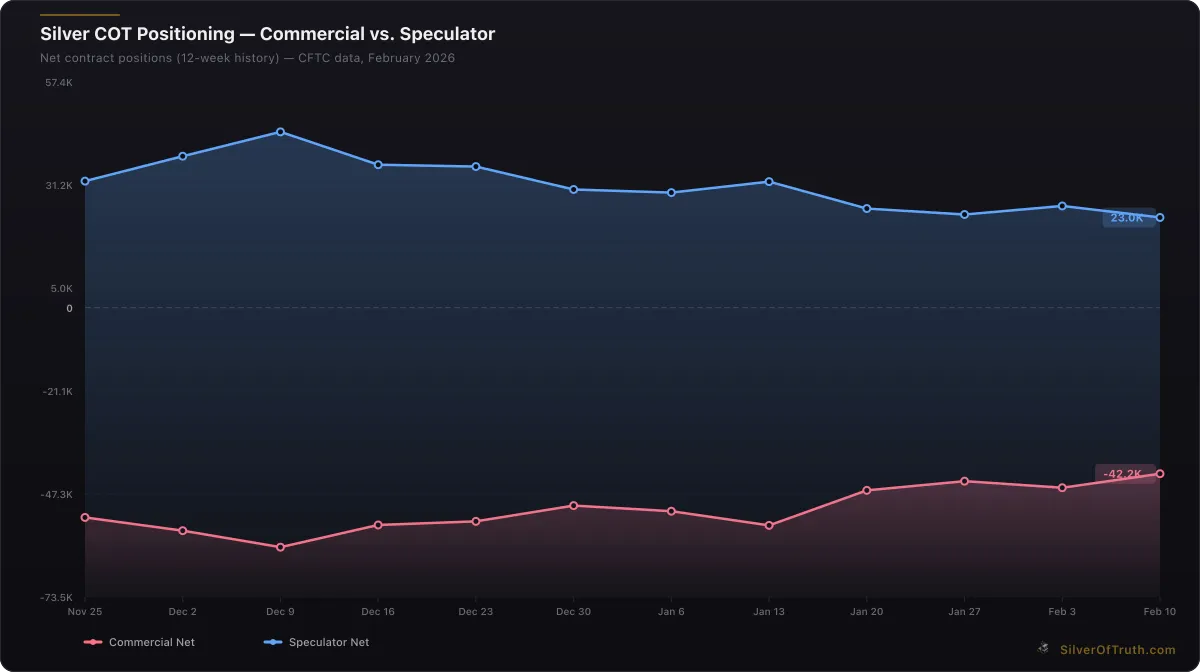
Silver COT positioning: commercial hedgers (red) vs. speculators (blue). Source: CFTC via SilverOfTruth, February 2026
Recent CFTC COT reports show commercial traders (typically mines and refiners) holding net short positions of -197,738 contracts in gold versus -42,163 in silver. This disparity suggests professional hedgers see more downside risk in gold than silver at current levels—a contrarian signal that could favor silver allocation.
COMEX inventory dynamics tell a particularly interesting story. Silver's registered inventory covers just 13.9% of open interest versus gold's 43.5% coverage, creating what our COMEX positioning analysis identifies as elevated delivery squeeze potential in silver.
The Federal Reserve's interest rate policy also impacts ratio decisions. Higher real rates typically favor gold over silver due to silver's industrial component and higher volatility. However, if inflation expectations rise or rate hikes pause, silver often outperforms due to its smaller market size and industrial demand recovery.
For investors focused on when to buy silver ratio signals, the current environment suggests patience. While 65.53 isn't an extreme reading, supporting factors like supply constraints and commercial positioning lean slightly toward silver accumulation.
Silver vs Gold Allocation Strategies
Professional precious metals investors typically use ratio-based allocation rather than fixed percentages. A common approach: increase silver allocation when the ratio exceeds 75, maintain balanced positions between 60-75, and favor gold when ratios drop below 60.
Conservative Ratio Strategy:
- Ratio above 80: 70% silver, 30% gold
- Ratio 70-80: 60% silver, 40% gold
- Ratio 60-70: 50% silver, 50% gold
- Ratio 50-60: 40% silver, 60% gold
- Ratio below 50: 30% silver, 70% gold
Aggressive Ratio Strategy:
- Ratio above 90: 80% silver, 20% gold
- Ratio 80-90: 70% silver, 30% gold
- Ratio 70-80: 60% silver, 40% gold
- Ratio 60-70: 50% silver, 50% gold
- Ratio below 60: Favor gold accumulation
These frameworks require discipline and patience, as ratio reversals can take months or years to materialize. Our silver stacking guide provides practical implementation strategies for beginners looking to start with ratio-based allocation.
Advanced investors also consider dollar-cost averaging within ratio bands. Rather than making large allocation shifts at specific ratio levels, they gradually adjust positions as ratios move through different ranges, reducing timing risk while maintaining strategic direction.
The current ratio at 65.53 falls into the neutral zone for most strategies, suggesting balanced allocation with slight silver bias given supporting technical factors. For investors just starting, our guide to starting with $100 shows how to implement ratio strategies with modest capital.
Timing Your Precious Metals Purchases
Beyond ratio levels, successful precious metals allocation requires attention to shorter-term timing factors. Monthly patterns show precious metals often perform better early in the month due to pension fund buying, while seasonal patterns favor accumulation during summer doldrums when prices often reach annual lows.
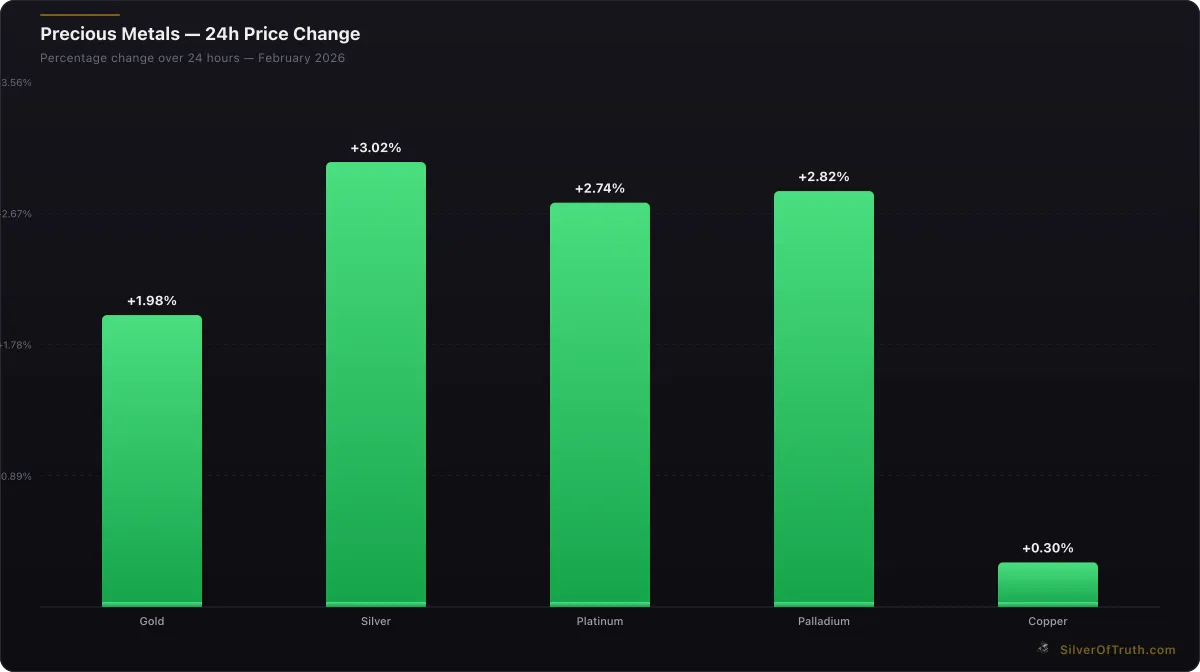
24-hour precious metals price changes. Source: SilverOfTruth, February 2026
Market sentiment indicators can refine timing within ratio-based strategies. When fear indexes spike or bond yields invert, precious metals often see increased safe-haven demand that can accelerate ratio moves. Conversely, periods of market complacency may offer better accumulation opportunities.
Physical premiums also influence timing decisions. Our analysis of bullion dealer comparisons shows premiums tend to spike during periods of high demand or supply constraints, making gradual accumulation more cost-effective than large purchases during premium spikes.
For silver specifically, industrial demand patterns create seasonal variations. Electronics manufacturing cycles and solar panel installation seasons can impact silver demand, sometimes creating tactical buying opportunities during slower industrial periods.
The key principle: use ratio levels for strategic allocation direction, but implement purchases gradually to reduce timing risk and take advantage of premium variations. This approach has proven more effective than attempting to perfectly time ratio extremes.
Risk Management in Ratio-Based Strategies
Ratio trading isn't without risks. Extended periods where ratios remain at seemingly "extreme" levels can test investor patience and conviction. The ratio stayed above 80 for extended periods during 2008-2009 and again in 2020, requiring significant patience from silver buyers.
Position sizing becomes critical when implementing ratio strategies. Rather than making dramatic allocation shifts, successful investors typically limit individual moves to 10-15% of their total precious metals allocation, spreading larger position changes across multiple ratio levels.
Liquidity considerations also matter. Silver's smaller market size means it can be more volatile during stress periods, potentially creating temporary dislocations that don't reflect fundamental value. Our physical vs paper silver analysis explores these liquidity dynamics in detail.
Storage and insurance costs differ between gold and silver, with silver requiring more space and often higher storage fees per dollar value. These practical considerations should factor into ratio-based allocation decisions, particularly for larger positions.
Geographic diversification can reduce risks associated with ratio strategies. Holding some metals in different jurisdictions or storage facilities reduces single-point-of-failure risks while maintaining strategic allocation flexibility.
Advanced Ratio Analysis Techniques
Professional traders often enhance basic ratio analysis with additional technical indicators. Moving averages of the ratio can smooth short-term noise and identify trend changes, while momentum indicators can signal when ratio moves are losing steam.
Volatility analysis adds another dimension. Periods of low ratio volatility often precede significant moves, while high volatility may signal ratio extremes are approaching. The current period shows moderate volatility, suggesting potential for larger moves ahead.
Correlation analysis between the ratio and other markets can provide additional insights. The ratio often correlates negatively with industrial commodity prices and positively with safe-haven demand indicators, helping investors anticipate potential direction changes.
Fundamental analysis complements technical ratio work. Supply/demand projections, central bank policy changes, and industrial demand trends can all influence longer-term ratio trajectories independent of current technical levels.
Our COT report analysis shows how professional positioning data can enhance ratio-based strategies, providing insights into whether current ratio levels reflect widespread positioning or contrarian opportunities.
Common Ratio Strategy Mistakes
One frequent error involves chasing ratio extremes without considering supporting factors. The ratio can remain "extreme" for extended periods if fundamental factors support the deviation from historical norms. Always validate ratio signals with inventory data, positioning analysis, and fundamental trends.
Another mistake involves rigid adherence to ratio levels without considering market context. During periods of genuine crisis, normal ratio relationships may not apply as flight-to-quality dynamics overwhelm typical value considerations.
Overconcentration presents another risk. Some investors become so convinced of ratio analysis that they neglect other precious metals opportunities or overall portfolio diversification. Ratio strategies should complement, not replace, broader investment frameworks.
Timing all purchases based on ratio levels can create "feast or famine" buying patterns. Instead, maintain core positions while using ratio analysis to guide incremental allocation adjustments and tactical additions.
Finally, ignoring transaction costs and premiums can erode ratio strategy returns. Frequent rebalancing based on small ratio moves may generate more costs than benefits, particularly in physical metals markets where bid-ask spreads and premiums matter.
Implementation Framework for Different Investor Types
New Precious Metals Investors: Start with a 50/50 gold/silver split regardless of current ratio, then adjust new purchases based on ratio movements. This approach builds positions while learning ratio dynamics without risking large allocation errors.
Experienced Stackers: Use more aggressive ratio-based allocation adjustments, potentially shifting 60-70% of new purchases toward the favored metal when ratios exceed 75 or drop below 55.
High-Net-Worth Investors: Consider both ratio strategies and absolute position sizing. Large positions may benefit from professional storage and insurance, while allocation decisions can incorporate tax implications and estate planning considerations.
Retirement Account Holders: Focus on precious metals ETFs or mining stocks that allow easier rebalancing between gold and silver exposure without taking physical delivery or triggering tax events.
Each investor type should adapt ratio strategies to their specific circumstances while maintaining the core principle: use ratio analysis as a guide for relative allocation between gold and silver, not absolute investment decisions.
Frequently Asked Questions
What gold/silver ratio level signals it's time to buy silver? Historically, ratios above 80 have marked excellent silver accumulation opportunities, while ratios above 100 represent extreme silver value. The current ratio at 65.53 sits in neutral territory, though supporting factors like COMEX inventory constraints lean slightly toward silver accumulation.
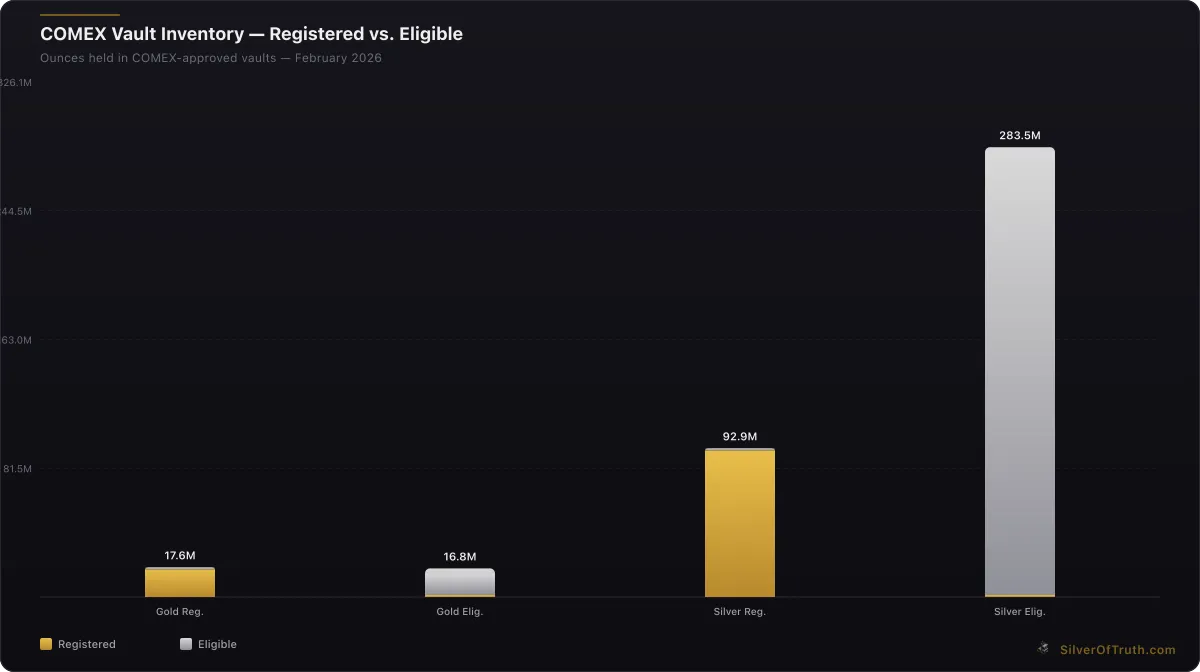
Source: SilverOfTruth COMEX data, February 2026
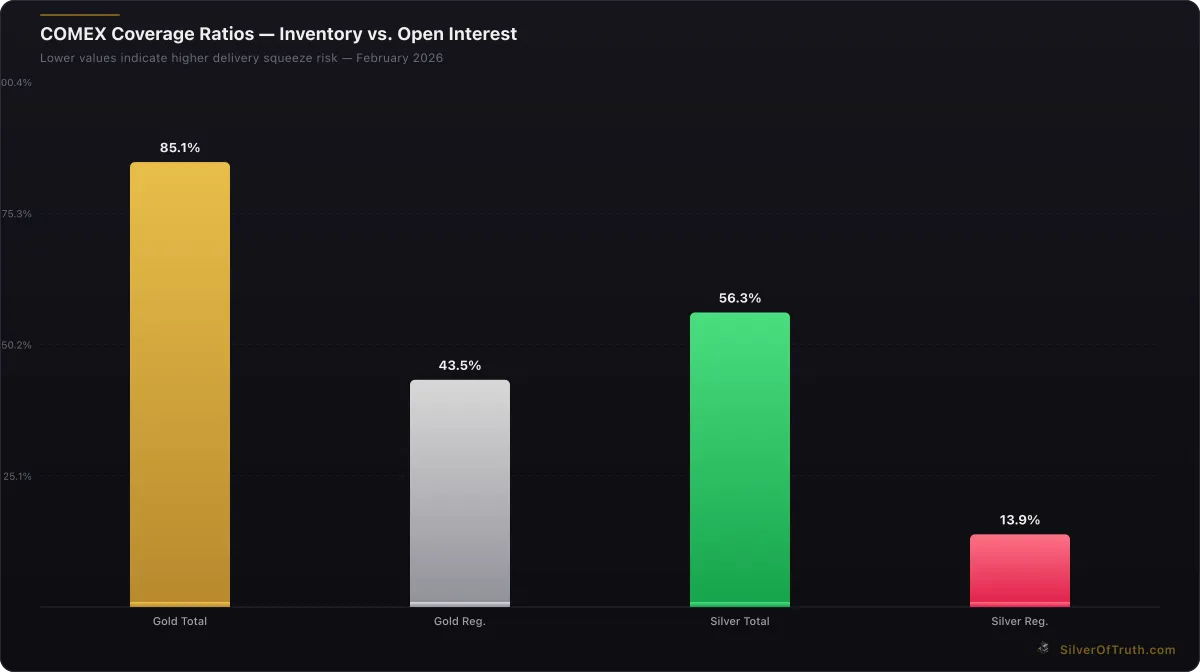
COMEX coverage ratios — lower values indicate higher delivery squeeze risk. Source: SilverOfTruth, February 2026
Should I wait for the ratio to hit 80 before buying silver? Not necessarily. Dollar-cost averaging within ratio bands often proves more effective than waiting for extreme levels that may not materialize. Consider gradual silver accumulation as the ratio rises above 70, with increased allocation above 80.
How quickly do ratio reversals typically occur? Ratio moves can be gradual over years or rapid over months, depending on market conditions. The 2020 spike to 120 reversed to 65 within 18 months, while other cycles have taken 3-5 years to fully play out.
Does the ratio work better for physical metals or ETFs? The ratio principle applies to both, but physical metals offer more flexibility for long-term ratio strategies without counterparty risk. ETFs may be more practical for frequent rebalancing or retirement accounts.
What other factors should I consider beyond the ratio? COMEX inventory levels, COT positioning, industrial demand trends, central bank policies, and global economic conditions all influence precious metals performance independent of ratio levels.
Disclaimer: This article is for informational and educational purposes only and does not constitute financial, investment, or trading advice. Past performance is not indicative of future results. Always conduct your own research and consult with a qualified financial advisor before making investment decisions. SilverOfTruth provides market data and analysis tools — it does not provide personalized financial advice.