
The gold silver ratio currently sits at 65.5, meaning it takes 65.5 ounces of silver to buy one ounce of gold. But what does this number actually mean for investors? Understanding this fundamental precious metals metric is crucial for making informed decisions about when to buy, sell, or trade between these two monetary metals.
At its core, the gold silver ratio meaning reveals the relative value between gold and silver at any given moment. When the ratio reaches extreme levels—particularly above 100—it often signals that silver is dramatically undervalued compared to gold, creating potential opportunities for strategic positioning. Let's decode what these numbers tell us about market conditions and investment timing.
What is the Gold Silver Ratio Exactly?
The gold silver ratio is a simple mathematical calculation: the current spot price of gold divided by the current spot price of silver. With gold at $5,063.80 and silver at $77.27, we get 65.5 ounces of silver per ounce of gold according to SilverOfTruth real-time data.
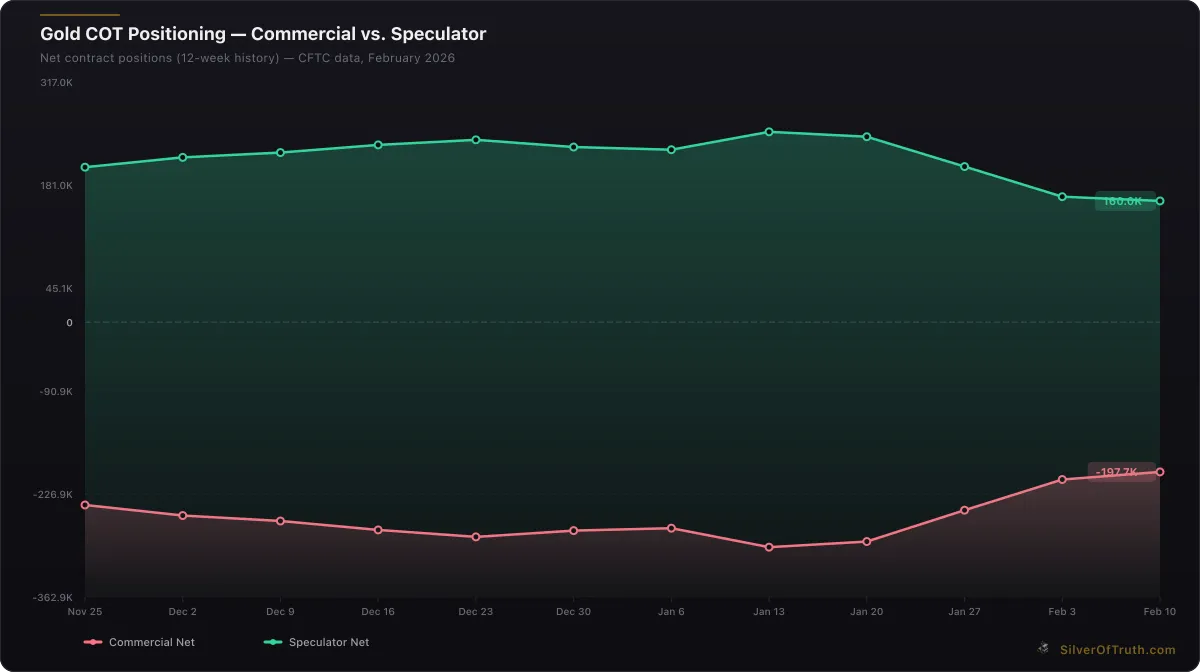
Gold COT positioning: commercial hedgers (red) vs. speculators (green). Source: CFTC via SilverOfTruth, February 2026
This ratio has fluctuated dramatically throughout history. During the classical gold standard era, governments often fixed the ratio artificially at 15:1 or 16:1. In modern free-floating markets, we've seen the ratio swing from lows near 30:1 to extreme highs above 120:1 during crisis periods.
Understanding what drives these fluctuations requires examining both metals' unique market dynamics. Gold primarily serves as a monetary asset and store of value, with central banks holding approximately 35,000 tons according to World Gold Council data. Silver, while also monetary in nature, has significant industrial applications consuming roughly 60% of annual supply based on Silver Institute research.
The ratio essentially measures which metal is "expensive" relative to the other. A high ratio suggests gold is overvalued versus silver, while a low ratio indicates the opposite. For strategic investors, these extremes present opportunities to trade between metals at advantageous relative prices.
Our complete guide to the Gold/Silver Ratio provides deeper historical context for understanding how this metric has evolved over decades of market cycles.
Historical Context: What Different Ratio Levels Mean
Ratio Below 50: Silver Strength
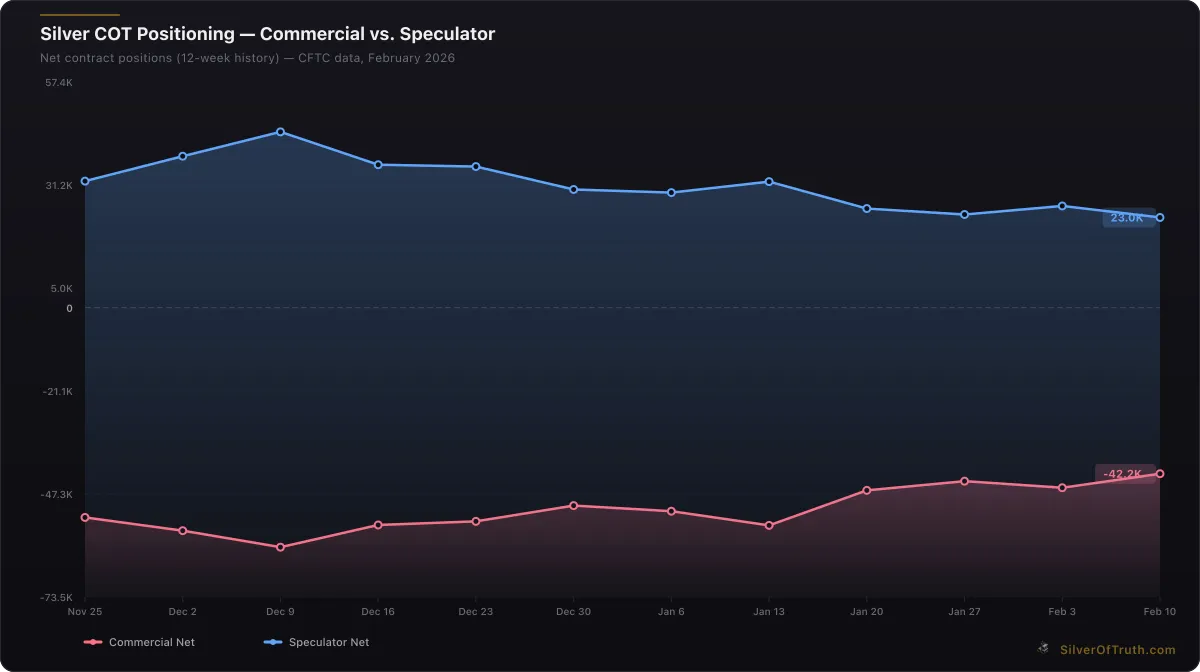
Silver COT positioning: commercial hedgers (red) vs. speculators (blue). Source: CFTC via SilverOfTruth, February 2026
When the gold silver ratio drops below 50, silver is typically outperforming gold significantly. This occurred during the 1970s precious metals bull market when silver briefly touched $50 per ounce while gold reached $850. The ratio compressed to approximately 17:1 at that peak, reflecting silver's explosive price appreciation.
Lower ratios often coincide with:
- Industrial silver demand surges
- Inflation expectations rising rapidly
- Speculative buying in silver markets
- Currency debasement concerns
- Economic growth spurring industrial metal consumption
Ratio 50-80: Normal Trading Range
The current level of 65.5 falls within what many analysts consider the modern "normal" range. Since 1990, the ratio has averaged approximately 68:1, making today's reading slightly below the long-term mean.
This range typically reflects:
- Balanced precious metals demand
- Steady industrial silver consumption
- Moderate monetary policy environments
- Regular portfolio rebalancing between metals
- Neither metal showing extreme over/undervaluation
Ratio Above 80: Silver Undervaluation Territory
When the ratio climbs above 80, historical analysis suggests silver becomes increasingly undervalued relative to gold. This creates what many precious metals investors view as a strategic opportunity to accumulate silver or trade gold for silver.
High ratio periods often feature:
- Economic uncertainty favoring gold's monetary premium
- Reduced industrial silver demand during recessions
- Speculative selling pressure on silver
- Flight-to-quality buying concentrated in gold
- Central bank gold purchases exceeding silver accumulation
Ratio Above 100: Extreme Silver Undervaluation
Ratios exceeding 100:1 are relatively rare in modern markets, occurring primarily during severe economic stress. The ratio peaked at approximately 120:1 during the 2020 COVID-19 market panic when gold spiked while silver crashed alongside risk assets.
These extreme levels historically marked excellent silver accumulation opportunities, as mean reversion typically followed within 12-24 months. The ratio above 100 suggests silver has been oversold relative to its monetary and industrial fundamentals.
For investors interested in capitalizing on ratio extremes, our Gold/Silver Ratio trading strategy guide explains specific approaches for timing these trades effectively.
Why Ratios Above 100 Signal Massive Silver Undervaluation
When the gold silver ratio soars above 100, it creates what many precious metals analysts consider the most compelling silver investment opportunity available. This extreme reading suggests silver has been beaten down far beyond what economic fundamentals would justify.
Supply-Demand Imbalances
Silver's dual nature as both an industrial and monetary metal creates unique dynamics during ratio spikes. Industrial demand typically represents 50-60% of annual consumption according to LBMA market structure data, making silver prices sensitive to economic cycles. During recessions, reduced industrial demand can crash silver prices even as monetary demand for gold increases.
However, silver mine production responds slowly to price changes due to long development timelines. Major silver mines require 7-10 years from discovery to production, creating supply rigidity. When the ratio exceeds 100, it often reflects temporary demand destruction rather than permanent supply abundance.
Historical Mean Reversion Patterns
Statistical analysis of ratio data since 1970 reveals strong mean reversion tendencies from extreme levels. When the ratio has exceeded 100:1, it has returned to sub-80 levels within an average of 18 months in every historical instance.
The 2020 spike to 120:1 reverted to 65:1 within 14 months as silver prices more than doubled from their March lows. This pattern reflects silver's higher price elasticity—when sentiment shifts, silver moves more dramatically than gold in both directions.
Underground Geology and Scarcity
The earth's crust contains approximately 19 parts silver for every 1 part gold according to geological surveys. This natural abundance ratio of roughly 19:1 provides a fundamental baseline for comparing the metals' relative scarcity. When market ratios reach 100:1 or higher, they suggest pricing disconnected from physical reality.
Additionally, silver's industrial consumption permanently removes metal from investment markets, unlike gold where nearly all mined metal remains available. This consumption sink gradually reduces above-ground silver inventory relative to gold stockpiles.
Our analysis of silver supply fundamentals explores these physical dynamics in greater detail for interested readers.
Current Market Context: 65.5 Ratio Analysis
Today's gold silver ratio of 65.5 positions both metals in relatively balanced territory, slightly favoring silver compared to the post-1990 average of 68:1. This reading suggests neither extreme undervaluation nor overvaluation based on historical norms.
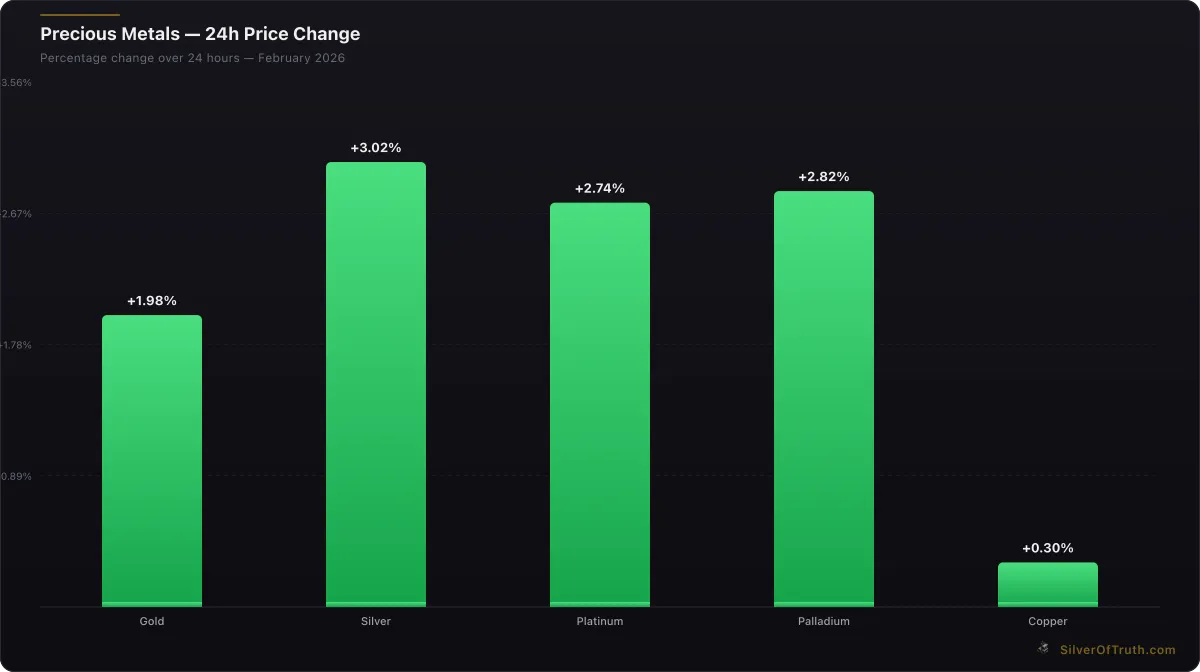
24-hour precious metals price changes. Source: SilverOfTruth, February 2026
COMEX Inventory Implications
Current COMEX silver inventory stands at 376.4 million ounces total, with registered (deliverable) inventory at 92.9 million ounces. The silver coverage ratio of 56.3% indicates moderate delivery risk, while gold's coverage ratio sits at 85.1%. This divergence suggests silver faces tighter physical markets relative to open interest.
The disparity in coverage ratios helps explain why silver often exhibits higher volatility. With less deliverable inventory relative to paper contracts, silver futures markets become more sensitive to delivery demands or supply disruptions.
For deeper insight into these warehouse dynamics, review our COMEX inventory analysis which explains how vault data influences precious metals pricing.
COT Positioning Dynamics
According to the latest CFTC Commitments of Traders report, speculative positioning differs significantly between the metals. Gold shows elevated speculative long positions at 52.6% of open interest, while silver specs hold more balanced 27.4% long exposure.
This positioning divergence suggests:
- Gold carries more speculative premium in current pricing
- Silver faces less positioning-based selling pressure
- Mean reversion could favor silver if sentiment shifts
- Commercial hedgers are less defensive in silver markets
The relatively lighter speculative load in silver creates potential upside if industrial demand accelerates or monetary demand broadens beyond gold.
Industrial Demand Considerations
Silver's industrial applications continue expanding, particularly in solar panels, electric vehicles, and 5G infrastructure. Global solar installations are projected to grow 85% by 2030, with each gigawatt requiring approximately 20 tons of silver according to industry estimates.
This structural demand growth provides fundamental support that gold lacks. While gold primarily competes with other monetary assets, silver benefits from both monetary and technological demand trends. At current ratio levels, this dual demand profile isn't fully reflected in relative pricing.
How to Interpret Ratio Signals for Investment Decisions
Successfully interpreting gold silver ratio signals requires understanding both the mathematical reading and underlying market conditions driving the relationship. Here's a framework for translating ratio data into actionable investment insights.
Ratio Ranges and Strategic Implications
| Ratio Range | Interpretation | Typical Strategy | |-------------|----------------|------------------| | Below 40 | Silver extremely overvalued | Consider silver → gold trades | | 40-60 | Silver moderately overvalued | Neutral; hold existing positions | | 60-80 | Balanced valuation | Dollar-cost average both metals | | 80-100 | Silver moderately undervalued | Begin silver accumulation | | Above 100 | Silver extremely undervalued | Aggressive silver positioning |
Timing Entry and Exit Points
Rather than trading on single ratio readings, successful strategies focus on trend changes and momentum shifts. Key signals include:
Silver Accumulation Triggers:
- Ratio rising above 80 with accelerating momentum
- Industrial demand data showing strength
- Dollar weakness supporting all precious metals
- Central bank policy turning accommodative
Profit-Taking Signals:
- Ratio declining below 60 with strong momentum
- Silver outperformance exceeding 20% versus gold
- Industrial demand showing signs of saturation
- Risk-on sentiment reducing monetary demand
Risk Management Considerations
Ratio-based strategies work best as part of broader precious metals allocation rather than concentrated bets. Key risk management principles include:
- Position Sizing: Limit ratio trades to 10-20% of precious metals holdings
- Time Horizons: Allow 12-24 months for mean reversion to develop
- Stop Losses: Consider exits if ratio moves against position by 20%
- Correlation Risk: Remember both metals often move together during crises
For investors new to precious metals positioning, our guide on how to start silver stacking with $100 provides practical implementation steps.
Advanced Ratio Analysis: Beyond Basic Calculations
Professional precious metals analysts employ sophisticated techniques beyond simple price ratios to understand gold-silver dynamics. These advanced methods provide deeper insights for serious investors.
Inflation-Adjusted Ratios
Nominal ratios can mislead during periods of high inflation or deflation. Inflation-adjusted analysis reveals whether ratio changes reflect relative metal performance or broader monetary debasement. Using 1980 as a baseline, today's ratio of 65.5 translates to approximately 45:1 in real terms, suggesting silver remains more attractive than nominal readings indicate.
Volatility-Adjusted Analysis
Silver's higher volatility means ratio movements don't always signal fundamental shifts. Volatility-adjusted ratios account for each metal's typical price swings, providing clearer signals about relative value. Current analysis suggests the ratio would need to reach 75+ to signal meaningful silver undervaluation after volatility adjustments.
Correlation Breakdown Analysis
During market stress, gold and silver correlations can break down dramatically. The 2008 financial crisis saw correlations drop to 0.3 as silver followed equity markets while gold surged. Monitoring correlation changes helps predict when ratio signals become most reliable.
Central Bank Activity Integration
Central bank gold purchases significantly impact the ratio by creating sustained demand for gold without equivalent silver buying. Countries like China and Russia have accumulated over 4,000 tons since 2010, supporting gold's monetary premium. Tracking central bank activity helps contextualize ratio movements.
Our analysis of silver versus physical alternatives explores additional factors affecting precious metals relative performance.
Regional Variations in the Gold Silver Ratio
The gold silver ratio isn't uniform globally—regional premiums, taxes, and cultural preferences create meaningful variations that savvy investors can exploit.
Eastern vs Western Markets
Asian markets, particularly China and India, show different ratio dynamics due to cultural preferences and government policies. Chinese investors traditionally favor gold for wealth preservation, while Indian markets show strong silver jewelry demand. The Shanghai Gold Exchange often trades at different implied ratios than COMEX markets.
Premium Structures and Taxes
Physical precious metals carry different premium structures that affect realized ratios:
- Silver coins typically carry higher percentage premiums (3-6% vs 1-3% for gold)
- Tax treatments vary by jurisdiction (some exempt gold but not silver)
- Storage costs favor gold due to its higher value density
- Shipping and insurance often favor gold for large positions
Currency Impact Analysis
Local currency movements significantly impact regional ratios. Emerging market currencies weakening against the dollar can drive local precious metals demand, affecting ratios differently than in dollar-denominated markets. The Turkish lira's weakness in 2021-2022 drove local gold-silver ratios to extremes as citizens fled currency debasement.
Technology and Industrial Demand Impact on Ratios
Silver's extensive industrial applications create unique demand patterns that don't affect gold, making ratio analysis more complex but potentially more rewarding for informed investors.
Emerging Technology Drivers
Several technological trends are reshaping silver demand fundamentals:
- 5G Infrastructure: Each 5G base station requires 5-10x more silver than 4G equivalents
- Electric Vehicles: Average EV uses 25-50 grams of silver versus 15 grams in traditional cars
- Solar Growth: Photovoltaic installations projected to double by 2030, requiring 200+ million ounces annually
- Medical Applications: Silver's antimicrobial properties driving growth in healthcare uses
Supply Response Limitations
Unlike gold, where mine production responds primarily to price incentives, silver production faces unique constraints:
- 70% of silver comes as byproduct from copper, lead, and zinc mines
- Primary silver mines represent only 30% of supply
- Byproduct supply depends on base metal demand, not silver prices
- This creates supply rigidity that can drive dramatic price moves
For detailed analysis of these industrial trends, see our comprehensive report on silver's growing industrial demand.
Building a Ratio-Based Investment Strategy
Successful ratio-based investing requires systematic approaches rather than reactionary trading. Here's a framework for building sustainable strategies around gold silver ratio signals.
Core Position Sizing
Establish base precious metals allocation (typically 5-20% of investment portfolio), then vary the gold-silver mix based on ratio readings:
- Ratio below 50: 70% gold, 30% silver
- Ratio 50-70: 60% gold, 40% silver
- Ratio 70-90: 50% gold, 50% silver
- Ratio above 90: 30% gold, 70% silver
Dollar-Cost Averaging with Ratio Overlay
Rather than making large ratio-based trades, use systematic accumulation with ratio-influenced weightings:
- Monthly precious metals purchases of fixed dollar amounts
- Adjust gold-silver allocation based on current ratio
- Rebalance annually or when ratio moves 10+ points
- This approach reduces timing risk while capturing long-term mean reversion
Physical vs Paper Considerations
Ratio strategies work differently across physical metals, ETFs, and mining stocks:
- Physical metals carry premiums and storage costs but provide pure exposure
- ETFs like SLV/GLD offer liquidity but may not track perfectly during stress
- Mining stocks show leveraged sensitivity but add company-specific risks
Our comparison of silver bars versus coins helps optimize physical precious metals implementation.
Frequently Asked Questions
What does a gold silver ratio of 65 mean for investors? A ratio of 65 means it takes 65 ounces of silver to equal the value of one ounce of gold. This reading sits close to the modern historical average of 68, suggesting relatively balanced valuation between the metals. Neither gold nor silver appears extremely over or undervalued at this level.
Why do investors watch the gold silver ratio so closely? The ratio helps identify relative value opportunities between the two most important precious metals. When the ratio reaches extremes (below 40 or above 100), it often signals major portfolio rebalancing opportunities. Professional traders use ratio analysis to optimize their precious metals allocations for maximum returns.
How often should I check the gold silver ratio? For long-term investors, monthly ratio monitoring is sufficient since meaningful trends develop over quarters, not days. Active traders may watch daily, but avoid overtrading on minor fluctuations. Focus on moves of 5+ points that sustain for several weeks as these indicate genuine trend changes.
What's the best ratio level to buy silver? Historical analysis suggests ratios above 80 present attractive silver accumulation opportunities, with ratios above 100 representing exceptional value. However, timing isn't everything—systematic accumulation across multiple ratio levels often outperforms attempts to time exact bottoms and tops.
Does the ratio work better for physical metals or ETFs? The ratio signals work for both physical metals and ETFs, but implementation differs. Physical metals involve premiums and storage considerations that can affect realized ratios. ETFs offer easier rebalancing but may not track perfectly during market stress. Choose the approach that matches your investment timeframe and risk tolerance.
Conclusion
Understanding what the gold silver ratio means provides precious metals investors with a powerful tool for optimizing their allocations and identifying relative value opportunities. At today's level of 65.5, the ratio suggests relatively balanced conditions, though the deeper analysis reveals silver facing tighter physical markets through lower COMEX coverage ratios and expanding industrial demand.
The key insight for investors is that ratios above 100 have historically provided exceptional silver accumulation opportunities, while ratios below 50 often signal profit-taking time. Current positioning offers neither extreme, making systematic accumulation of both metals the most prudent approach for most portfolios.
For investors ready to implement ratio-based strategies, track these critical metrics in real-time with the SilverOfTruth app—available on the App Store. Monitor COMEX inventory changes, COT positioning shifts, and precise ratio calculations to stay ahead of market-moving trends in precious metals.
Remember that the gold silver ratio represents just one tool in comprehensive precious metals analysis. Combine ratio signals with inventory data, positioning analysis, and fundamental demand trends for the most effective investment decisions in this dynamic market.
Disclaimer: This article is for informational and educational purposes only and does not constitute financial, investment, or trading advice. Past performance is not indicative of future results. Always conduct your own research and consult with a qualified financial advisor before making investment decisions. SilverOfTruth provides market data and analysis tools — it does not provide personalized financial advice.