
Silver traders faced a harsh reality check as the metal's 9.3% plunge from recent highs exposed underlying structural vulnerabilities in the COMEX futures market. With silver currently trading at $77.81 per ounce—up 2.81% in today's session but still nursing wounds from the sharp correction—attention has shifted to a critical metric flashing warning signals: the coverage ratio now sits at a concerning 52.6%, marking high-risk territory that hasn't been seen since the delivery stress episodes of early 2021.
This coverage ratio represents the relationship between total COMEX silver inventory (376.4 million ounces) and open interest obligations (715.9 million ounces), revealing a market where futures contracts significantly exceed available physical metal. For investors tracking precious metals fundamentals, understanding these dynamics becomes crucial when navigating silver market volatility and positioning for potential supply disruptions. Our comprehensive COMEX analysis hub provides the foundational knowledge needed to decode these complex market mechanics.
Quick Answer: Silver's 9.3% decline coincides with a high-risk 52.6% coverage ratio at COMEX, where 715.9 million ounces of futures obligations face only 376.4 million ounces of inventory. This ratio signals potential delivery stress similar to 2021 episodes, requiring careful monitoring of positioning changes and inventory flows.
What Does the 52.6% Coverage Ratio Actually Mean?
The COMEX coverage ratio serves as an early warning system for potential delivery squeezes, measuring how much physical inventory backs each ounce of paper obligation. At 52.6%, the current silver market means that for every two ounces of futures contracts outstanding, only slightly more than one ounce of physical silver sits in COMEX warehouses to potentially satisfy delivery demands.
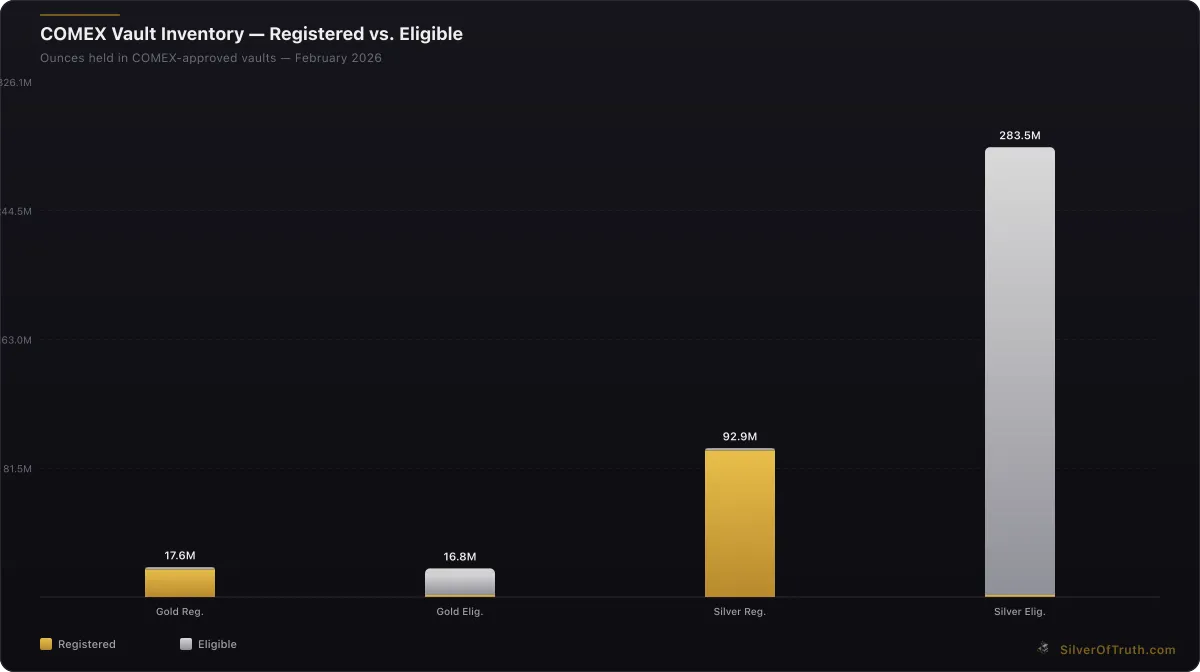
According to CME Group COMEX data, total silver inventory stands at 376.4 million ounces, comprised of 283.5 million eligible ounces and 92.9 million registered ounces. Against this backdrop, open interest of 143,180 contracts represents 715.9 million ounces of theoretical delivery obligations—each silver contract covering 5,000 ounces.
Historical analysis reveals that coverage ratios below 60% often coincide with increased market volatility and delivery activity. During March 2020's precious metals disruption, silver's coverage ratio fell below 45%, triggering a wave of delivery notices and warehouse activity that contributed to premium expansions across the physical market. The current 52.6% level places today's market uncomfortably close to that threshold.
The registered portion of inventory—metal specifically earmarked for delivery against futures contracts—tells an even more concerning story. With only 92.9 million registered ounces against 715.9 million ounces of open interest, the registered coverage ratio sits at a mere 13.0%, indicating extreme tightness in immediately deliverable supply.
How Did Recent Inventory Changes Contribute to This Risk?
COMEX silver inventory has declined 0.74% in recent sessions according to warehouse reports, with the total falling from previous levels above 380 million ounces. While this percentage change appears modest, the absolute reduction of approximately 2.8 million ounces represents significant metal leaving the system during a period of elevated open interest.
Source: SilverOfTruth COMEX data, February 2026
The inventory composition shift deserves particular attention. Eligible silver—metal stored in COMEX warehouses but not yet designated for delivery—decreased to 283.5 million ounces, while registered inventory held relatively steady at 92.9 million ounces. This pattern suggests warehouse operators are maintaining delivery-ready stocks while allowing non-designated inventory to flow out of the system.
Compared to historical norms, current inventory levels remain well below the 450+ million ounce levels seen in 2019 and early 2020. The Silver Institute's World Silver Survey consistently identifies structural supply deficits in the physical market, creating a backdrop where COMEX inventory serves as a critical buffer between paper and physical market dynamics.
Weekly patterns show inventory fluctuations have become more volatile, with larger single-day movements both into and out of warehouses. This increased volatility often signals growing arbitrage activity between COMEX and spot markets, particularly when Eastern markets like the Shanghai Gold Exchange show premium structures that encourage metal flows toward Asia.
Why Did Silver Drop 9.3% Despite Tight Physical Fundamentals?
The disconnect between silver's sharp price decline and apparently tight physical market conditions reflects the complex interplay between futures positioning, monetary policy expectations, and broader risk sentiment. According to CFTC Commitments of Traders data, speculative positioning in silver futures had reached elevated levels prior to the correction, setting up conditions for a technical washout.
Managed money positions—representing hedge funds and institutional speculators—showed net long exposure of 4,983 contracts as of the most recent COT report, with long positions at 13,189 contracts against 8,206 shorts. While this positioning appears relatively balanced compared to historical extremes, the recent reduction in total open interest by 13,457 contracts suggests profit-taking activity as leveraged players reduce exposure.
Federal Reserve policy expectations have weighed heavily on precious metals, with rising real interest rates creating headwinds for non-yielding assets like silver. Recent economic data showing persistent inflation alongside strong employment metrics has pushed back expectations for Fed rate cuts, reducing silver's appeal as an inflation hedge in the near term.
The broader commodity complex experienced selling pressure as well, with industrial metals facing demand concerns related to slowing Chinese economic growth. Silver's dual nature as both precious and industrial metal makes it particularly vulnerable to these cross-currents, explaining why it can experience sharp declines even when physical market fundamentals appear supportive.
What Are the Implications for Delivery Activity?
Standing for delivery against COMEX silver futures requires traders to take physical possession of 5,000-ounce contracts, a process that directly tests the relationship between paper and physical markets. Current delivery activity remains relatively quiet with minimal monthly volumes, but the tight coverage ratio suggests this equilibrium could shift rapidly.
Historical precedent shows that delivery stress often emerges gradually before accelerating. During the March 2020 episode, delivery notices initially remained within normal ranges before spiking as spreads between futures and spot markets widened beyond arbitrage thresholds. The current 52.6% coverage ratio places the market within striking distance of similar dynamics.
Registered inventory availability becomes crucial during delivery periods, as only these 92.9 million ounces can immediately satisfy contract obligations without requiring eligible-to-registered conversions. The conversion process typically takes several days and requires warehouse operators to verify metal quality and documentation, creating potential bottlenecks during periods of elevated demand.
International arbitrage opportunities could accelerate delivery activity if Eastern premiums continue expanding. Shanghai Gold Exchange silver premiums have shown periodic spikes above London spot prices, creating incentives for metal to flow from COMEX warehouses toward Asian markets through the delivery mechanism.
How Does COT Positioning Data Inform Current Risk Assessment?
The latest CFTC Commitments of Traders report reveals a silver market in transition, with positioning dynamics that could either exacerbate or mitigate delivery pressures. Commercial traders—typically including mining companies, refiners, and large dealers—hold net short positions of 45,725 contracts, representing their natural hedging activity against physical silver operations.
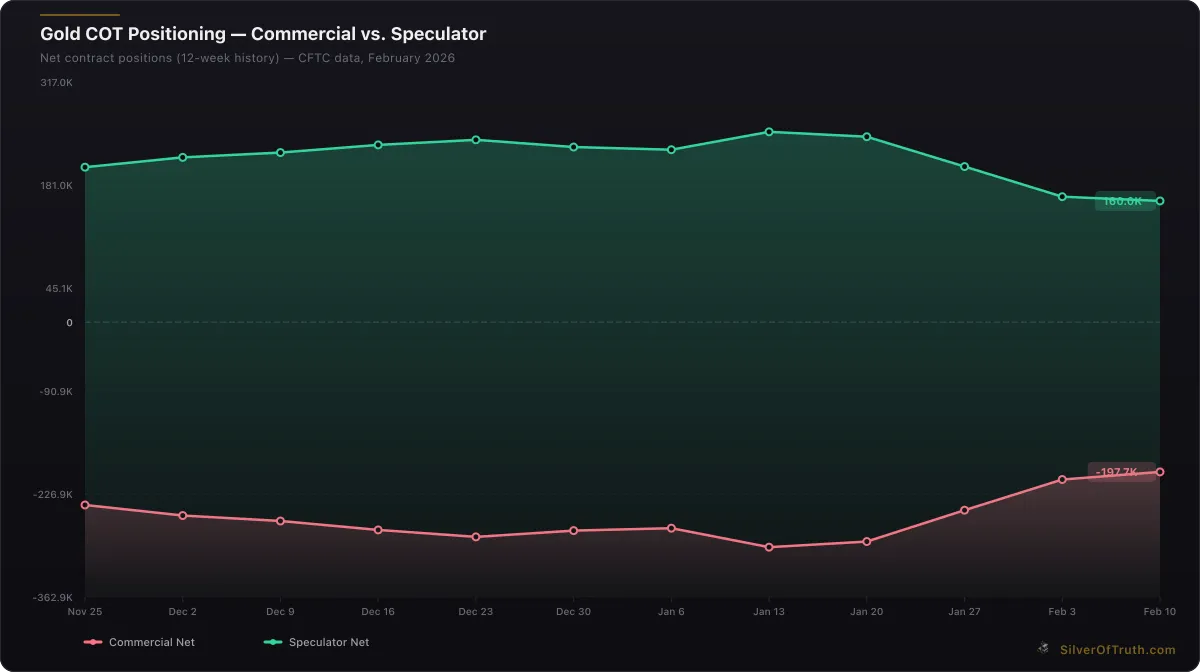
Gold COT positioning: commercial hedgers (red) vs. speculators (green). Source: CFTC via SilverOfTruth, February 2026
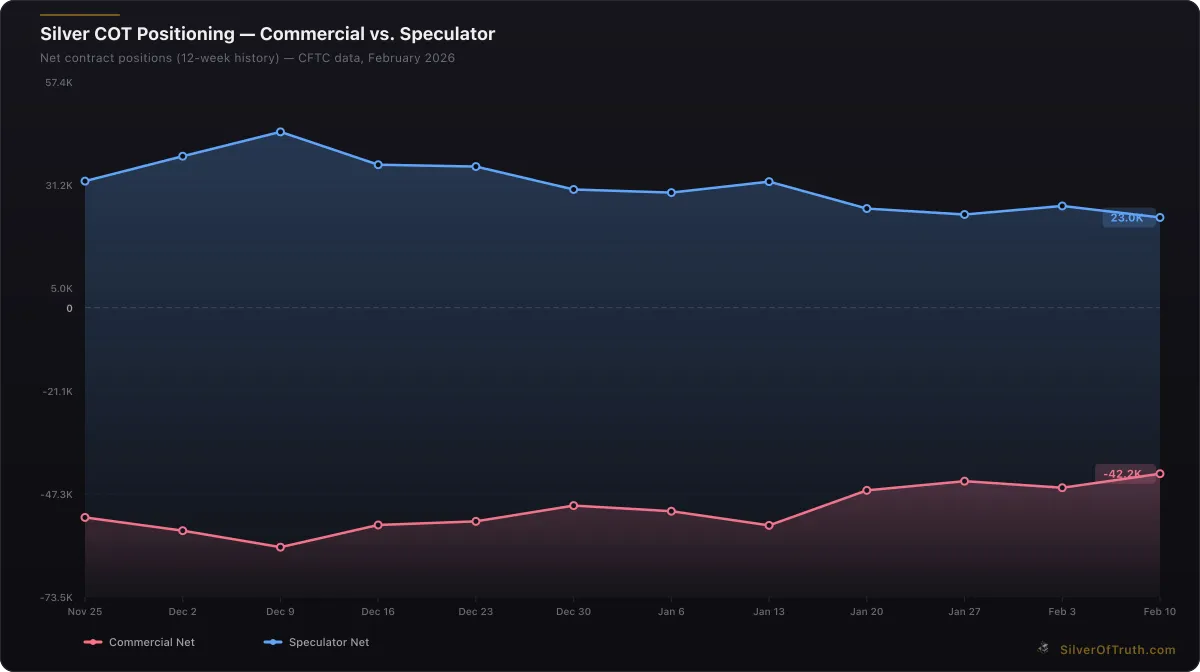
Silver COT positioning: commercial hedgers (red) vs. speculators (blue). Source: CFTC via SilverOfTruth, February 2026
Swap dealers, often acting as intermediaries for larger institutional clients, maintain significant net short exposure at 27,458 contracts. This positioning typically reflects the dealer community's role in facilitating client exposure to silver while hedging their own inventory risk. The concentration data shows the top four short traders control 35.6% of total short interest, indicating meaningful position concentration that could influence delivery decisions.
Non-commercial speculators hold net long positions of 25,877 contracts, a relatively modest exposure compared to historical peaks above 40,000 contracts. This positioning suggests speculative interest remains measured rather than euphoric, potentially reducing the risk of massive position liquidation that could trigger cascade selling.
The weekly changes in positioning reveal reduced activity across categories, with open interest declining 13,457 contracts. This reduction in total market interest often occurs during periods of uncertainty, as both speculators and hedgers reduce exposure until clearer directional signals emerge.
What Do Historical Coverage Ratio Episodes Teach Us?
Previous periods of low COMEX silver coverage ratios provide valuable insights into potential market evolution. The most relevant comparison comes from March 2020, when pandemic-related disruptions coincided with coverage ratios falling below 45% and triggered unprecedented delivery activity and premium expansion.
During that episode, silver delivery notices increased dramatically as arbitrage opportunities emerged between COMEX futures and spot markets. Physical premiums expanded from typical levels around $2-3 per ounce to peaks exceeding $8-10 per ounce for retail products, while industrial users faced supply disruptions that persisted for months.
The 2008 financial crisis provides another instructive example, when coverage ratios declined amid broader market stress and prompted significant delivery activity. However, that episode differed in key respects, as it occurred during a period of economic contraction rather than the current environment of persistent inflation and supply chain stress.
More recent episodes in 2021 showed how coverage ratio concerns could contribute to sustained premium expansion even without dramatic delivery spikes. The mere perception of potential supply tightness proved sufficient to influence pricing across the precious metals complex, suggesting current conditions warrant careful monitoring regardless of immediate delivery activity.
Which Factors Could Trigger Coverage Ratio Improvement?
Several scenarios could alleviate current coverage ratio pressure and reduce delivery squeeze risks. Increased silver inflows to COMEX warehouses represent the most direct solution, typically occurring when spot premiums in other markets decline relative to futures prices, making COMEX storage economically attractive.
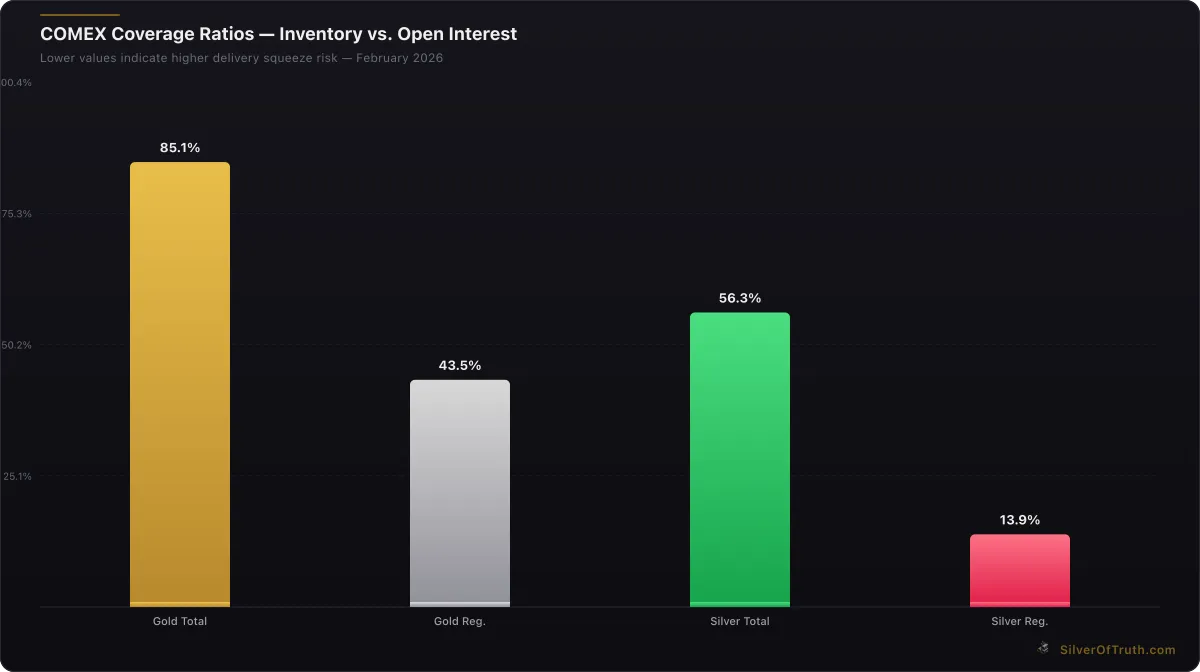
COMEX coverage ratios — lower values indicate higher delivery squeeze risk. Source: SilverOfTruth, February 2026
Reduction in open interest through position liquidation or cash settlement could also improve the ratio by decreasing the denominator in the coverage calculation. Recent weeks have shown some movement in this direction, with total open interest declining from higher levels, though further reduction would require either speculative selling or commercial hedge unwinding.
Mining company delivery activity could provide additional registered inventory, as producers occasionally choose to deliver metal against short hedge positions rather than purchasing offsetting contracts. However, this mechanism typically operates gradually rather than providing immediate relief during periods of acute stress.
International flow dynamics could shift in COMEX's favor if Eastern market premiums compress or Western investment demand increases. The global precious metals arbitrage system constantly rebalances metal between regions based on relative pricing, and shifts in these flows directly impact COMEX inventory levels.
What Should Investors Monitor Going Forward?
The current high-risk coverage ratio demands ongoing attention to several key indicators that could signal either escalation or resolution of delivery pressures. Daily warehouse reports provide the most immediate data on inventory changes, with particular focus on movements in registered stocks that directly impact delivery capability.
Weekly COT reports offer insights into positioning changes that could influence delivery decisions, especially any significant shifts in commercial or swap dealer activity that might indicate physical market stress. The concentration ratios deserve attention as well, since highly concentrated short positions could create delivery bottlenecks if major holders choose to stand for delivery.
Real-time monitoring of silver premiums across different markets and products provides early warning signals for physical supply stress. Expanding premiums for retail products, industrial forms, or international markets often precede more dramatic COMEX developments by several weeks.
Our COMEX inventory tracker provides daily updates on these critical metrics, while the COT dashboard offers comprehensive positioning analysis to help investors navigate these complex market dynamics.
FAQ
What is a COMEX silver coverage ratio? The coverage ratio measures total COMEX silver inventory against open interest obligations, expressed as a percentage. A 52.6% ratio means inventory covers about half of all outstanding futures contracts, with lower ratios indicating higher delivery squeeze risk.
Why does the coverage ratio matter for silver prices? Low coverage ratios signal potential physical supply constraints that could trigger delivery pressure, premium expansion, and price volatility. Historical episodes below 60% have often coincided with significant market disruptions and sustained premium increases.
How quickly can coverage ratios change? Coverage ratios can shift rapidly due to daily inventory flows and changes in open interest. Large single-day movements in either direction are possible, particularly during periods of elevated arbitrage activity or position liquidation.
What happens if the coverage ratio falls further? Further declines could trigger increased delivery notices, warehouse activity, and premium expansion across physical silver markets. Extreme scenarios might involve significant supply disruptions similar to those experienced in March 2020.
Can individual investors benefit from coverage ratio analysis? Understanding coverage ratios helps investors time physical purchases, assess delivery squeeze risks, and position for potential premium expansion. However, these indicators should be combined with broader fundamental and technical analysis.
The current silver market presents a complex risk profile where declining prices coexist with tight physical market fundamentals and elevated delivery squeeze potential. As explored throughout our COMEX Explained learning hub, these dynamics require sophisticated analysis that goes beyond simple price movements to encompass inventory, positioning, and delivery mechanisms. Investors can track these critical developments real-time through the SilverOfTruth app, available on the App Store for comprehensive precious metals market intelligence.
Sources
- CME Group COMEX Data: https://www.cmegroup.com/markets/metals.html
- CFTC Commitments of Traders Reports: https://www.cftc.gov/dea/futures/other_lf.htm
- Silver Institute World Silver Survey: https://www.silverinstitute.org
- LBMA Price and Data: https://www.lbma.org.uk/prices-and-data
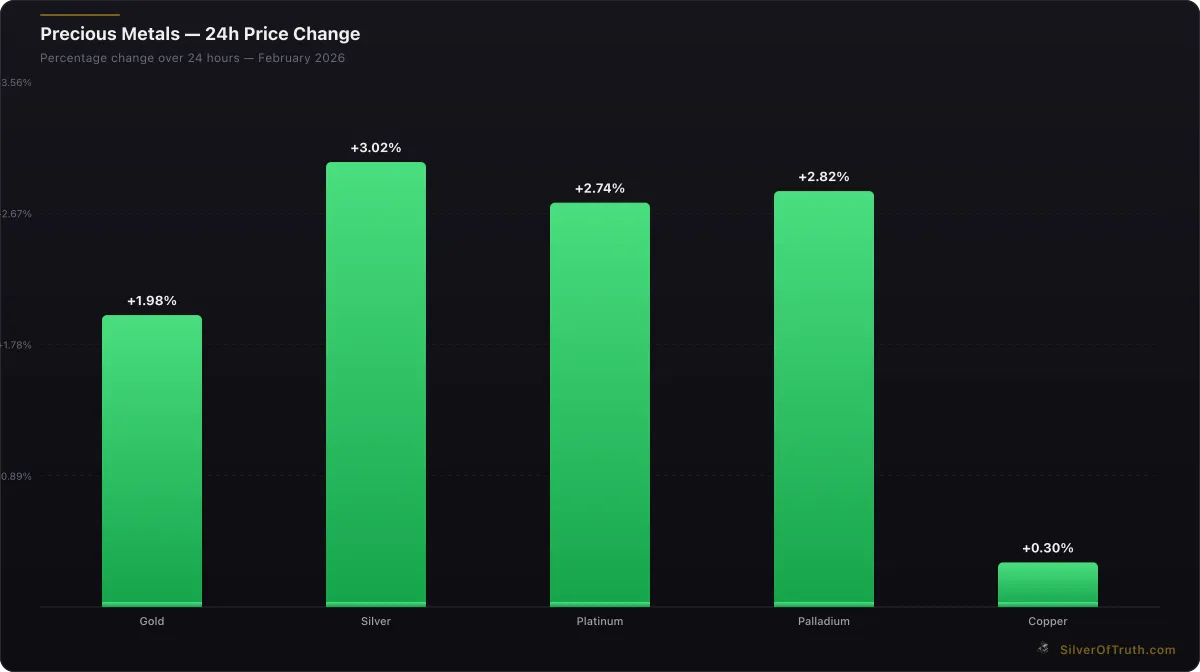
24-hour precious metals price changes. Source: SilverOfTruth, February 2026
Disclaimer: This article is for informational and educational purposes only and does not constitute financial, investment, or trading advice. Past performance is not indicative of future results. Always conduct your own research and consult with a qualified financial advisor before making investment decisions. SilverOfTruth provides market data and analysis tools — it does not provide personalized financial advice.