
COMEX open interest reveals the true commitment level behind silver futures markets — and understanding this metric can give you crucial insights into market sentiment and potential price movements that casual investors miss. Unlike trading volume, which simply counts transactions, open interest measures the total number of outstanding contracts that haven't been closed or delivered, making it one of the most critical indicators for serious precious metals investors. When open interest rises, new money enters the market; when it falls, participants exit positions. This creates patterns that reveal delivery pressure, institutional positioning, and some of the most important trading opportunities in silver markets.
What Is COMEX Open Interest?
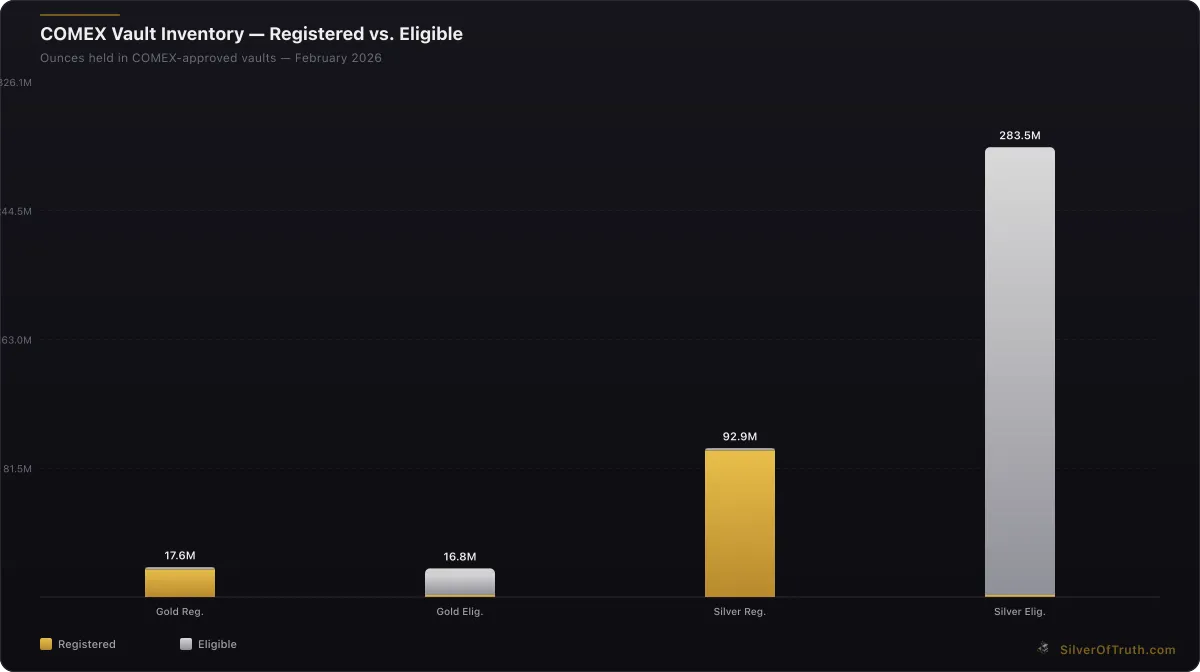
Open interest represents the total number of outstanding futures contracts that remain active in the market. Each COMEX silver futures contract controls 5,000 ounces, so the current open interest of 133,641 contracts equals 668,205,000 ounces of silver exposure.
Source: SilverOfTruth COMEX data, February 2026
Here's how open interest changes throughout the trading day:
- New long and short positions created: Open interest increases by one contract
- Existing position transferred: Open interest stays the same
- Long and short positions closed: Open interest decreases by one contract
The key difference between open interest and volume is commitment. Volume measures activity — how many contracts traded hands. Open interest measures commitment — how many contracts represent actual market positions that must eventually be closed or delivered.
According to the CME Group COMEX data, silver open interest typically ranges from 100,000 to 200,000 contracts depending on market conditions. The current level of 133,641 contracts sits in the moderate range, suggesting neither extreme speculation nor complete disinterest.
Open Interest vs Physical Inventory
The relationship between open interest and physical COMEX inventory creates the coverage ratio — a critical risk metric for delivery squeeze potential. With 133,641 contracts outstanding and only 376.4 million ounces of total COMEX silver inventory, the coverage ratio stands at 56.3%.
More importantly, only 92.9 million ounces are registered (available for delivery), creating a registered coverage ratio of just 13.9%. This means there's only enough registered silver to cover 13.9% of outstanding contracts if everyone demanded delivery — a scenario that highlights potential supply stress.
To understand these inventory categories better, read our complete guide to COMEX registered vs eligible inventory.
How Open Interest Affects Silver Prices
Open interest influences silver prices through three primary mechanisms: leverage amplification, sentiment indication, and delivery pressure.
Leverage Amplification
Rising open interest typically amplifies price movements in both directions. When new money enters the market (increasing open interest), it creates additional buying or selling pressure beyond what existing participants generate. This leverage effect means:
- Bull markets with rising open interest: Prices tend to accelerate higher as new longs enter
- Bear markets with rising open interest: Prices can fall faster as new shorts accumulate
- Price moves with falling open interest: Often signal exhaustion or position liquidation
Sentiment Indication
The direction of open interest changes reveals market sentiment:
| Open Interest Change | Price Action | Market Sentiment | |---|---|---| | Rising | Rising | Strong bullish - New long positions | | Rising | Falling | Strong bearish - New short positions | | Falling | Rising | Weak bullish - Short covering | | Falling | Falling | Weak bearish - Long liquidation |
Current silver markets show falling open interest (-9,539 contracts weekly) with rising prices (+2.1% to $77.27), indicating weak bullish sentiment driven primarily by short covering rather than fresh buying interest.
Delivery Pressure
High open interest relative to physical inventory creates potential delivery stress. The CFTC COT report data shows that commercial participants (producers and dealers) currently hold net short positions of -42,163 contracts, while speculators maintain net longs of +22,955 contracts.
If a significant portion of long positions demanded physical delivery, it could create supply pressure since registered inventory covers only 13.9% of outstanding contracts. This dynamic becomes critical near contract expiration dates when positions must be rolled forward or settled.
Rising Open Interest: What It Means
Rising open interest indicates new money entering the silver futures market. This fresh participation typically signals:
Strong Directional Conviction
When open interest rises alongside price increases, it suggests genuine bullish conviction rather than just short covering. New buyers are entering the market, willing to take long positions at current price levels.
Similarly, rising open interest during price declines indicates strong bearish sentiment, with new short positions being established. This pattern often precedes significant price moves as fresh capital commits to a directional view.
Increased Market Liquidity
Higher open interest generally improves market liquidity by providing more potential counterparties for trades. This typically results in:
- Tighter bid-ask spreads
- Better price discovery
- Reduced slippage on larger orders
- More efficient market function
Potential for Greater Volatility
More open positions mean more participants with exposure to price changes. This can amplify volatility in both directions, as larger numbers of traders react to market developments.
For precious metals investors, rising open interest often coincides with periods of heightened macro uncertainty, geopolitical tensions, or monetary policy shifts that drive both institutional and retail interest in silver as a hedge.
Falling Open Interest: What It Signals
Declining open interest suggests market participants are reducing their futures exposure. This typically occurs during:
Position Liquidation
Falling open interest often accompanies profit-taking or loss-cutting by existing position holders. When prices reach significant technical levels or fundamental catalysts change, traders close positions rather than establish new ones.
The current silver market exemplifies this dynamic, with open interest down 9,539 contracts weekly while prices rise 2.1%. This pattern suggests short covering rather than new buying interest — a less sustainable form of price support.
Market Exhaustion
Declining open interest can signal the end of major price moves. When fewer participants want to establish new positions, it often indicates:
- Bull markets may be reaching exhaustion if longs stop entering
- Bear markets may be bottoming if shorts stop accumulating
- Consolidation phases where neither bulls nor bears have strong conviction
Reduced Delivery Risk
From a supply/demand perspective, falling open interest reduces potential delivery pressure on COMEX warehouses. Fewer outstanding contracts mean less potential demand for physical metal if positions are held to expiration.
However, the coverage ratio remains critical. Even with falling open interest, silver's 13.9% registered coverage ratio still represents elevated delivery risk compared to historical norms.
Open Interest and COT Analysis
The Commitment of Traders (COT) report provides detailed breakdowns of who holds open interest positions, offering crucial insights into market sentiment and positioning.
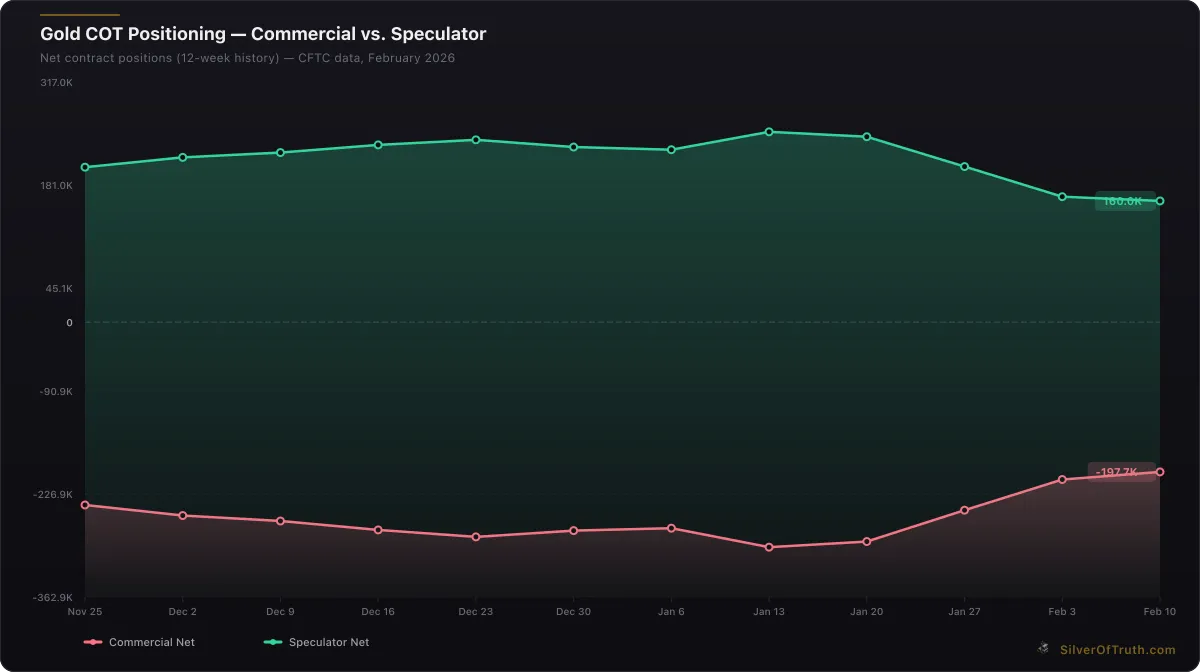
Gold COT positioning: commercial hedgers (red) vs. speculators (green). Source: CFTC via SilverOfTruth, February 2026
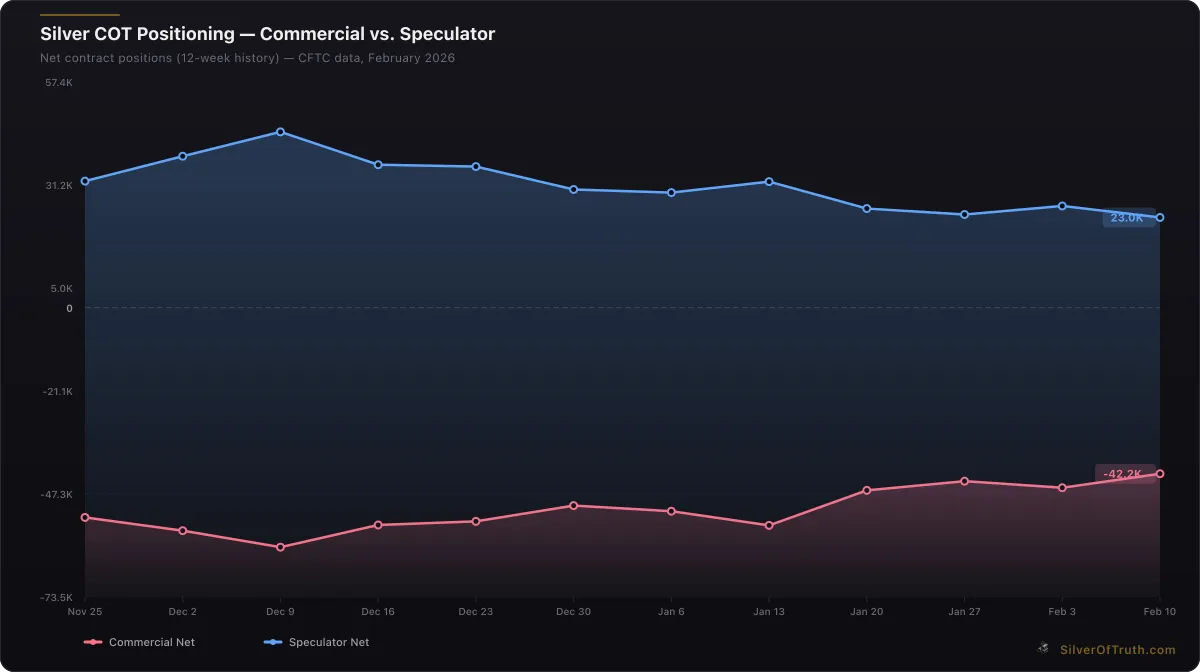
Silver COT positioning: commercial hedgers (red) vs. speculators (blue). Source: CFTC via SilverOfTruth, February 2026
Commercial vs Speculative Positioning
According to the latest COT data, silver open interest breaks down as:
- Commercials (Producers/Dealers): Net short -42,163 contracts (59.5% short, 27.9% long)
- Non-commercials (Large Specs): Net long +22,955 contracts (27.4% long, 10.3% short)
- Non-reportables (Small Specs): Net long +19,208 contracts
This positioning reveals moderate commercial hedging pressure — producers and dealers maintaining short hedges against future production or inventory. Speculative positioning remains relatively balanced compared to extreme levels often seen at major market turns.
For detailed COT analysis techniques, see our comprehensive guide to understanding COT reports.
Managed Money Positioning
Hedge funds and managed money accounts currently hold net long positions of just +4,569 contracts — significantly lower than their typical exposure during major silver moves. This suggests institutional money remains largely on the sidelines, potentially providing dry powder for future moves.
The concentration data shows top 4 traders control 33.7% of short positions and 20.2% of long positions, indicating moderate concentration risk. This isn't extreme, but large position changes by major players could still impact prices significantly.
Historical Context
Comparing current positioning to historical extremes:
| Positioning Extreme | Commercial Net | Spec Net | Typical Market Action | |---|---|---|---| | Bullish Extreme | -80,000+ | +80,000+ | Major bottoms, buying opportunities | | Bearish Extreme | +20,000+ | -20,000+ | Major tops, distribution | | Current Level | -42,163 | +22,955 | Neutral positioning |
Current positioning sits in neutral territory, suggesting silver could move in either direction based on fundamental developments rather than positioning extremes forcing price action.
Coverage Ratios and Delivery Risk
The relationship between open interest and physical inventory creates the coverage ratio — one of the most important risk metrics in COMEX markets.
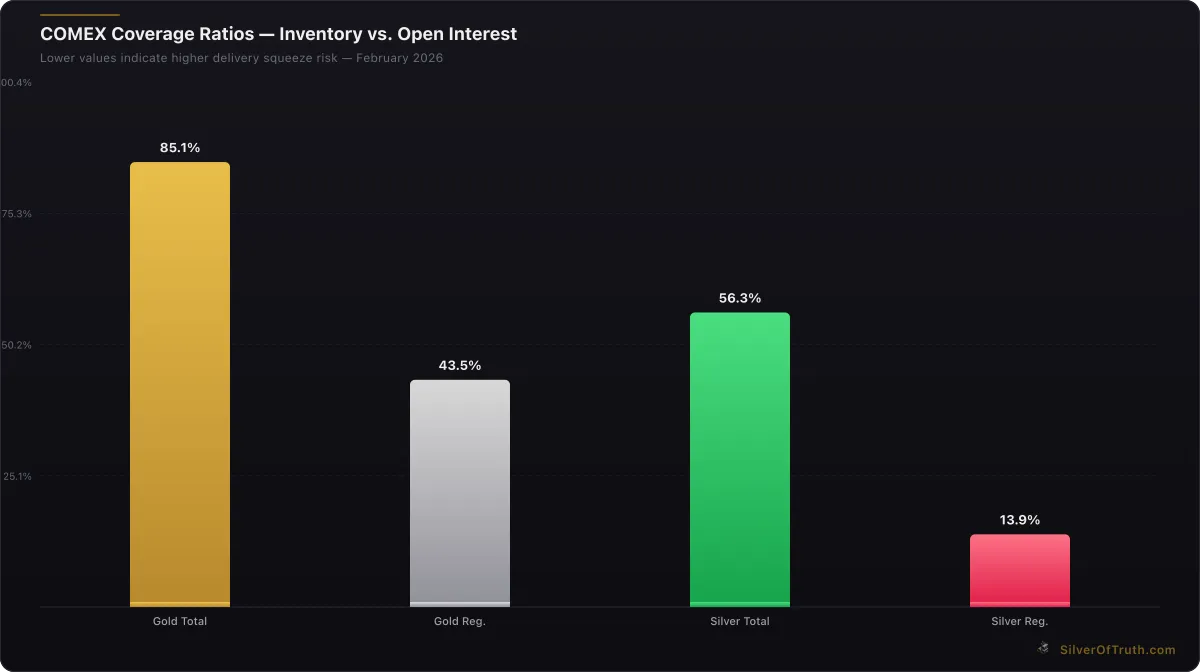
COMEX coverage ratios — lower values indicate higher delivery squeeze risk. Source: SilverOfTruth, February 2026
Understanding Coverage Ratios
Total Coverage Ratio: 56.3% (376.4M oz inventory ÷ 668.2M oz open interest) Registered Coverage Ratio: 13.9% (92.9M oz registered ÷ 668.2M oz open interest)
The registered coverage ratio of 13.9% represents elevated delivery risk. Historical analysis shows delivery stress typically emerges when registered coverage falls below 20%, and acute shortages occur below 10%.
Historical Coverage Analysis
| Period | Registered Coverage | Market Action | Outcome | |---|---|---|---| | March 2020 | 8.5% | Delivery stress, premium spikes | Hunt Brothers-style squeeze | | September 2019 | 15.2% | Increased volatility | Managed through inventory additions | | Current | 13.9% | Elevated but manageable | Risk monitoring required |
The current 13.9% coverage sits in the cautionary range. While not immediately critical, it represents elevated risk that could quickly deteriorate if either open interest rises or registered inventory falls further.
For detailed coverage ratio analysis, read our delivery squeeze risk assessment.
Supply Response Mechanisms
When coverage ratios decline, several mechanisms typically respond:
- Inventory Additions: Refiners and dealers add metal to warehouses
- Position Rolling: Longs roll to deferred contracts rather than take delivery
- Cash Settlement: Some contracts settle financially rather than physically
- Premium Adjustments: Physical premiums rise to encourage supply
Understanding these mechanisms helps investors anticipate market responses to delivery pressure and identify opportunities in both futures and physical markets.
Real-World Open Interest Examples
Case Study: March 2020 Silver Squeeze
During the COVID-19 market disruption, silver open interest spiked to over 180,000 contracts while registered inventory plummeted to just 90 million ounces — creating an 8.5% coverage ratio. This extreme imbalance led to:
- Physical premiums spiking from $2/oz to $8+/oz over spot
- Futures backwardation as near-term contracts traded above deferred months
- Delivery notices surging as institutions demanded physical metal
- Price volatility increasing dramatically as supply constraints emerged
The situation resolved only when refiners worked overtime to replenish COMEX warehouses, demonstrating how extreme coverage ratios create real supply stress.
Case Study: 2019-2021 Bull Market
Silver's rise from $12 to $30 occurred alongside steadily rising open interest, from roughly 120,000 to 200,000+ contracts. This pattern indicated genuine new buying interest rather than just technical short covering.
The sustained open interest growth provided fuel for the multi-year bull run, as fresh capital continued entering long positions even at higher price levels. This contrasts with short-term rallies driven purely by short covering, which typically show falling open interest.
Case Study: Current Market Dynamics
Today's falling open interest (-9,539 contracts) amid rising prices (+2.1%) suggests the recent silver rally is primarily driven by short covering rather than fresh buying. While this can continue in the near term, sustained bull markets typically require rising open interest to confirm new money entering.
The 13.9% registered coverage ratio adds complexity — while current positioning doesn't suggest extreme bullishness, the tight physical supply situation could amplify any shift toward delivery demand.
Monitoring Open Interest for Trading
Successful precious metals traders monitor open interest changes to:
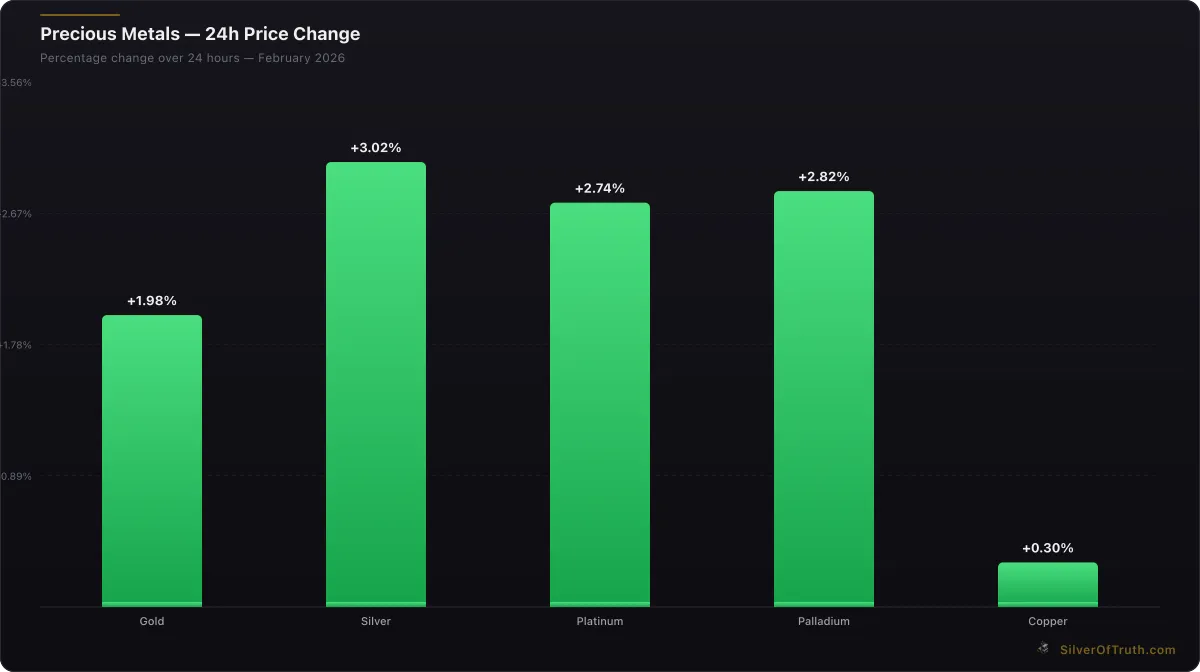
24-hour precious metals price changes. Source: SilverOfTruth, February 2026
Identify Market Phases
- Accumulation: Rising open interest with sideways prices
- Markup: Rising open interest with rising prices
- Distribution: Falling open interest with rising prices
- Decline: Rising open interest with falling prices
Time Entry Points
Open interest extremes often precede significant price moves:
- Very high open interest: Often marks major tops as maximum participants are positioned
- Very low open interest: May signal major bottoms as disinterest reaches extremes
- Rapidly rising open interest: Indicates strong momentum likely to continue
- Rapidly falling open interest: Suggests current moves may be ending
Assess Risk/Reward
Coverage ratios help evaluate delivery risk and potential supply squeezes. When registered coverage falls below 15%, the risk/reward profile for long positions improves significantly due to squeeze potential.
For practical application of these concepts, explore our comprehensive COMEX inventory tracking guide.
Open Interest Data Sources
Accurate open interest data comes from several authoritative sources:
CME Group (Primary Source)
The CME Group COMEX data provides real-time open interest updates throughout the trading session. This official source includes:
- Contract-by-contract open interest breakdown
- Historical data going back multiple years
- Integration with volume and price data
CFTC COT Reports
The CFTC Commitments of Traders reports break down open interest by participant category:
- Commercial vs non-commercial positions
- Managed money positioning
- Concentration data showing largest participants
- Released every Friday covering Tuesday's positions
Financial Data Providers
Professional platforms like Bloomberg, Reuters, and specialized precious metals services aggregate open interest data with additional analytics and historical context.
For retail investors, SilverOfTruth consolidates these sources into a unified dashboard that tracks open interest alongside inventory data, creating the coverage ratios essential for delivery risk analysis.
FAQ: COMEX Open Interest Explained
What does rising COMEX open interest mean for silver prices?
Rising open interest typically indicates new money entering the market, which amplifies price movements. If open interest rises with prices, it suggests strong bullish conviction from fresh buying. If open interest rises while prices fall, it indicates new short positions and bearish sentiment. Rising open interest generally supports sustained price trends in either direction.
How does open interest differ from trading volume?
Open interest measures outstanding contracts that remain active, while volume counts all transactions. Volume shows activity level, but open interest shows commitment. For example, if 10,000 contracts trade but only create 5,000 new positions, volume is 10,000 but open interest increases by only 5,000. Open interest better indicates market sentiment and potential price pressure.
What is a dangerous coverage ratio for COMEX silver?
Registered coverage ratios below 20% historically indicate elevated delivery risk, while levels below 10% signal acute shortage potential. The current 13.9% sits in the cautionary range. The March 2020 silver squeeze occurred at 8.5% coverage, creating severe supply stress and premium spikes. Monitoring this ratio helps anticipate delivery pressure.
Why do professionals track open interest changes?
Open interest changes reveal market sentiment and positioning shifts that volume alone cannot show. Rising open interest with rising prices indicates strong bull markets, while falling open interest with rising prices suggests weak rallies driven by short covering. This insight helps traders time entries, exits, and assess trend sustainability.
How often does COMEX publish open interest data?
CME Group updates open interest data daily after market close, showing the number of outstanding contracts as of the end of the trading session. The CFTC releases detailed positioning breakdowns every Friday in the COT report, covering Tuesday's data. Real-time open interest estimates are available during trading hours through professional data feeds.
Conclusion
COMEX open interest provides crucial insight into silver market dynamics that price alone cannot reveal. The current level of 133,641 contracts represents moderate positioning, neither extremely bullish nor bearish. However, the 13.9% registered coverage ratio creates elevated delivery risk that could amplify price moves if positioning shifts.
Understanding open interest changes helps investors distinguish between strong trend moves (rising open interest) and technical corrections (falling open interest). The relationship between open interest and physical inventory creates the coverage ratios that professional traders monitor for delivery squeeze potential.
Recent data showing falling open interest with rising prices suggests the current silver rally is primarily driven by short covering rather than fresh buying interest. While this can continue near-term, sustained bull markets typically require rising open interest to confirm new money entering positions.
Track live COMEX open interest and inventory data in the SilverOfTruth app — available on the App Store. Our unified dashboard combines open interest monitoring with real-time coverage ratio calculations, helping you identify delivery risk and positioning extremes that create the best precious metals trading opportunities.
Disclaimer: This article is for informational and educational purposes only and does not constitute financial, investment, or trading advice. Past performance is not indicative of future results. Always conduct your own research and consult with a qualified financial advisor before making investment decisions. SilverOfTruth provides market data and analysis tools — it does not provide personalized financial advice.