
While silver has surged 2.81% to $77.81 in recent trading, the broader context reveals concerning structural weaknesses that preceded this recovery. The metal's sharp volatility, including a brutal -9.1% plunge that caught many investors off guard, exposes critical risks brewing within COMEX's delivery infrastructure. With silver's coverage ratio sitting at a precarious 52.6%—firmly in high-risk territory—the interplay between inventory constraints and speculative positioning demands immediate attention from precious metals investors.
For comprehensive background on COMEX mechanics and inventory tracking, explore our detailed COMEX Explained hub, which provides essential context for understanding these market dynamics.
Quick Answer: Silver's recent -9.1% plunge reflects underlying stress from COMEX's high-risk 52.6% coverage ratio, where total inventory barely covers half of outstanding futures contracts. This structural weakness, combined with declining registered stocks and elevated speculative positioning, creates vulnerability to delivery squeezes and continued price volatility.
What Triggered Silver's Sharp Price Volatility?
The precious metals complex has experienced extraordinary volatility, with silver bearing the brunt of selling pressure despite today's 2.81% recovery to $77.81. The metal's recent -9.1% plunge represents more than routine profit-taking—it signals deeper structural concerns about market liquidity and delivery capacity within the COMEX system.
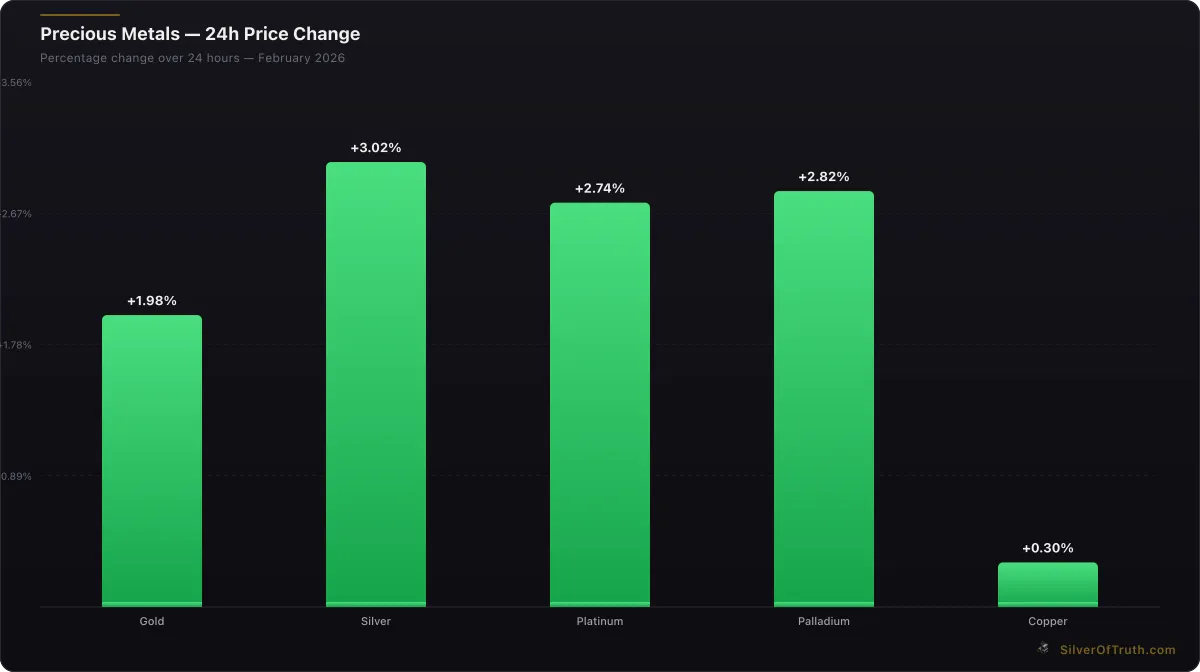
24-hour precious metals price changes. Source: SilverOfTruth, February 2026
Current market data reveals silver trading with a 24-hour range from $73.745 to $79.265, highlighting the extreme intraday volatility that has become characteristic of today's precious metals environment. This price action coincides with a broader precious metals rally, where gold has gained 2.18% to $5,056.40 and platinum has surged 3.13% to $2,085.
The volatility stems from multiple converging factors: deteriorating COMEX inventory fundamentals, shifting speculative positioning, and broader macroeconomic pressures affecting precious metals demand. According to the latest CFTC Commitments of Traders data, silver positioning shows commercial net shorts of -45,725 contracts against speculative net longs of +25,877 contracts, creating tension between producer hedging and investment demand.
How Critical Is COMEX Silver's 52.6% Coverage Ratio?
COMEX silver's coverage ratio stands at 52.6%, placing it firmly in high-risk territory where total inventory barely exceeds half of outstanding futures contracts. This metric, calculated by dividing total inventory (376.4 million ounces) by open interest equivalent (715.9 million ounces), reveals a market operating with minimal safety margins.
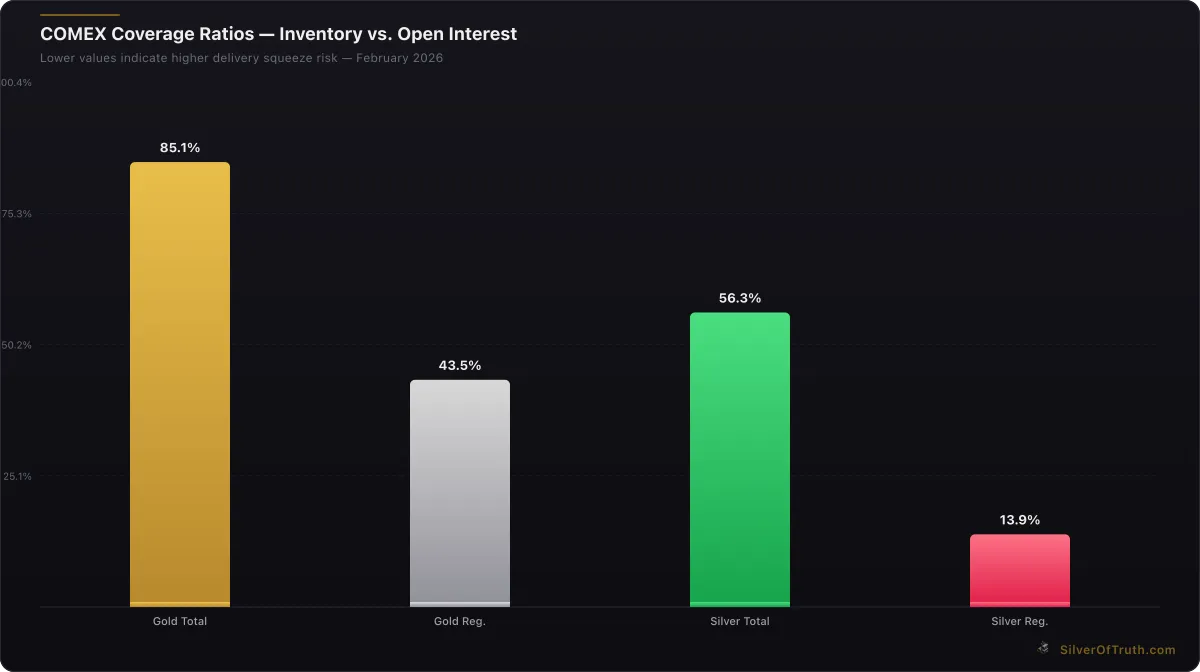
COMEX coverage ratios — lower values indicate higher delivery squeeze risk. Source: SilverOfTruth, February 2026
The registered coverage ratio presents an even more alarming picture at just 12.98%, meaning deliverable stocks cover only about one-eighth of potential delivery demands. With registered inventory at 92.9 million ounces against 143,180 contracts of open interest, the market faces severe constraints if delivery intentions accelerate.
Historical analysis shows coverage ratios below 60% often precede delivery stress episodes. The March 2020 silver squeeze saw registered coverage fall below 15%, triggering premium explosions and delivery delays across the physical market. Current levels mirror those conditions, suggesting elevated risk of supply disruptions.
Track these critical metrics in real-time using our COMEX Inventory Tracker, which provides live updates on vault holdings and coverage ratios across all precious metals.
What Do COMEX Inventory Trends Signal?
COMEX silver inventory shows concerning deterioration patterns that amplify delivery risks. Total inventory decreased 0.74% to 376.4 million ounces, with the decline concentrated in deliverable registered stocks rather than eligible holdings. This distribution suggests market participants are converting registered metal to eligible status—removing it from immediate deliverability.
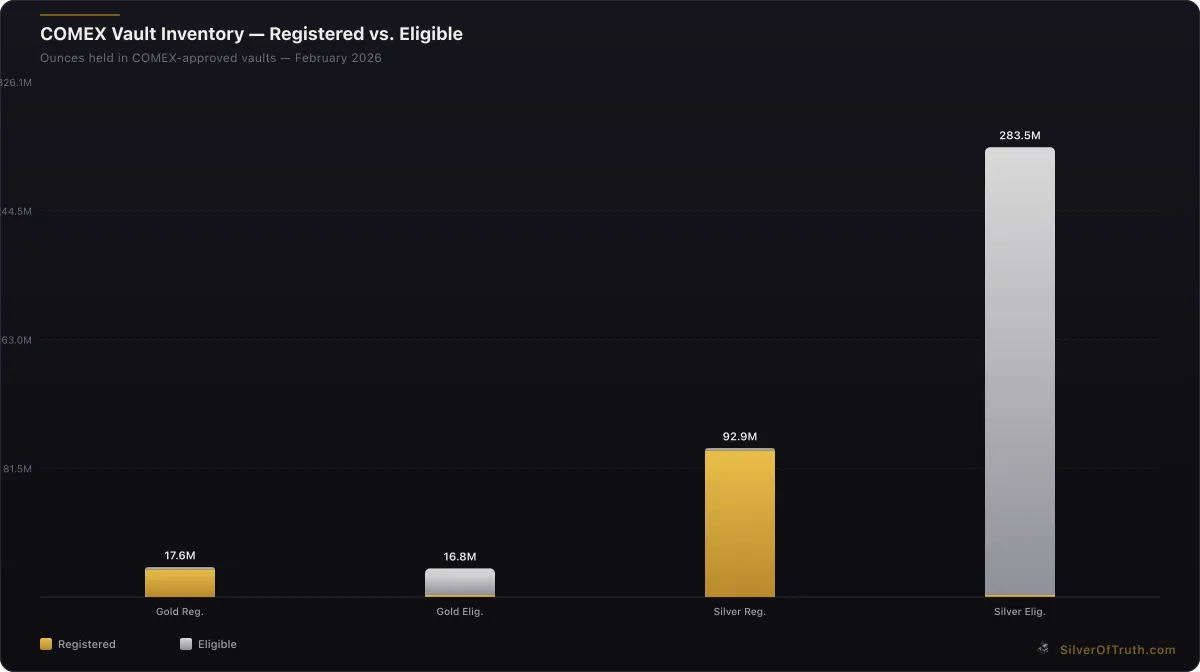
Source: SilverOfTruth COMEX data, February 2026
The inventory composition breakdown reveals eligible stocks at 283.5 million ounces versus registered at 92.9 million ounces, a ratio of approximately 3:1. This imbalance indicates substantial metal remains in COMEX warehouses but outside the delivery system, creating artificial scarcity in deliverable supplies despite seemingly adequate total holdings.
Weekly inventory flows show persistent drainage from registered categories, with vault operators reporting steady conversion activity. Unlike gold, where registered and eligible levels maintain relative stability, silver exhibits one-directional flow from registered to eligible status—a pattern historically associated with tightening physical markets.
The CME Group's official warehouse reports confirm these trends, showing net outflows from major depositories including JPMorgan Chase, HSBC, and Brink's facilities. When combined with elevated open interest levels, these inventory dynamics create conditions ripe for delivery complications.
How Are Speculative Positions Influencing Silver Markets?
COT positioning data reveals a market caught between commercial hedging pressure and speculative demand, with implications for near-term price action. Commercial traders hold net short positions of -45,725 contracts (24.6% long, 56.6% short), representing producer hedging and dealer inventory management activities.
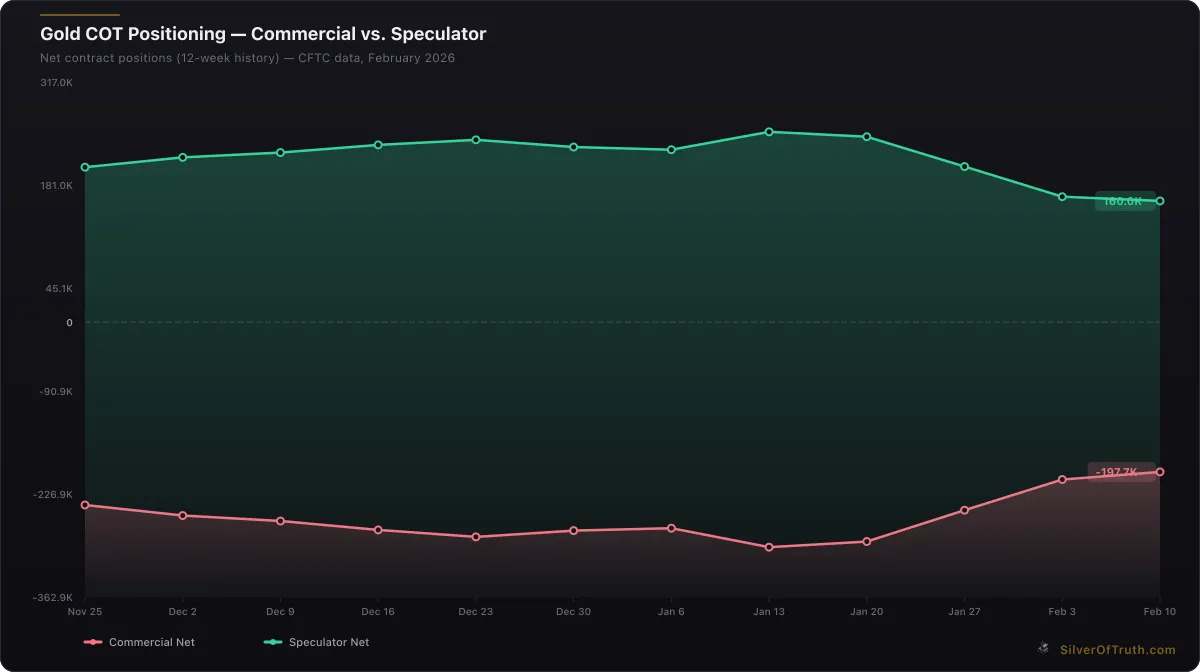
Gold COT positioning: commercial hedgers (red) vs. speculators (green). Source: CFTC via SilverOfTruth, February 2026
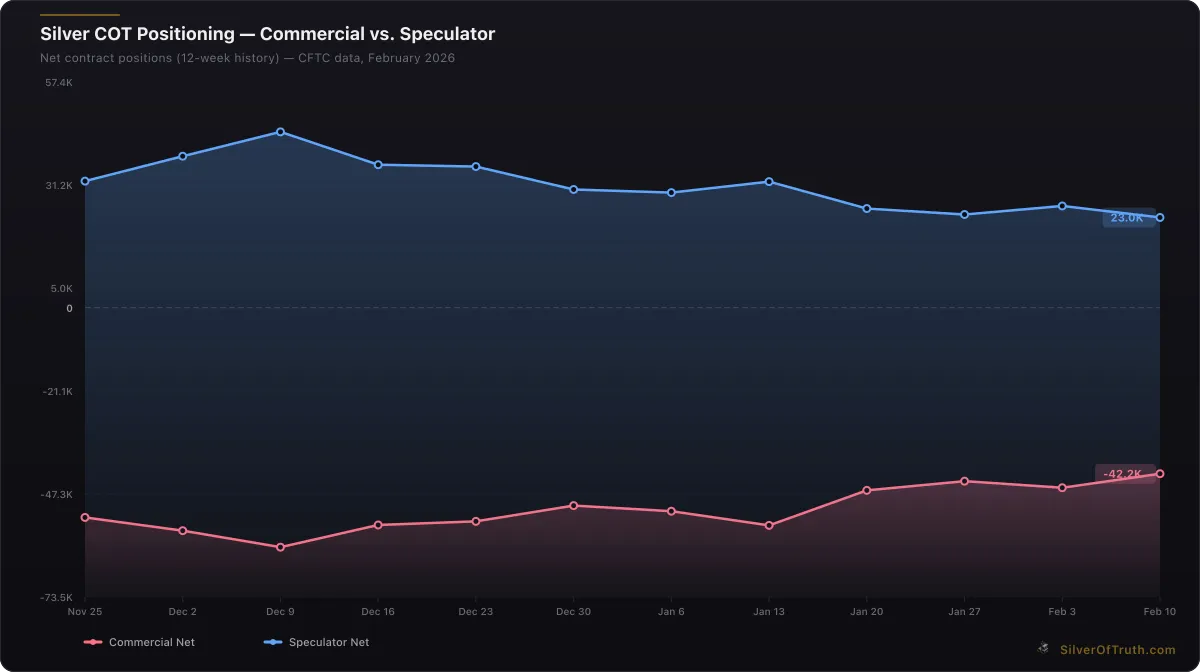
Silver COT positioning: commercial hedgers (red) vs. speculators (blue). Source: CFTC via SilverOfTruth, February 2026
Managed money accounts show net long exposure of +4,983 contracts, a relatively modest position compared to historical extremes. However, the broader non-commercial category maintains net long positions of +25,877 contracts, indicating continued investment interest despite recent volatility.
The concentration data highlights potential vulnerability, with the top 4 short holders controlling 35.6% of short open interest compared to 22.6% for the top 4 long holders. This concentration on the short side creates potential for rapid short covering if delivery pressures emerge.
Recent positioning changes show managed money reducing net longs by 2,716 contracts while commercial shorts increased modestly. This positioning adjustment suggests professional traders are becoming more cautious about silver's near-term prospects, particularly given inventory constraints.
Why Does Silver's Coverage Ratio Matter More Than Gold's?
Silver's coverage ratio demands greater attention than gold's due to fundamental differences in market structure, industrial demand, and storage economics. While gold maintains an 84% coverage ratio with medium risk classification, silver's 52.6% ratio reflects unique supply-demand dynamics that create amplified volatility.
Industrial silver consumption accounts for approximately 50% of annual demand according to Silver Institute data, creating baseline demand that must be satisfied regardless of price. This industrial floor means silver inventory drawdowns have immediate real-world consequences beyond financial market speculation.
Storage and handling differences also matter. Silver's bulk-to-value ratio makes warehouse management more complex and expensive than gold, encouraging conversion from registered to eligible status when storage costs exceed carrying benefits. This dynamic explains why silver registered inventories decline more persistently than gold.
Market size disparities amplify these effects. Silver's futures market represents a larger multiple of annual mine production compared to gold, meaning inventory constraints have proportionally greater impact on market function. When 715.9 million ounces of open interest faces only 376.4 million ounces of total inventory, small changes in supply or demand create outsized price movements.
What Historical Precedents Exist for Current Conditions?
Current silver market conditions echo several historical episodes where inventory constraints triggered significant price movements and market disruptions. The March 2020 delivery squeeze provides the most relevant comparison, when registered coverage fell to 14% and spot premiums exploded above $8 per ounce.
The 2008 financial crisis offers another parallel, when COMEX silver inventory declined 40% over six months as investors converted paper positions to physical holdings. During this period, registered stocks fell below 30 million ounces while open interest remained above 100,000 contracts, creating severe delivery pressure.
More recently, the 2021 retail silver squeeze demonstrated how social media-driven demand could stress the delivery system even with adequate total inventory. Reddit's WallStreetSilver movement drove registered coverage below 20%, forcing COMEX to implement delivery delays and premium adjustments.
These historical episodes share common characteristics with today's market: declining registered inventory, elevated open interest, and external factors driving physical demand. Each case resulted in significant price volatility and temporary market dysfunction until supply-demand imbalances resolved.
How Should Investors Navigate High-Risk Coverage Conditions?
Investors facing high-risk coverage ratios must adapt strategies to account for potential delivery disruptions and heightened volatility. Physical silver holders benefit from current conditions, as inventory constraints support premium expansion and supply tightness. However, futures traders face elevated execution risks and potential delivery complications.
Portfolio allocation becomes critical when coverage ratios signal delivery stress. Diversification across physical holdings, mining equities, and ETF exposure helps mitigate concentration risk while maintaining precious metals exposure. Our Mining Stock Analysis hub provides frameworks for evaluating silver producers during volatile periods.
Position sizing requires extra caution when markets operate with minimal safety margins. High-risk coverage ratios amplify both upside and downside moves, making aggressive leverage dangerous even for experienced traders. Conservative position sizing with tight risk management becomes essential.
Timing strategies should account for delivery calendar effects, as coverage ratios matter most during active delivery months (March, May, July, September, December). Inventory stress typically peaks during these periods when contract holders must decide between cash settlement and physical delivery.
Calculate optimal position sizes and risk exposure using our Stack Value Calculator, which helps determine appropriate allocation levels based on coverage ratio conditions and personal risk tolerance.
What Are the Broader Market Implications?
Silver's inventory crisis extends beyond COMEX to influence global precious metals markets, industrial supply chains, and investment flows. When the world's largest silver futures market operates with minimal safety margins, price discovery becomes distorted and volatility spreads across related assets.
Industrial users face particular challenges, as silver's essential role in electronics, solar panels, and medical devices creates inflexible demand. Coverage ratio deterioration signals potential supply disruptions that could force manufacturers to adjust production schedules or seek alternative materials.
Mining companies benefit from inventory stress through improved pricing power and margin expansion. Junior silver miners with near-term production profiles become particularly attractive as delivery constraints support premium valuations. However, these same conditions can disrupt hedging strategies for larger producers.
Investment flows show rotation toward physical assets when paper markets show stress. ETF premiums expand, coin dealer inventories tighten, and retail premiums increase—all symptoms of investors seeking alternatives to potentially unreliable futures markets.
What Should Investors Monitor Going Forward?
Several key indicators deserve close attention as silver's coverage crisis evolves. Weekly registered inventory changes provide the most sensitive early warning system, as sustained declines below current levels would push coverage into extreme territory.
COT positioning shifts offer crucial insights into professional trader sentiment. Increased commercial short covering or managed money long liquidation could signal capitulation, while stable or growing speculative positions suggest continued confidence despite inventory concerns.
Delivery notices and stops provide direct evidence of market stress. Any acceleration in delivery intentions relative to historical norms would confirm that inventory constraints are binding market function rather than representing theoretical concerns.
Premium spreads between futures and physical markets indicate real-world supply tightness. Widening spreads suggest paper markets are becoming disconnected from physical reality—a pattern that typically precedes significant price adjustments.
Monitor these critical developments using our COT Dashboard, which tracks positioning changes and delivery activity across precious metals markets.
FAQ
Q: What exactly is a coverage ratio and why does it matter? A: Coverage ratio measures total COMEX inventory divided by open interest equivalent, showing how much physical metal backs outstanding futures contracts. Ratios below 60% indicate high delivery risk, as insufficient inventory exists to satisfy potential delivery demands.
Q: How does silver's 52.6% coverage ratio compare historically? A: Silver's current 52.6% coverage ratio matches levels seen during previous market stress episodes, including March 2020 (14%) and the 2008 financial crisis (25%). These periods were characterized by significant price volatility and delivery complications.
Q: Should investors avoid silver futures when coverage ratios are high-risk? A: High-risk coverage ratios increase execution risk and potential delivery complications in futures markets. Investors should consider reduced position sizes, tighter risk management, and diversification across physical holdings and mining equities.
Q: What triggers the conversion of registered to eligible silver inventory? A: Warehouse operators convert registered to eligible status based on storage economics, customer demands, and delivery logistics. Rising storage costs, customer requests, and anticipated delivery activity all influence these conversion decisions.
Q: How long do high-risk coverage conditions typically persist? A: Historical episodes suggest high-risk coverage conditions can persist for several months until new supply enters the market, speculative positioning adjusts, or industrial demand moderates. Resolution typically requires significant price adjustment to balance supply and demand.
For deeper insights into silver market fundamentals and investment strategies, visit our comprehensive Silver Investing hub, which covers everything from basic stacking principles to advanced market analysis.
Track silver's ongoing coverage ratio crisis and position yourself strategically with the SilverOfTruth app—available on the App Store for real-time COMEX inventory monitoring and delivery risk assessment.
Sources
- CFTC Commitments of Traders Reports: https://www.cftc.gov/dea/futures/other_lf.htm
- CME Group COMEX Warehouse Reports: https://www.cmegroup.com/markets/metals.html
- Silver Institute Market Analysis: https://www.silverinstitute.org
- World Gold Council Data: https://www.gold.org/goldhub/data
Disclaimer: This article is for informational and educational purposes only and does not constitute financial, investment, or trading advice. Past performance is not indicative of future results. Always conduct your own research and consult with a qualified financial advisor before making investment decisions. SilverOfTruth provides market data and analysis tools — it does not provide personalized financial advice.