
Silver traders are witnessing a critical juncture as COMEX silver inventory contracts by 1.2% while the coverage ratio hovers at a concerning 52.6%. This combination of declining warehouse stocks and elevated open interest creates a powder keg scenario that demands immediate attention from precious metals investors. The current inventory stands at 376.4 million ounces against 715.9 million ounces in open interest obligations, marking one of the most precarious supply-demand imbalances in recent memory.
For comprehensive understanding of COMEX mechanics and inventory tracking, explore our COMEX Explained hub for foundational knowledge on warehouse operations and delivery processes.
Quick Answer: COMEX silver inventory declined 1.2% to 376.4M oz while maintaining a high-risk 52.6% coverage ratio against 715.9M oz open interest. This imbalance signals potential delivery squeeze risks, requiring investors to monitor registered inventory levels and positioning changes closely for strategic precious metals allocation decisions.
What Does the -1.2% COMEX Silver Inventory Decline Signal?
The recent 1.2% contraction in COMEX silver inventory represents more than a statistical blip—it's a structural warning sign that sophisticated investors cannot ignore. According to CME Group COMEX data, total silver inventory now stands at 376.4 million ounces, down from higher levels that provided more substantial coverage against futures obligations.
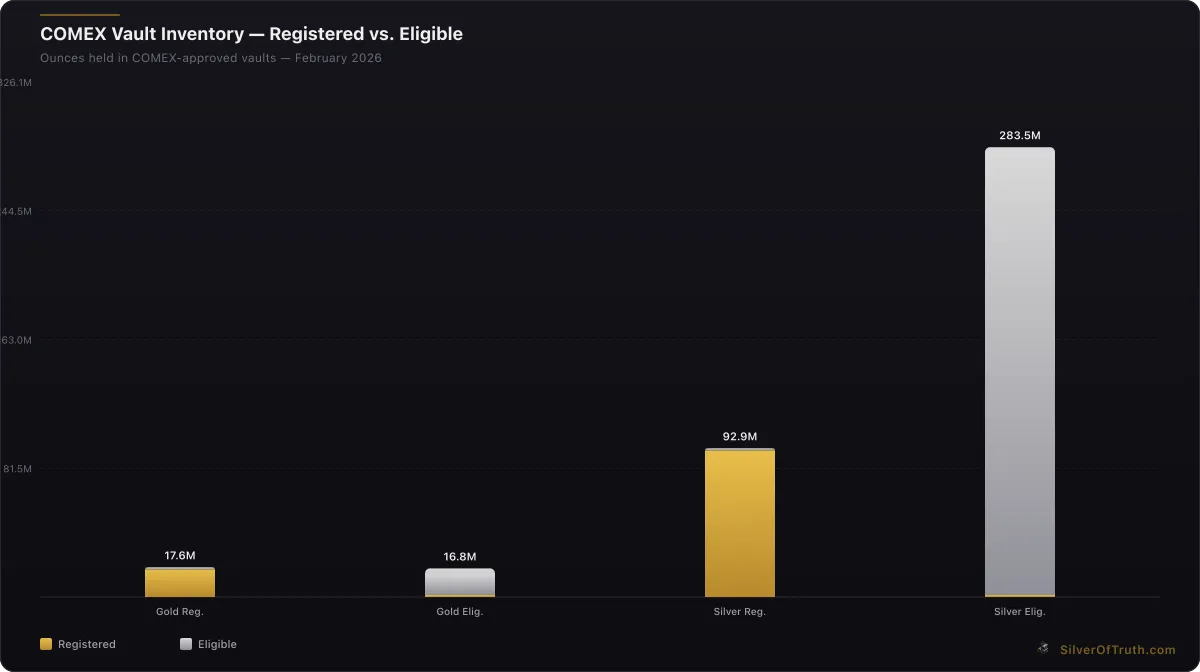
Source: SilverOfTruth COMEX data, February 2026
This decline occurs against a backdrop of registered inventory at just 92.9 million ounces, representing the portion immediately available for delivery. The eligible inventory of 283.5 million ounces requires conversion processes that may not occur rapidly during delivery stress periods. Historical precedent shows that during the March 2020 market disruption, similar inventory-to-open interest imbalances triggered significant price volatility and delivery complications.
The velocity of this decline matters as much as the magnitude. A sustained 1.2% weekly drawdown would exhaust current inventory levels within two years, assuming no replenishment. More critically, if registered inventory continues declining at current rates while open interest remains elevated, the coverage ratio could breach the 50% threshold that historically coincides with delivery squeeze concerns.
Understanding these inventory dynamics becomes crucial when evaluating whether current silver prices at $77.81 per ounce adequately reflect underlying supply tensions. The World Gold Council and Silver Institute data suggest industrial demand continues accelerating, particularly from solar panel manufacturing and electric vehicle applications, creating additional pressure on already strained warehouse stocks.
Why Is the 52.6% Coverage Ratio Raising Red Flags?
The coverage ratio calculation divides total COMEX inventory by open interest obligations, creating a crucial metric for delivery risk assessment. At 52.6%, silver's coverage ratio sits precariously close to levels that historically trigger market stress. Compare this to gold's more comfortable 84% coverage ratio, highlighting silver's unique vulnerability among precious metals.
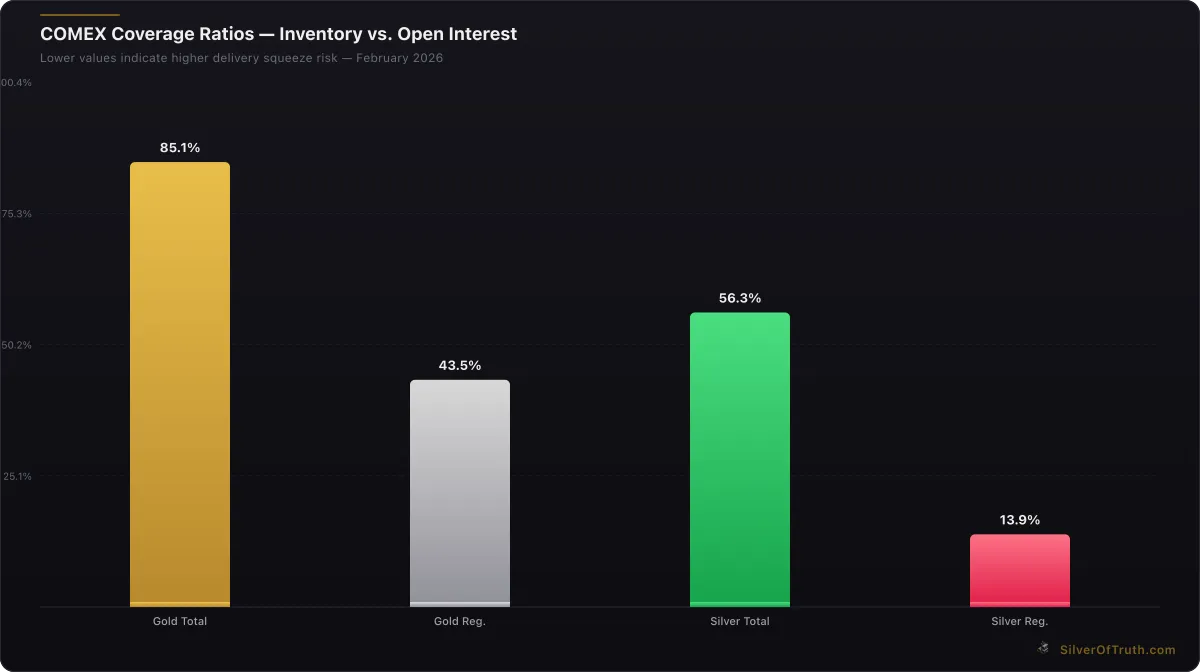
COMEX coverage ratios — lower values indicate higher delivery squeeze risk. Source: SilverOfTruth, February 2026
Industry veterans recall the Hunt Brothers silver corner attempt in 1980, when coverage ratios fell below 40% and triggered extraordinary price volatility. While current market structure differs significantly from the 1980s, the fundamental physics of supply and demand remain unchanged—insufficient inventory relative to contract obligations creates upward price pressure through delivery dynamics.
The mathematical reality is stark: 715.9 million ounces of open interest against 376.4 million ounces of total inventory creates a 1.9:1 obligation-to-supply ratio. This means nearly two ounces of futures contracts exist for every ounce in COMEX warehouses. When investors demand physical delivery instead of cash settlement, this ratio becomes problematic quickly.
Recent CFTC COT report data shows commercial short positions remain elevated while managed money maintains substantial long exposure. This positioning structure amplifies delivery risks, as commercials typically prefer cash settlement while money managers increasingly seek physical allocation. The intersection of high open interest and declining inventory creates what options traders would recognize as a "gamma squeeze" scenario in physical markets.
Monitoring coverage ratios in real-time becomes essential for positioning decisions. Our COMEX Inventory Tracker provides live updates on these critical metrics, enabling investors to track inventory changes and coverage ratio movements as they develop.
How Do Current Positioning Patterns Amplify Risk?
CFTC Commitment of Traders data reveals positioning dynamics that exacerbate the inventory-coverage tension. Commercial hedgers hold net short positions of -45,725 contracts (80,973 short vs 35,248 long), representing 56.6% of total open interest on the short side. This heavy commercial short positioning typically indicates producer hedging and financial institution derivatives exposure rather than speculative betting.
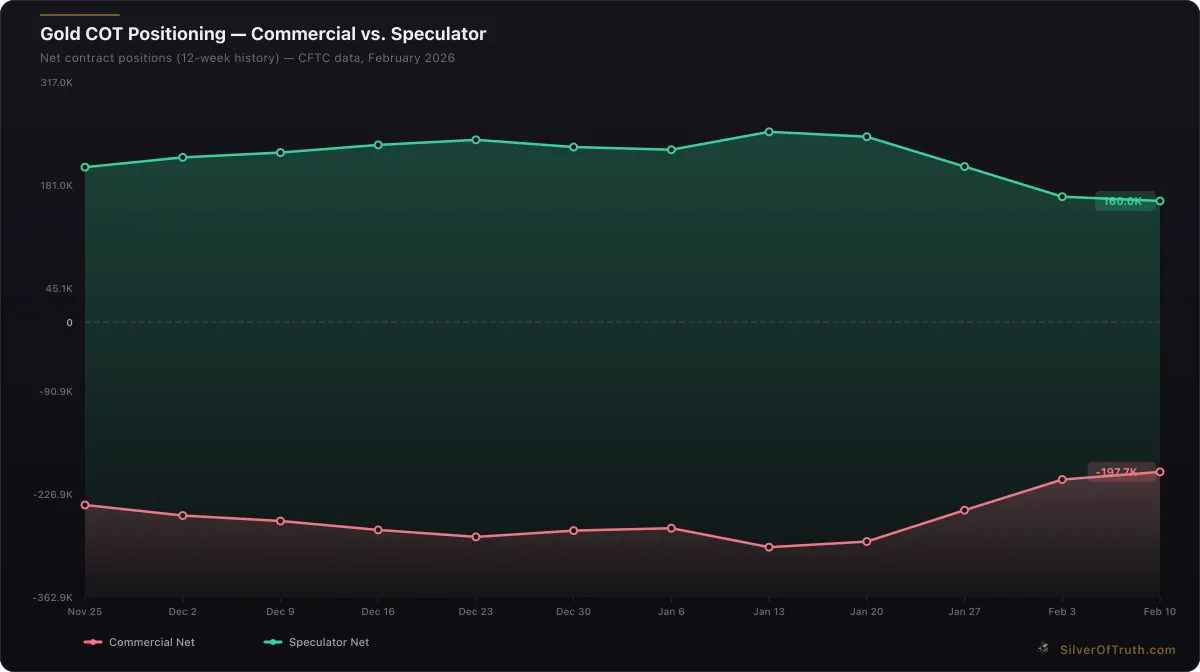
Gold COT positioning: commercial hedgers (red) vs. speculators (green). Source: CFTC via SilverOfTruth, February 2026
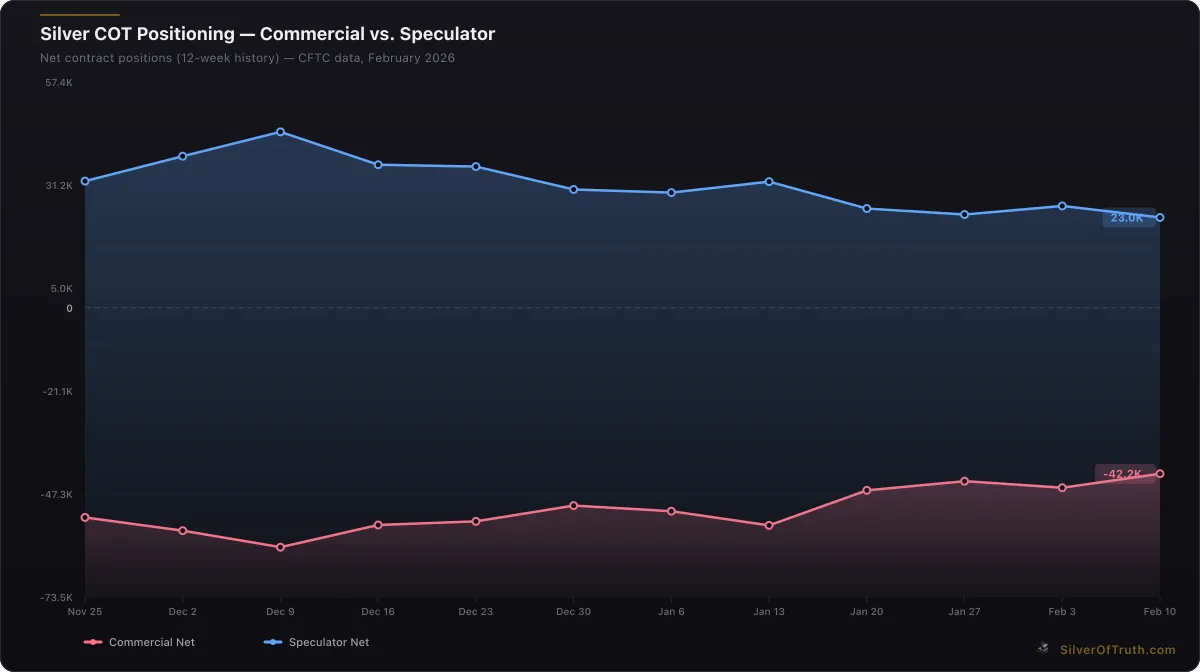
Silver COT positioning: commercial hedgers (red) vs. speculators (blue). Source: CFTC via SilverOfTruth, February 2026
Meanwhile, non-commercial speculators maintain a more balanced 25,877 net long position, with managed money funds holding modest net exposure. The relatively balanced speculative positioning suggests current price levels haven't yet triggered the aggressive long accumulation that characterized previous silver rallies. This positioning structure creates asymmetric risk—if industrial demand or investment flows increase, limited speculative positioning provides little buffer against delivery pressures.
The concentration data adds another layer of concern. The top four short traders control 35.6% of short positions while the top eight hold 48.6%. This concentration means a small number of entities bear substantial delivery obligations should contracts proceed to physical settlement. Historical analysis shows that high concentration coincides with increased volatility during delivery periods, as concentrated short holders may need to source physical metal rapidly.
Swap dealer positioning shows net short exposure of -27,458 contracts, suggesting financial institutions are providing liquidity to long-side demand while potentially lacking corresponding physical inventory. This creates what market structure analysts term "basis risk"—the potential for futures prices to disconnect from physical metal availability.
Understanding these positioning patterns helps explain why the coverage ratio matters more than absolute inventory levels. Even if total inventory remained stable, shifting positioning toward physical delivery preference could strain the system rapidly. Our COT Dashboard tracks these positioning changes weekly, enabling investors to monitor sentiment shifts before they impact delivery dynamics.
What Historical Precedents Guide Current Risk Assessment?
Examining past episodes of low coverage ratios provides crucial context for current conditions. The March 2020 market disruption offers the most recent parallel, when silver coverage ratios fell below 45% amid pandemic-driven supply chain disruptions and safe-haven demand. During that period, COMEX silver prices spiked from $12 to over $29 within months, partly driven by delivery concerns and warehouse access limitations.
The 2008 financial crisis provides another reference point, when silver coverage ratios declined to approximately 40% as investors fled paper assets for physical metals. That episode saw silver prices initially fall with broader markets before rallying sharply as delivery tensions emerged. The pattern suggests coverage ratios below 50% create nonlinear risk-reward profiles where small inventory changes trigger disproportionate price responses.
More dramatically, the 1980 Hunt Brothers silver corner demonstrated extreme scenarios when coverage ratios approach 30%. While regulatory changes since 1980 make similar corners unlikely, the fundamental supply-demand mechanics remain relevant. When physical inventory cannot satisfy delivery obligations, prices must rise sufficiently to either attract new supply or discourage delivery demands.
Recent episodes in other commodities provide additional context. Nickel's March 2022 London Metal Exchange crisis, where inventory shortages triggered unlimited price spikes and trading suspensions, illustrates how modern markets remain vulnerable to supply-demand imbalances despite sophisticated risk management systems.
The common thread across historical precedents is that coverage ratios below 50% create option-like payoff structures—small probability of extreme outcomes that traditional risk models underestimate. Current silver conditions echo these historical warning signs, suggesting investors should position for potential nonlinear outcomes rather than assuming normal market behavior continues.
For deeper historical analysis of COMEX delivery episodes, our guide to COMEX delivery processes explores how past crises unfolded and their implications for current market structure.
How Should Investors Navigate High-Risk Coverage Scenarios?
Strategic positioning during high-risk coverage periods requires balancing opportunity with prudent risk management. The asymmetric risk profile—limited downside from current levels versus significant upside potential during delivery stress—suggests consideration of convexity-seeking strategies rather than directional bets.
Physical silver allocation becomes increasingly attractive as coverage ratios decline. Unlike futures contracts that may settle in cash during delivery stress, physical holdings provide direct exposure to supply-demand imbalances. However, premiums over spot prices typically rise during inventory stress, requiring careful timing of physical accumulation strategies.
Mining equities offer leveraged exposure to silver price movements while providing natural inflation hedging through rising production values. However, mining companies face operational risks independent of silver prices, requiring careful fundamental analysis beyond commodity exposure. Our mining stock analysis hub provides frameworks for evaluating mining investment opportunities during precious metals volatility.
Options strategies merit consideration for investors seeking defined risk exposure to potential delivery squeezes. Long call options on silver futures or silver ETFs provide leveraged upside participation with limited downside risk, though time decay and volatility changes affect option values independently of underlying silver moves.
Portfolio allocation decisions should account for correlation risks during market stress. Silver often exhibits heightened correlation with broader financial markets during crisis periods, potentially reducing diversification benefits when most needed. Historical analysis suggests maintaining position sizes that remain comfortable even if silver temporarily moves against fundamental expectations.
Risk management becomes paramount given the binary nature of delivery scenarios—either inventory concerns resolve peacefully, or they trigger significant price dislocations. Position sizing should reflect this uncertainty, with allocations that allow investors to benefit from favorable outcomes without jeopardizing overall portfolio objectives if scenarios unfold differently than expected.
What Economic Factors Could Trigger Delivery Stress?
Multiple economic catalysts could transform the current high-risk coverage scenario into actual delivery tensions. Federal Reserve policy remains a primary catalyst, as interest rate decisions affect both precious metals demand and dollar strength. The current environment of elevated rates reduces silver's appeal relative to yield-bearing alternatives, but any pivot toward easier monetary policy could rapidly shift investment flows.
Industrial demand trends provide another critical variable. Silver's extensive use in solar panels, electric vehicles, and 5G infrastructure creates growing baseline demand that differs qualitatively from investment flows. According to the Silver Institute, industrial applications consume approximately 60% of annual silver supply, creating price-insensitive demand that continues regardless of financial market conditions.
Geopolitical tensions increasingly influence precious metals markets as central banks diversify reserves away from dollar-denominated assets. Recent increases in central bank gold purchases suggest similar trends could emerge in silver markets, though silver's smaller market size would amplify any institutional accumulation efforts.
Supply-side developments in major producing regions affect inventory availability independent of demand trends. Mining disruptions in Mexico, Peru, or Chile—which collectively account for significant silver production—could rapidly tighten available supply for COMEX delivery. Environmental regulations and labor disputes create ongoing operational risks for mining operations.
Currency volatility adds another dimension, as silver trading occurs primarily in U.S. dollars while production costs often reflect local currency economics. Significant dollar strength reduces mining profitability and available supply, while dollar weakness encourages production and inventory accumulation.
Monitoring these economic factors requires integrated analysis across monetary policy, industrial trends, geopolitics, and supply chains. Our live silver price tracker incorporates multiple data streams to help investors assess how economic developments affect silver market dynamics.
What Immediate Actions Should Investors Consider?
Given the elevated risk profile indicated by the 52.6% coverage ratio and declining inventory, immediate assessment of precious metals allocation becomes prudent. Investors should evaluate whether current silver exposure aligns with portfolio objectives and risk tolerance given potential delivery scenario outcomes.
Physical silver acquisition merits immediate consideration, though timing considerations remain important. Premium over spot prices currently reflect normal market conditions, but historical precedent suggests premiums expand rapidly once delivery concerns emerge publicly. Gradual accumulation may prove more effective than concentrated purchases if inventory trends continue deteriorating.
Monitoring systems become essential for tracking key metrics that could signal escalating delivery risks. Daily COMEX inventory reports, weekly COT positioning data, and industrial demand indicators provide early warning signals for changing market dynamics. Establishing alert systems for coverage ratio thresholds enables proactive rather than reactive positioning adjustments.
Documentation and record-keeping assume greater importance during volatile periods. Tax implications, storage costs, and insurance considerations for physical metals require advance planning rather than crisis-period decisions. Professional guidance on precious metals taxation and estate planning may prove valuable given potential price volatility.
Alternative silver exposure vehicles deserve evaluation for investors seeking precious metals exposure without physical storage requirements. Silver ETFs, mining equities, and derivatives each offer different risk-reward profiles during delivery stress scenarios, requiring careful analysis of fund structures and counterparty risks.
Portfolio rebalancing schedules may require adjustment to account for increased volatility potential. Traditional monthly or quarterly rebalancing could prove inadequate if silver prices experience the rapid changes historically associated with delivery stress periods.
For comprehensive precious metals portfolio management tools, our stack calculator helps optimize allocation decisions across different silver investment vehicles while accounting for tax implications and storage considerations.
Conclusion: Preparing for Market Structure Stress
COMEX silver's -1.2% inventory decline combined with the high-risk 52.6% coverage ratio creates market conditions that demand investor attention and strategic positioning adjustments. Historical precedent demonstrates that coverage ratios below 55% coincide with increased delivery risks and potential price volatility, making current conditions particularly noteworthy for precious metals investors.
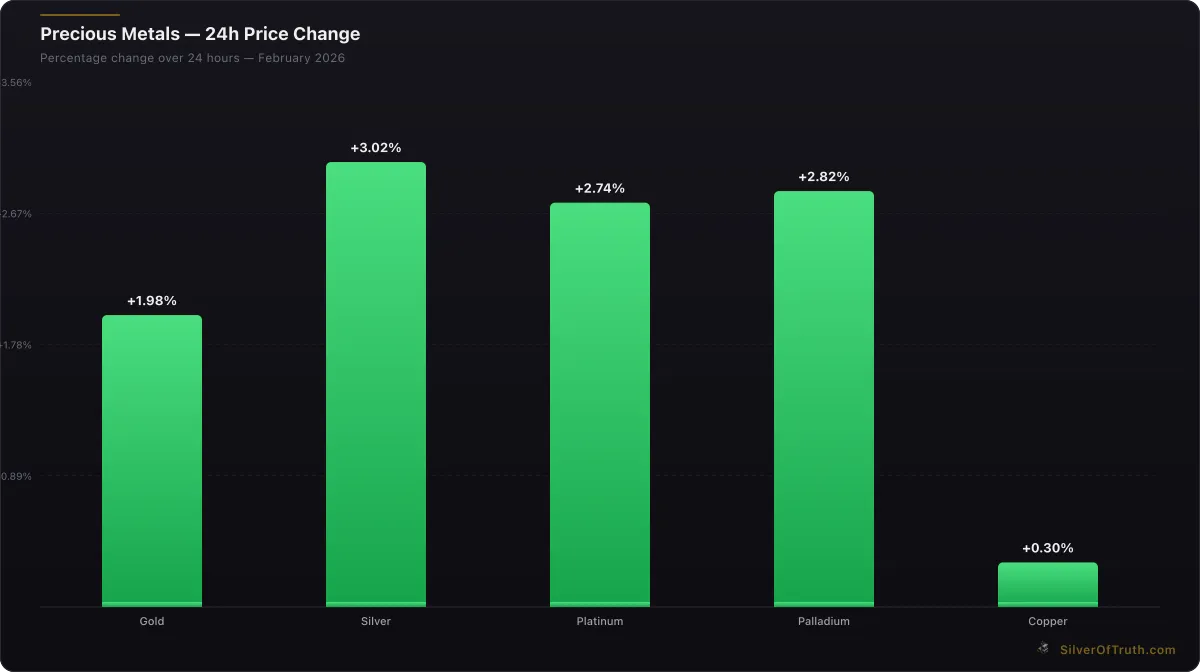
24-hour precious metals price changes. Source: SilverOfTruth, February 2026
The convergence of declining inventory, elevated open interest, and balanced speculative positioning creates asymmetric risk-reward scenarios where traditional market assumptions may not apply. While delivery stress remains a probability rather than certainty, the potential consequences justify precautionary measures and strategic allocation adjustments.
Successful navigation of high-risk coverage environments requires continuous monitoring of inventory trends, positioning changes, and economic catalysts that could trigger delivery tensions. The intersection of supply-side constraints, industrial demand growth, and monetary policy uncertainty creates multiple pathways toward market stress that investors should acknowledge in portfolio planning.
Track these critical COMEX developments in real-time with the SilverOfTruth app—available on the App Store for comprehensive precious metals market intelligence and inventory monitoring.
For ongoing analysis of COMEX inventory trends and delivery risk assessment, return to our COMEX Explained hub for updated insights and strategic frameworks for precious metals investing during volatile market conditions.
Frequently Asked Questions
What does a 52.6% coverage ratio mean for silver investors? A 52.6% coverage ratio means COMEX has 376.4M oz of inventory against 715.9M oz of open interest obligations. This indicates potential delivery stress if more contract holders demand physical settlement than inventory can satisfy.
How quickly could COMEX silver inventory decline further? At the current -1.2% weekly decline rate, inventory could theoretically exhaust within two years without replenishment. However, inventory flows fluctuate based on delivery demands, mining output, and recycling supplies, making linear projections unreliable.
Should investors buy physical silver during high-risk coverage periods? High-risk coverage scenarios historically favor physical silver allocation due to delivery optionality. However, premiums typically rise during inventory stress, suggesting gradual accumulation may prove more cost-effective than concentrated purchases.
What coverage ratio level triggers delivery squeeze concerns? Historical analysis suggests coverage ratios below 50% create elevated delivery risk, while ratios below 40% have coincided with significant price dislocations and market stress in previous episodes.
How do COMEX inventory changes affect silver mining stocks? Mining stocks often benefit from silver price volatility driven by inventory stress, as rising commodity prices increase mining profitability. However, operational risks and production costs affect mining equities independently of underlying metal prices.
Sources
- CME Group COMEX Data: https://www.cmegroup.com/markets/metals.html
- CFTC Commitment of Traders Reports: https://www.cftc.gov/dea/futures/other_lf.htm
- World Gold Council Market Intelligence: https://www.gold.org/goldhub/data
- Silver Institute Supply and Demand Data: https://www.silverinstitute.org
- Federal Reserve Economic Data: https://www.federalreserve.gov/releases/h41/
Disclaimer: This article is for informational and educational purposes only and does not constitute financial, investment, or trading advice. Past performance is not indicative of future results. Always conduct your own research and consult with a qualified financial advisor before making investment decisions. SilverOfTruth provides market data and analysis tools — it does not provide personalized financial advice.