
COMEX gold inventory dropped 1.4% this week, bringing total warehouse stocks to 34.42 million ounces as of February 13, 2026. While this decline might seem modest compared to silver's dramatic vault movements, seasoned precious metals analysts recognize that even small percentage changes in gold inventory can signal significant shifts in market dynamics. Understanding these warehouse movements becomes crucial as we navigate an environment where COMEX positioning data shows extreme speculator positioning alongside Fed policy uncertainty. Our comprehensive COMEX Explained hub provides the foundational knowledge needed to interpret these critical market signals.
Quick Answer: The -1.4% COMEX gold inventory decline reflects normal market fluctuations rather than delivery stress, with total stocks at 34.42M oz providing adequate coverage against current open interest levels. However, the combination of falling inventory, extreme speculator positioning, and recent profit-taking activity warrants close monitoring for potential market instability signals.
What Does the -1.4% COMEX Gold Inventory Drop Tell Us?
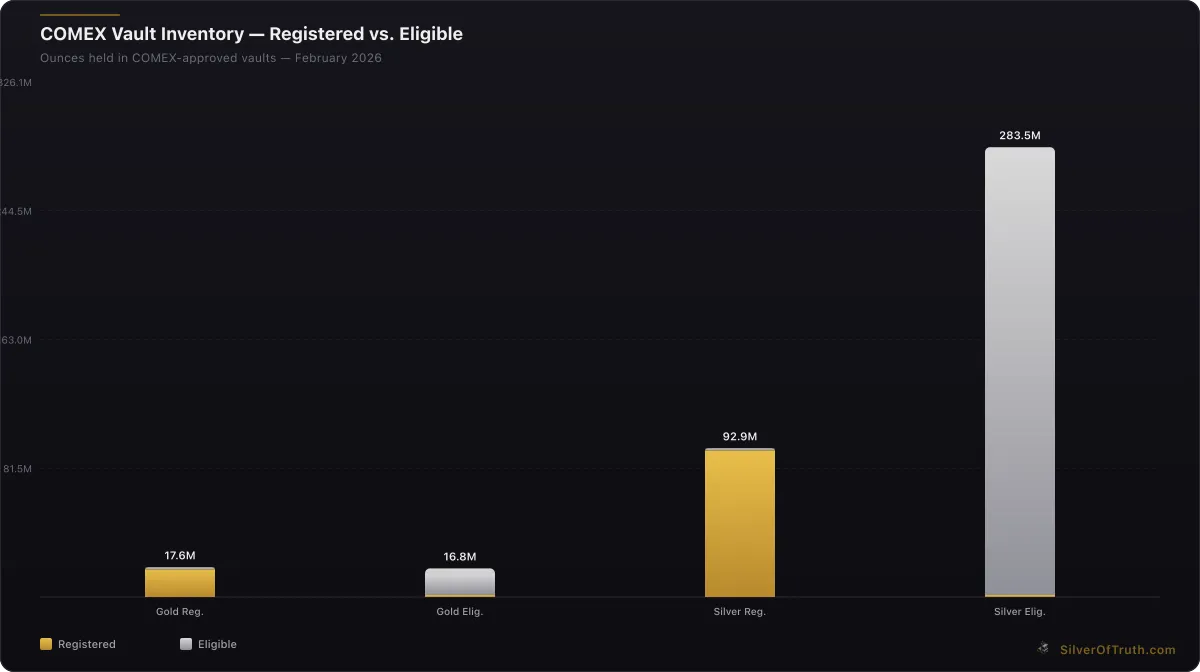
The February 13 inventory data reveals COMEX gold stocks fell to 34.42 million ounces, comprising 16.84 million eligible and 17.58 million registered ounces. This represents a 0.093% daily decline, but the cumulative impact over recent weeks has created a more substantial 1.4% reduction in total warehouse holdings.
Source: SilverOfTruth COMEX data, February 2026
Unlike silver's volatile inventory swings, gold warehouse movements typically reflect steadier patterns of supply and demand. The current decline aligns with historical precedent during periods of speculative unwinding, as indicated by the latest CFTC COT report data showing speculators reducing net long positions by 39,792 contracts.
What makes this inventory movement noteworthy is its timing. The reduction comes as managed money traders — hedge funds and large speculators — have been aggressively trimming bullish positions. This positioning shift, combined with inventory decline, creates potential instability markers that warrant attention from both institutional and retail investors.
The registered-to-eligible ratio remains balanced at approximately 1:1, with 17.58 million registered ounces available for immediate delivery against 16.84 million eligible ounces in storage. This balance suggests no immediate supply stress, but the overall declining trend indicates either increased delivery demand or reduced inflows from mining sources.
How Do Warehouse Movements Signal Market Stability Risks?
COMEX warehouse movements serve as early warning indicators for broader precious metals market stability. When inventory declines coincide with specific positioning patterns, they can forecast potential delivery pressure or supply constraints that affect global pricing mechanisms.
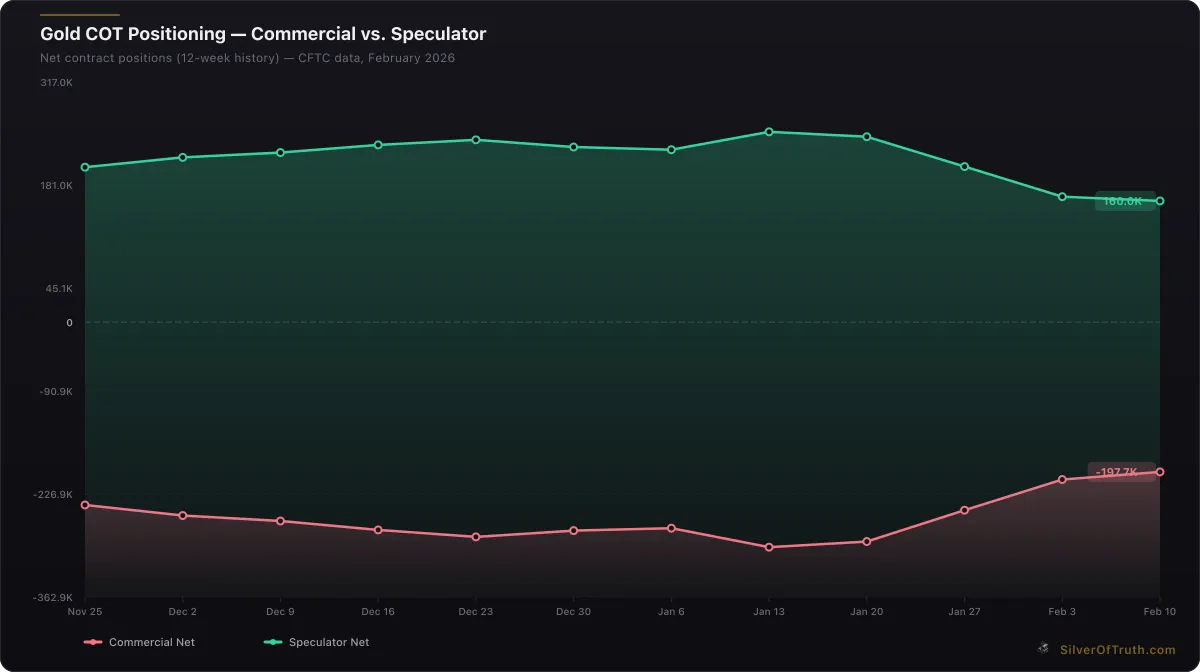
Gold COT positioning: commercial hedgers (red) vs. speculators (green). Source: CFTC via SilverOfTruth, February 2026
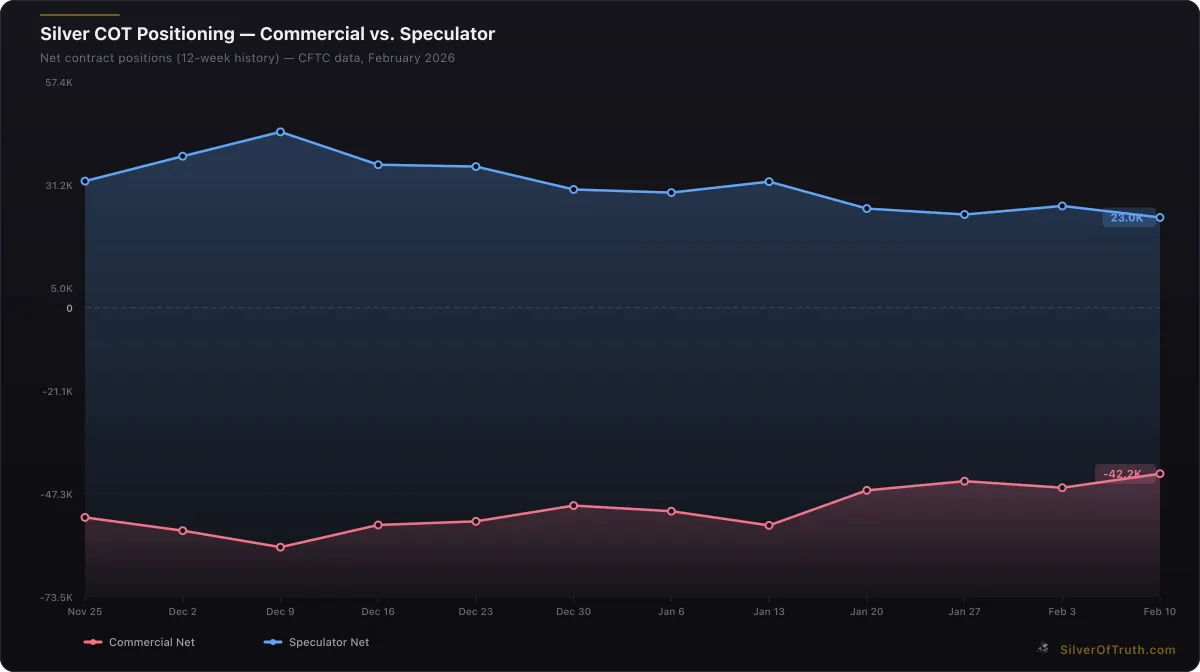
Silver COT positioning: commercial hedgers (red) vs. speculators (blue). Source: CFTC via SilverOfTruth, February 2026
The current scenario presents three key risk indicators worth monitoring. First, the inventory decline occurs alongside extreme speculator positioning, with non-commercial traders holding 52.4% of total open interest in long positions. This crowded positioning creates vulnerability to rapid unwinding if market sentiment shifts.
Second, the 78,769-contract drop in total open interest to 409,694 contracts suggests profit-taking activity rather than new accumulation. When combined with inventory declines, this pattern historically precedes either sharp price corrections or delivery-related volatility.
Third, the concentration metrics show concerning imbalances, with the top four short holders controlling 34.2% of short interest while the top four long holders represent only 17.1% of long positions. This asymmetric concentration amplifies potential market disruption if large shorts begin covering positions simultaneously.
Market stability risks emerge when inventory declines accelerate beyond normal seasonal patterns. The current 1.4% reduction, while manageable, represents a pace that could strain delivery capabilities if sustained over multiple months. Historical analysis of similar periods, such as March 2020's delivery stress events, shows that inventory declines of 2-3% per month can trigger warehouse logistical challenges.
Why Are Coverage Ratios Critical for Understanding Delivery Risk?
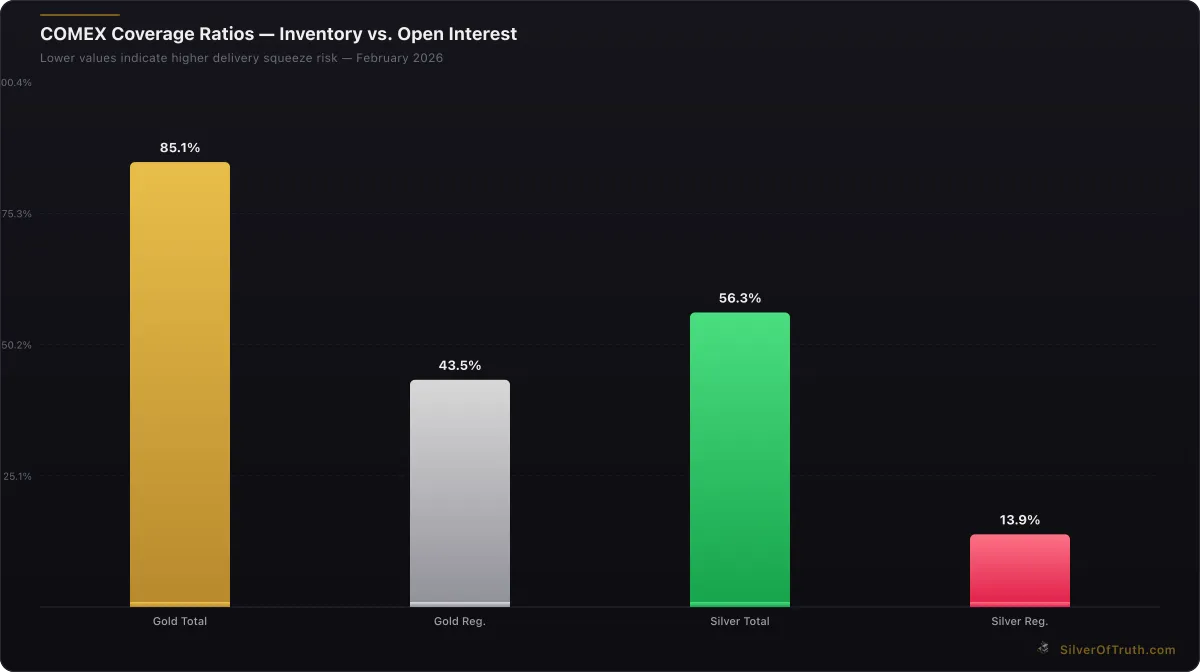
The coverage ratio — comparing warehouse inventory to open interest — provides the most reliable metric for assessing potential delivery squeeze risk. Current COMEX gold coverage stands at 84%, with registered coverage at 43%, indicating moderate delivery risk levels according to our risk assessment framework.
COMEX coverage ratios — lower values indicate higher delivery squeeze risk. Source: SilverOfTruth, February 2026
These ratios reveal important market dynamics beyond simple supply-demand calculations. The 84% total coverage suggests adequate inventory to satisfy theoretical delivery demand if all futures contracts went to delivery. However, the 43% registered coverage highlights potential bottlenecks if delivery demand concentrates in specific contract months or warehouse locations.
Coverage ratio analysis becomes particularly valuable when tracking weekly changes. The recent inventory decline pushed coverage ratios lower from previous weeks, though levels remain above critical thresholds that typically trigger delivery concerns. Our COMEX Inventory Tracker provides real-time monitoring of these crucial metrics.
Understanding coverage ratios also requires context about typical delivery patterns. Less than 2% of COMEX gold futures contracts typically result in physical delivery, making theoretical coverage calculations somewhat academic. However, coverage ratios below 50% historically correlate with increased premium volatility and potential delivery infrastructure strain.
The current registered coverage of 43% sits near historical levels that have previously triggered enhanced delivery procedures or warehouse capacity concerns. While not immediately critical, this level warrants monitoring, especially if combined with increased delivery demand from institutional buyers or central banks accessing COMEX markets.
What Historical Patterns Reveal About Inventory Warning Signs?
Historical analysis of COMEX gold inventory movements reveals predictable patterns that can help investors anticipate market behavior. The current -1.4% decline fits within normal monthly fluctuation ranges, but the combination with extreme positioning creates parallels to previous market stress episodes.
The March 2020 delivery crisis offers the most relevant comparison point. During that period, inventory declined approximately 3% monthly while coverage ratios fell below 30%. The current situation shows less severe metrics but similar underlying dynamics: extreme speculator positioning, declining open interest, and gradual inventory reduction.
Another relevant historical parallel occurred during the 2013 gold correction, when inventory declined 2.2% over six weeks while managed money positions reached extreme levels. That episode resulted in a sharp price correction as overleveraged positions unwound, though no delivery stress materialized due to adequate registered inventory levels.
Seasonal patterns also influence inventory movements. February typically shows modest inventory declines as refiners adjust production schedules and mining companies manage quarterly delivery obligations. The current decline aligns with historical February patterns, though the magnitude sits at the higher end of typical ranges.
Long-term trends show COMEX gold inventory has remained relatively stable compared to silver's more volatile warehouse dynamics. Gold's industrial demand represents a smaller percentage of total demand compared to silver, creating more predictable inventory patterns. However, increased central bank gold accumulation globally has begun affecting COMEX dynamics in ways not seen in previous decades.
How Should Investors Interpret Current Market Signals?
Current market signals present a complex picture requiring nuanced interpretation rather than simple bullish or bearish conclusions. The inventory decline, while noteworthy, occurs within manageable parameters that don't suggest immediate delivery stress or supply shortages.
The most significant concern stems from positioning extremes rather than inventory levels themselves. With speculators holding 52.4% of open interest in long positions, the market shows classic signs of crowded positioning vulnerable to rapid unwinding. This positioning imbalance, combined with inventory decline, creates potential for amplified volatility in either direction.
Investors should focus on the intersection of multiple indicators rather than isolated metrics. The combination of falling inventory, extreme positioning, declining open interest, and concentration risks suggests a market primed for volatility rather than directional movement. This environment typically rewards tactical approaches over buy-and-hold strategies.
Professional traders appear to be taking profits and reducing exposure, as evidenced by the 78,769-contract open interest decline. This profit-taking activity, combined with inventory movements, suggests institutional awareness of elevated risks that retail investors should acknowledge.
The current environment resembles periods of market consolidation rather than crisis, but consolidation phases can quickly evolve into more dramatic movements if catalyst events emerge. Federal Reserve policy decisions, geopolitical developments, or unexpected economic data could rapidly shift market dynamics in an environment already showing stress indicators.
What Should Precious Metals Investors Watch Next?
Monitoring key indicators becomes essential for navigating the current market environment. Weekly COMEX warehouse reports provide the most timely data for tracking inventory trends, while Friday COT releases reveal positioning changes among different trader categories.
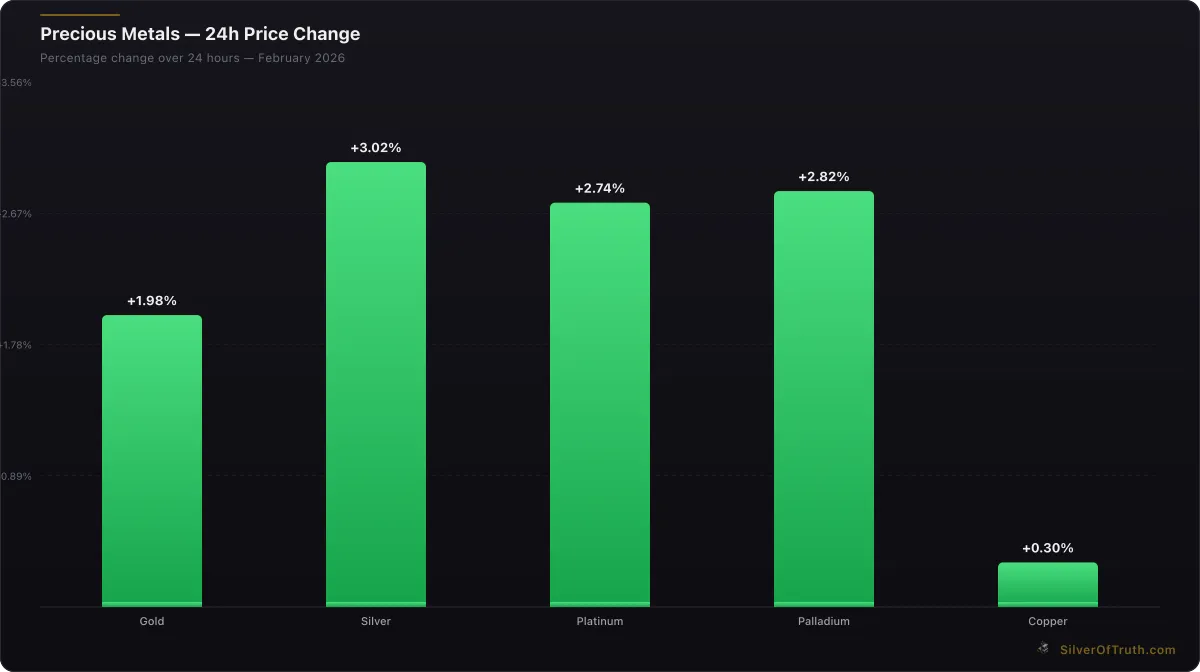
24-hour precious metals price changes. Source: SilverOfTruth, February 2026
The registered inventory level deserves particular attention. If registered stocks fall below 15 million ounces while open interest remains elevated, delivery risk calculations would shift significantly. Conversely, increasing registered inventory would alleviate current concerns and suggest supply normalizing.
Coverage ratio trends offer another critical monitoring point. Weekly calculations of inventory-to-open interest ratios help identify accelerating risks before they become acute. Our COT Dashboard provides automated tracking of these relationships alongside positioning data.
Federal Reserve policy communications represent external catalysts that could rapidly change market dynamics. The current inventory and positioning environment makes precious metals markets particularly sensitive to monetary policy shifts or interest rate guidance changes.
Mining sector developments also warrant attention. Reduced mining supply could exacerbate inventory declines, while increased production or recycling could alleviate warehouse pressure. Quarterly mining company reports and World Gold Council supply data provide context for longer-term supply trends.
Frequently Asked Questions
Is a 1.4% COMEX gold inventory decline significant? While not immediately critical, a 1.4% decline combined with extreme speculator positioning and falling open interest creates potential market instability indicators worth monitoring closely.
How do COMEX gold coverage ratios compare to historical levels? Current coverage ratios of 84% total and 43% registered sit within normal ranges but near levels that have previously triggered delivery procedure enhancements during stress periods.
What inventory level would signal serious delivery risk? Registered inventory below 15 million ounces combined with coverage ratios under 40% would indicate elevated delivery risk, though current levels remain above these thresholds.
Should investors be concerned about current warehouse movements? The inventory decline warrants monitoring rather than immediate concern, but the combination with positioning extremes suggests elevated volatility risk that tactical investors should acknowledge.
How often do COMEX inventory warnings materialize into actual problems? Most inventory warning signals don't result in delivery stress, but they often correlate with increased price volatility as markets price in potential supply risks.
Understanding COMEX gold inventory movements requires combining multiple data sources and maintaining perspective on historical patterns. The current -1.4% decline signals potential market instability worth monitoring, particularly when combined with extreme positioning and declining open interest. Investors can track these developments using tools like our Gold Price tracker while building knowledge through our comprehensive COMEX Explained hub. Stay informed about warehouse movements and positioning changes to navigate this evolving market environment successfully.
Sources
- CME Group COMEX warehouse reports: https://www.cmegroup.com/markets/metals.html
- CFTC Commitments of Traders reports: https://www.cftc.gov/dea/futures/other_lf.htm
- World Gold Council market data: https://www.gold.org/goldhub/data
- LBMA precious metals data: https://www.lbma.org.uk/prices-and-data
Disclaimer: This article is for informational and educational purposes only and does not constitute financial, investment, or trading advice. Past performance is not indicative of future results. Always conduct your own research and consult with a qualified financial advisor before making investment decisions. SilverOfTruth provides market data and analysis tools — it does not provide personalized financial advice.