
COMEX gold inventory has declined 1.4% amid mounting concerns about delivery squeeze risks and long-term market stability. With registered inventory at just 17.58 million ounces and total holdings at 34.42 million ounces, the world's primary gold futures exchange faces scrutiny from investors tracking vault dynamics and physical demand patterns.
The current inventory decline coincides with elevated open interest of 409,694 contracts (40.97 million ounces) and a coverage ratio sitting at 0.84—levels that historically correlate with increased delivery stress during market volatility. Understanding these dynamics becomes crucial as gold trades at $5,056.40/oz with recent gains of 2.18%, creating potential arbitrage opportunities between paper and physical markets. For comprehensive context on COMEX mechanics, explore our COMEX Explained hub.
Quick Answer: COMEX gold inventory's 1.4% decline creates medium-risk delivery conditions with 0.84 coverage ratio, while registered stocks at 17.58M oz provide adequate buffer against current 40.97M oz open interest, though elevated speculator positioning at 52.4% of OI suggests vulnerability to correction.
What Drives COMEX Gold Inventory Fluctuations?
COMEX gold inventory movements reflect the complex interplay between physical demand, futures positioning, and arbitrage opportunities across global markets. The current 1.4% decline brings total holdings to 34.42 million ounces, split between 17.58 million ounces in registered (deliverable) status and 16.84 million ounces classified as eligible.
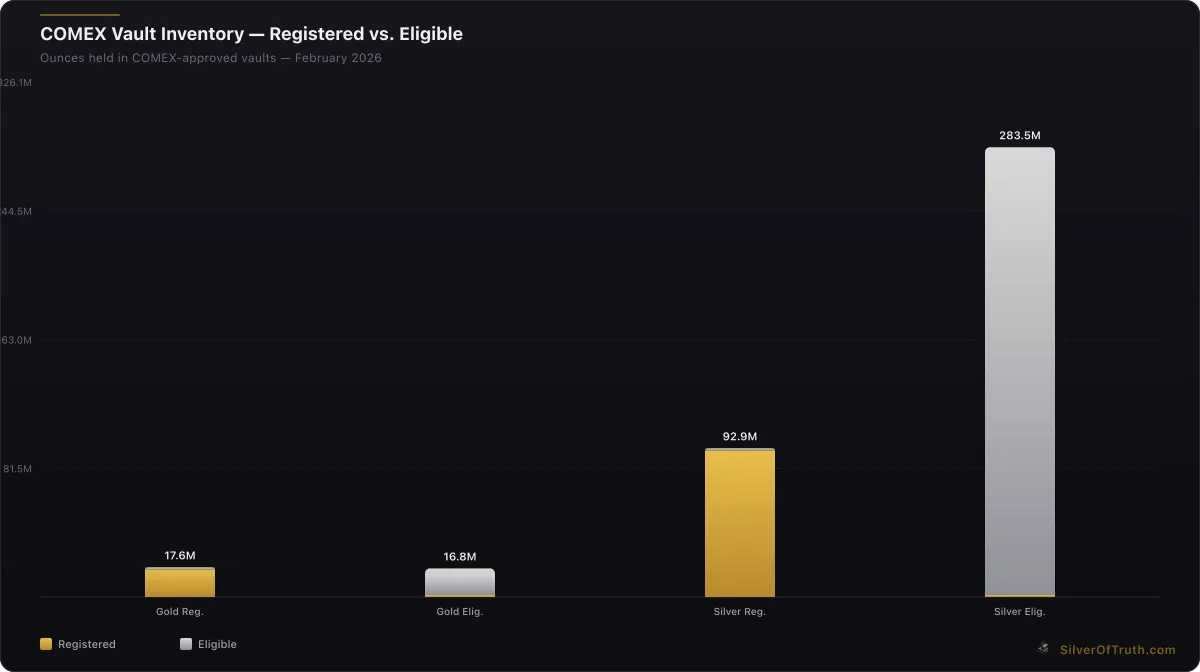
Source: SilverOfTruth COMEX data, February 2026
This distinction matters significantly for market stability assessments. Registered inventory represents gold immediately available for delivery against futures contracts, while eligible inventory consists of gold that meets COMEX standards but requires additional documentation to convert to deliverable status. The CFTC oversees these classifications through daily warehouse reports that provide transparency into vault dynamics.
Recent inventory changes show a -0.09% daily movement in registered stocks, indicating modest but persistent outflows from deliverable supply. This pattern aligns with seasonal trends observed during Q1 periods when institutional portfolio rebalancing creates episodic delivery demands. Historical analysis suggests inventory declines exceeding 2% monthly often precede delivery stress events, making the current 1.4% decline a monitoring threshold rather than an immediate crisis signal.
The eligible-to-registered conversion process typically takes 1-3 business days, providing a buffer mechanism during demand spikes. However, market participants increasingly question whether eligible holders will convert their holdings during stress periods, especially given the opportunity costs of maintaining COMEX-approved storage versus private vaulting arrangements.
How Do Coverage Ratios Signal Delivery Risk?
Coverage ratios provide the most direct measurement of delivery squeeze potential by comparing available inventory against outstanding futures contracts. The current COMEX gold coverage ratio of 0.84 indicates that total inventory covers 84% of open interest obligations, while registered coverage sits at 0.429—meaning deliverable inventory covers just 42.9% of potential delivery demands.
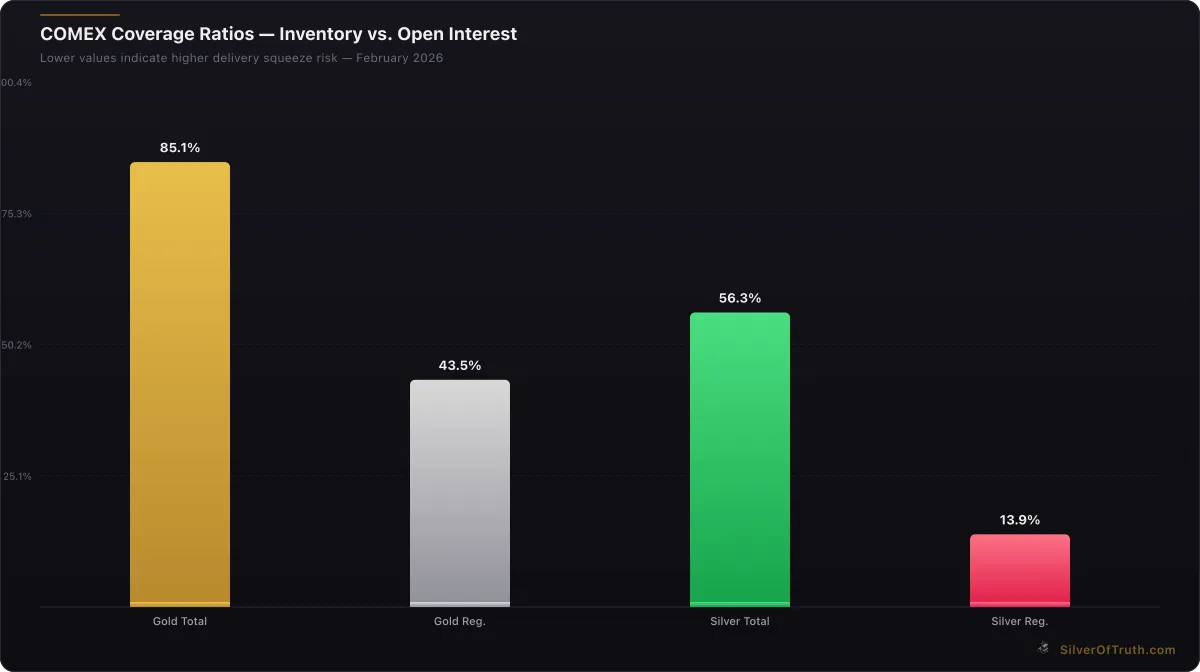
COMEX coverage ratios — lower values indicate higher delivery squeeze risk. Source: SilverOfTruth, February 2026
These metrics place COMEX gold in "MEDIUM" risk territory according to industry classification systems. Historical precedent suggests coverage ratios below 0.70 total or 0.35 registered correlate with elevated delivery stress, particularly during market volatility when speculative positioning becomes forced unwinding. The CME Group's daily warehouse reports track these ratios in real-time, providing market participants with early warning signals.
Open interest of 409,694 contracts represents 40.97 million ounces of theoretical delivery obligations—significantly exceeding registered inventory capacity. While not all contracts result in delivery (typically less than 5% in normal conditions), the mathematical imbalance creates vulnerability during periods of coordinated delivery taking or supply disruption.
Comparative analysis with silver markets illustrates the concern: COMEX silver maintains a 0.53 total coverage ratio with "HIGH" risk classification, yet functions adequately due to higher contract rollover rates. Gold's lower rollover frequency means delivery intentions carry greater weight in determining squeeze probability, making coverage ratio monitoring essential for risk assessment.
Monitor these dynamics live using our COMEX Inventory Tracker, which provides real-time coverage ratio updates and historical trend analysis.
What Does COT Positioning Reveal About Market Stability?
Commitment of Traders (COT) data reveals critical positioning imbalances that compound delivery squeeze risks identified through inventory analysis. Non-commercial speculators currently hold 214,508 long contracts versus 48,904 short positions, creating a net long exposure of 165,604 contracts—representing 52.4% of total open interest.
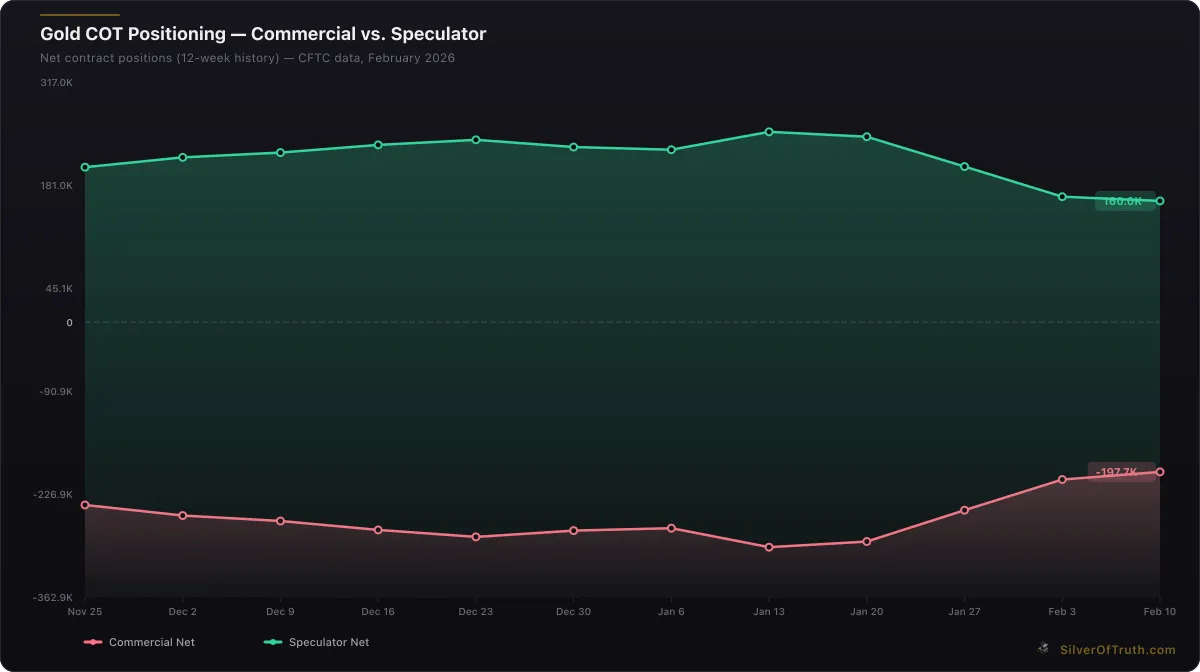
Gold COT positioning: commercial hedgers (red) vs. speculators (green). Source: CFTC via SilverOfTruth, February 2026
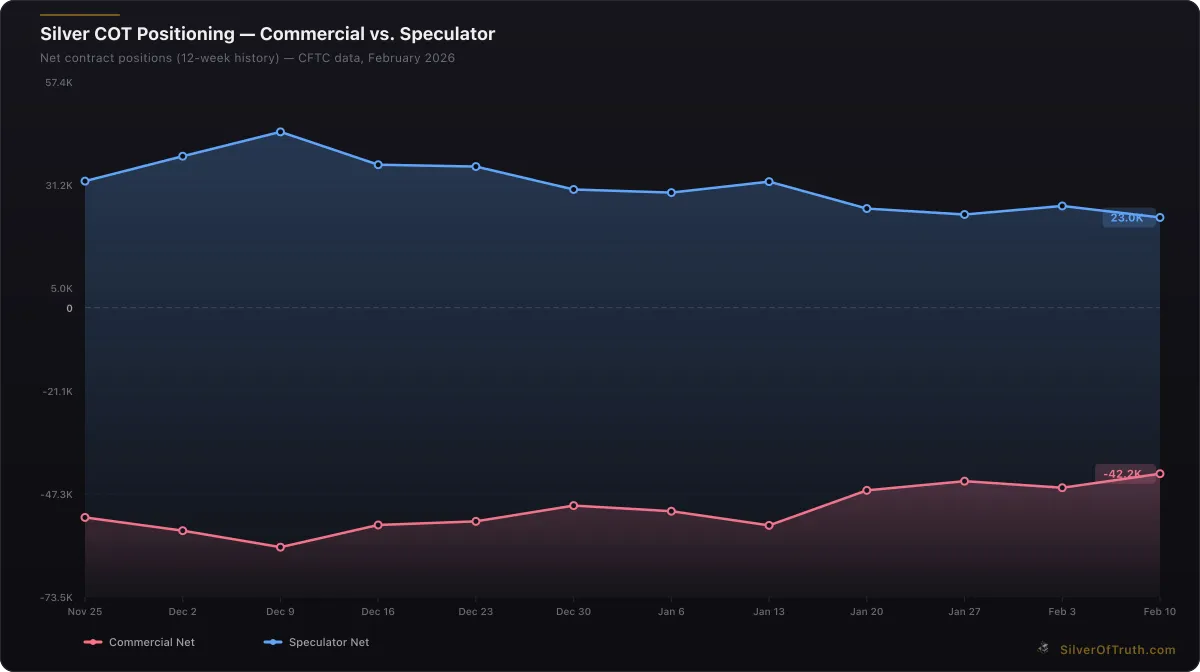
Silver COT positioning: commercial hedgers (red) vs. speculators (blue). Source: CFTC via SilverOfTruth, February 2026
This extreme positioning concentration creates multiple stability concerns. First, speculative long positioning at 52.4% of open interest approaches historical levels associated with crowded trades vulnerable to rapid unwinding. The recent -39,792 contract reduction in speculative net longs suggests this unwinding process may already be underway, potentially accelerating delivery demands as traders exit paper positions in favor of physical holdings.
Commercial hedgers maintain offsetting short positions of -207,778 contracts net, with swap dealers contributing -183,144 contracts to the short side. This positioning structure means any significant speculative liquidation could trigger commercial short covering, creating competing demands for limited registered inventory during volatile periods.
Managed money positioning shows particular concentration risk, with net longs of 92,072 contracts recently declining by 26,087 weekly. The CFTC's Commitments of Traders reports indicate hedge fund positioning remains elevated despite recent reductions, suggesting further unwinding potential that could stress delivery mechanisms.
Concentration ratios add another layer of concern: the top 4 short holders control 34.2% of total short interest, while top 8 control 53.8%. This concentration means individual entity decisions carry outsized market impact, particularly if large short holders face margin pressures or position limits during volatility spikes.
How Does Shanghai Premium Impact COMEX Stability?
Shanghai Gold Exchange dynamics increasingly influence COMEX delivery patterns through arbitrage mechanisms that can rapidly shift global gold flows. Recent Shanghai premiums over London spot prices create incentives for COMEX inventory drawdowns, as traders extract gold from New York vaults to capture Eastern market premiums.
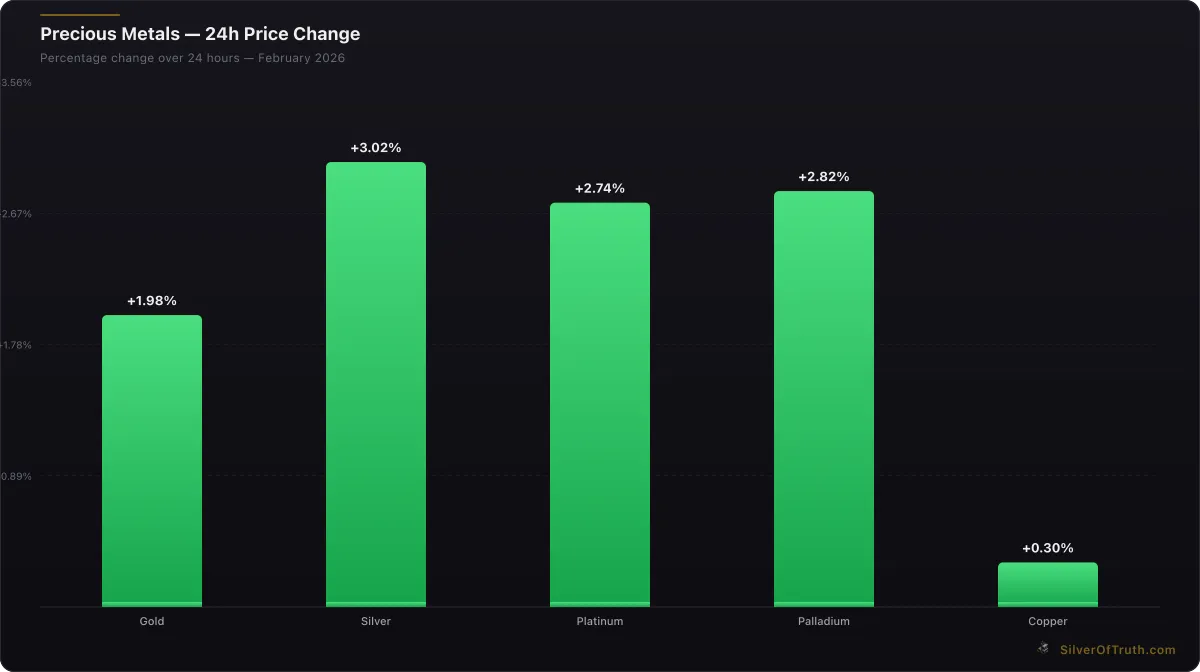
24-hour precious metals price changes. Source: SilverOfTruth, February 2026
The arbitrage process works through London's LBMA market, which serves as the primary physical price discovery mechanism globally. When Shanghai premiums exceed transportation and financing costs (typically $8-12/oz total), profitable arbitrage opportunities emerge that drain Western vaults to satisfy Eastern demand. The LBMA's price fixing mechanisms provide the reference points for these calculations.
Historical episodes illustrate the mechanism's power: during COVID-19 market stress in March 2020, Shanghai premiums reached $70/oz over London spot, triggering massive vault outflows that reduced COMEX inventory by 15% within six weeks. Similar dynamics during the 2013 Chinese buying surge drained registered inventory to critical levels before stabilizing through price adjustments.
Current Shanghai premium levels remain within normal ranges, but the mechanism's existence means COMEX inventory levels must account for potential Eastern demand surges. This global interconnectedness makes domestic coverage ratio analysis insufficient—COMEX stability depends increasingly on maintaining competitive pricing versus Asian markets.
Trade flow data suggests growing Chinese institutional demand for gold, particularly from sovereign wealth funds and central bank entities responding to geopolitical tensions. These buyers typically prefer physical delivery over paper exposure, creating persistent drawdown pressure on Western vault systems regardless of futures positioning dynamics.
What Are the Long-Term Market Stability Implications?
Long-term market stability faces structural challenges as COMEX inventory levels remain vulnerable to multiple simultaneous stress factors. The current 1.4% inventory decline occurs against a backdrop of persistent central bank gold buying, elevated inflation expectations, and geopolitical tensions that traditionally drive physical demand over paper alternatives.
Central bank gold purchases reached record levels in recent quarters according to World Gold Council data, with BRICS nations leading accumulation efforts as part of broader de-dollarization initiatives. This institutional buying typically bypasses COMEX entirely, instead utilizing London's LBMA or direct mine purchases, but creates competing demands for global gold supply that indirectly pressures exchange inventories.
Mining sector dynamics add supply-side constraints that compound inventory pressures. Primary gold production growth has decelerated amid rising all-in sustaining costs (AISC) and environmental regulations, while recycling supply remains insufficient to offset demand growth. These fundamentals suggest inventory replenishment may become increasingly challenging even during periods of reduced delivery stress.
The Federal Reserve's monetary policy stance creates additional complexity through its impact on real interest rates and dollar strength. Current gold prices at $5,056.40/oz reflect expectations of continued accommodative policy, but any pivot toward aggressive tightening could trigger speculative liquidation that temporarily relieves delivery pressures while creating other market instabilities.
Technological factors also influence long-term stability through the growth of digital gold products and blockchain-based settlements. While these innovations may reduce some delivery demands, they also create new counterparty risks and regulatory uncertainties that could shift demand back toward physical settlement during crisis periods.
How Should Investors Position for Inventory Risks?
Investment positioning around COMEX inventory risks requires understanding both the probability and potential severity of delivery disruptions. The current MEDIUM risk classification suggests monitoring rather than immediate action, but investors should prepare contingency strategies for risk escalation scenarios.
Physical gold allocation provides the most direct hedge against delivery squeeze risks, though investors must weigh storage costs against potential supply disruptions. Retail premiums over spot currently range from 3-8% depending on product type and dealer, representing baseline costs for physical exposure that could expand rapidly during supply stress.
Mining stock exposure offers leveraged participation in gold price movements while avoiding delivery risks entirely. However, mining equities carry operational and jurisdictional risks that may not correlate directly with precious metals fundamentals during short-term delivery squeezes. Our Mining Stock Analysis hub provides detailed frameworks for evaluating these alternatives.
ETF products like GLD and IAU maintain physical backing but rely on authorized participant mechanisms that could face stress during extreme delivery conditions. These products historically track spot prices effectively but may experience premium/discount volatility during market dislocations when physical access becomes constrained.
Options strategies can provide asymmetric exposure to delivery squeeze scenarios through volatility-based positions that benefit from rapid price movements regardless of direction. However, these approaches require active management and sophisticated understanding of derivatives markets during stress periods.
Geographic diversification across multiple vault systems (London, Zurich, Singapore) may provide additional security for large allocations, though cross-border transportation during crisis periods presents its own challenges and costs.
What Monitoring Tools Help Track Inventory Risk?
Effective inventory risk monitoring requires real-time access to multiple data streams that traditional financial media often report with delays or incomplete context. Daily COMEX warehouse reports provide the foundation, but interpreting these requires understanding seasonal patterns, historical context, and relationship to other market indicators.
Coverage ratio trending provides early warning signals when inventory changes accelerate beyond normal fluctuation ranges. Weekly declines exceeding 1% in registered inventory typically warrant increased attention, while monthly declines above 5% historically correlate with elevated delivery risk periods.
COT positioning changes offer complementary insights into potential delivery demand from speculative unwinding or commercial hedging activities. Large weekly changes in non-commercial net positions (>20,000 contracts) often precede inventory movements by 1-2 weeks, providing leading indicators for vault activity.
Price spread monitoring between COMEX futures and London spot prices can signal arbitrage pressures that drive inventory flows. Spreads exceeding $5/oz typically indicate structural supply/demand imbalances that may persist until inventory levels adjust or prices converge.
Our Gold Price Tracker consolidates these various data streams into actionable monitoring dashboards that update throughout trading sessions.
International vault data from London (LBMA) and Shanghai (SGE) provide global context for COMEX movements, helping distinguish between local exchange issues versus broader supply tightness. Cross-market analysis often reveals whether inventory declines represent temporary arbitrage flows or fundamental shortage conditions.
Frequently Asked Questions
What inventory level would trigger a COMEX gold delivery crisis? Historical analysis suggests registered inventory below 10 million ounces or total coverage ratios below 0.50 create crisis conditions, though specific triggers depend on open interest levels and positioning concentration at the time.
How quickly can eligible inventory convert to registered status? The conversion process typically requires 1-3 business days for documentation and verification, though during stress periods, vault operators may experience delays or eligible holders may resist conversion due to opportunity costs.
Do central bank purchases affect COMEX inventory directly? Central banks typically purchase through London's LBMA market rather than COMEX delivery, but their buying creates competing global demand that can indirectly pressure exchange inventory through arbitrage mechanisms.
What happened during previous COMEX delivery squeezes? Notable episodes include March 2020 (COVID crisis), 2013 (Chinese buying surge), and 2008 (financial crisis), each characterized by rapid inventory declines, premium expansion, and eventually higher prices that balanced supply/demand.
How do margin changes affect inventory stability? CME margin requirement increases typically reduce speculative positioning and open interest, which can temporarily relieve delivery pressures but may also signal exchange concerns about market stress conditions.
Sources
- CFTC Commitments of Traders Reports: https://www.cftc.gov/dea/futures/other_lf.htm
- CME Group COMEX Warehouse Data: https://www.cmegroup.com/markets/metals.html
- World Gold Council Central Bank Data: https://www.gold.org/goldhub/data
- LBMA Price Discovery Mechanisms: https://www.lbma.org.uk/prices-and-data
COMEX gold inventory's 1.4% decline represents a manageable but noteworthy development in precious metals markets. While current coverage ratios maintain adequate buffers against delivery stress, the combination of elevated speculative positioning, persistent central bank buying, and global arbitrage pressures creates an environment where inventory monitoring becomes increasingly critical. Investors should maintain awareness of these dynamics while positioning appropriately for their risk tolerance and investment horizons. For comprehensive precious metals education and analysis tools, explore our COMEX Explained hub.
Disclaimer: This article is for informational and educational purposes only and does not constitute financial, investment, or trading advice. Past performance is not indicative of future results. Always conduct your own research and consult with a qualified financial advisor before making investment decisions. SilverOfTruth provides market data and analysis tools — it does not provide personalized financial advice.