
Gold's latest vault dynamics reveal a paradox: inventory contracted 1.4% while futures positioning collapsed, creating disconnected signals that savvy investors must decode. This divergence between physical metal movement and speculative interest offers crucial insights for those building robust precious metals portfolios.
Our COMEX Explained hub provides the foundation for understanding these complex vault mechanisms that drive gold's physical marketplace dynamics.
Quick Answer: The -1.4% COMEX gold inventory decline indicates modest physical demand, but the massive 78,769-contract drop in open interest suggests speculative profit-taking from crowded positioning. This creates a bearish near-term outlook despite vault drawdowns.
What Does the 1.4% COMEX Gold Inventory Drop Signal?
COMEX gold inventory currently stands at 34.42 million ounces, with registered stocks at 17.58 million ounces and eligible holdings at 16.84 million ounces according to CME Group warehouse reports. This 1.4% decline represents approximately 488,000 ounces leaving the vaults—a meaningful but not dramatic withdrawal.
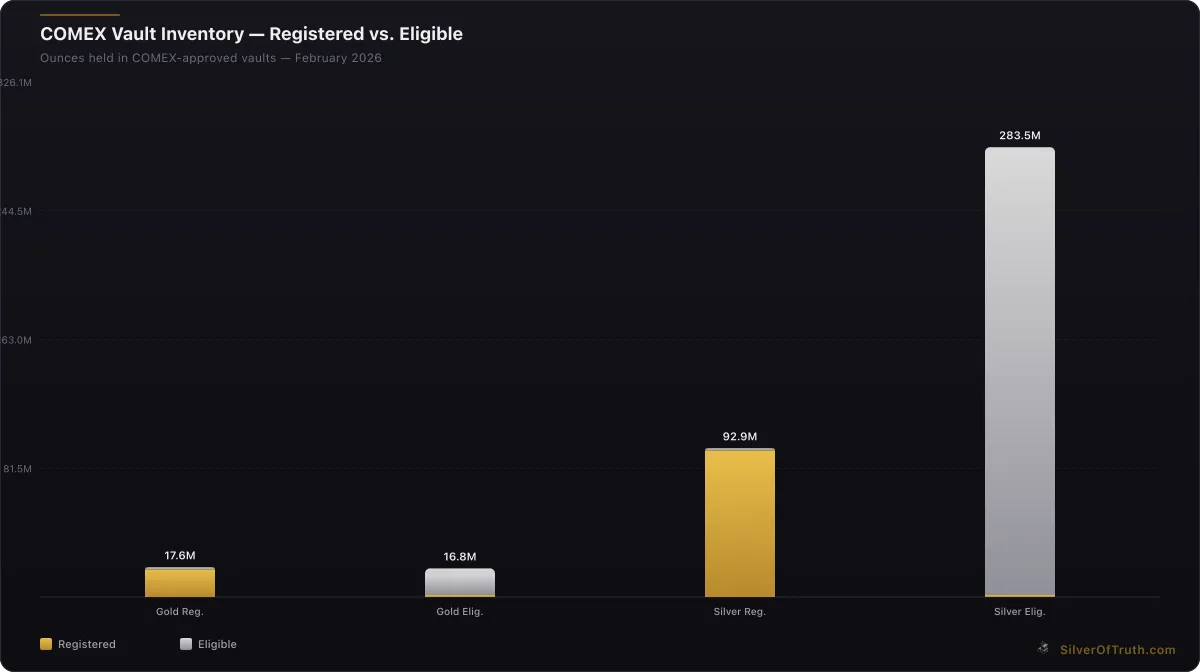
Source: SilverOfTruth COMEX data, February 2026
The inventory composition tells a nuanced story. Registered inventory, which represents metal warranted for immediate delivery against futures contracts, comprises 51% of total holdings. This balance suggests adequate delivery capacity, though the decline indicates some conversion activity or outright withdrawals.
Historical context matters here. The current 34.42 million ounce total sits well above the crisis levels seen during March 2020, when inventory approached 28 million ounces and triggered delivery concerns. However, the steady erosion over recent weeks deserves attention from investors tracking physical supply dynamics.
Vault activity patterns show this decline isn't isolated—it follows weeks of gradual drawdowns that collectively signal sustained physical demand. Unlike the volatile swings typical during delivery months, this steady reduction suggests consistent withdrawal pressure rather than temporary positioning adjustments.
How Do Coverage Ratios Reveal Delivery Risk Assessment?
The coverage ratio—inventory divided by open interest—provides the clearest gauge of delivery squeeze potential. With 34.42 million ounces of total inventory against 40.97 million ounces of open interest, the coverage ratio stands at 0.84, or 84%.
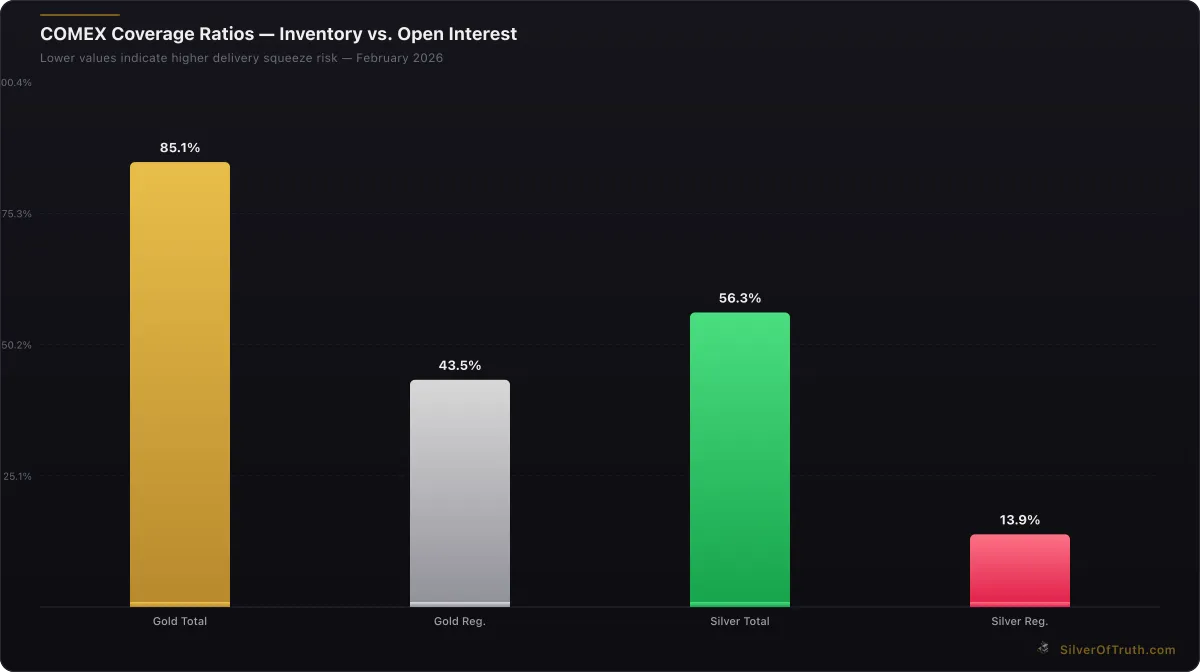
COMEX coverage ratios — lower values indicate higher delivery squeeze risk. Source: SilverOfTruth, February 2026
More critically, the registered coverage ratio hits 0.429 (42.9%), meaning less than half the outstanding contracts could theoretically receive delivery from registered stocks. While this appears concerning, registered inventory can be supplemented by eligible stock conversions during delivery periods.
Track these metrics live with our COMEX Inventory Tracker, which monitors real-time changes in vault levels and coverage ratios.
The risk level remains "MEDIUM" according to our analysis framework, indicating manageable delivery capacity but warranting continued monitoring. This classification reflects adequate buffer zones without the extreme tightness that characterized previous squeeze episodes.
Coverage ratio trends matter more than snapshots. The current 84% total coverage represents a decline from levels above 100% seen in late 2025, suggesting gradual tightening despite the absence of immediate crisis signals. This erosion pattern deserves attention from investors positioning for potential supply constraints.
Why Is Open Interest Plunging Amid Vault Drawdowns?
The 78,769-contract drop in open interest to 409,694 contracts represents the most significant positioning shift in the gold market. This massive reduction—equivalent to 7.88 million ounces—dwarfs the physical inventory decline and signals wholesale speculative unwinding.
Open interest changes reflect the net creation or destruction of futures contracts. When both buyers and sellers close positions simultaneously, open interest falls while leaving price relatively unchanged. This scenario typically indicates profit-taking from established positions rather than fresh directional betting.
The scale of this unwinding suggests institutional repositioning rather than retail adjustment. Large speculators and managed money funds appear to be crystalizing profits from the substantial gains accumulated during gold's recent rally to above $5,000 per ounce.
Timing provides additional context. The Federal Reserve's latest policy signals suggest a pause in rate cuts, reducing gold's appeal as a zero-yield alternative to bonds. This macro backdrop explains why sophisticated traders might lock in gains before potential policy shifts impact precious metals sentiment.
The disconnect between falling futures interest and declining physical inventory creates an unusual market structure. While vault drawdowns suggest ongoing physical demand, the futures market appears increasingly disconnected from these fundamentals—a pattern that historically resolves through price adjustment.
What Do COT Positioning Extremes Reveal About Market Sentiment?
The latest CFTC Commitments of Traders report reveals concerning positioning extremes that amplify the bearish outlook stemming from inventory dynamics. Speculators hold net long positions of 165,604 contracts (52.4% of total open interest), while commercials maintain net short positions of -207,778 contracts.
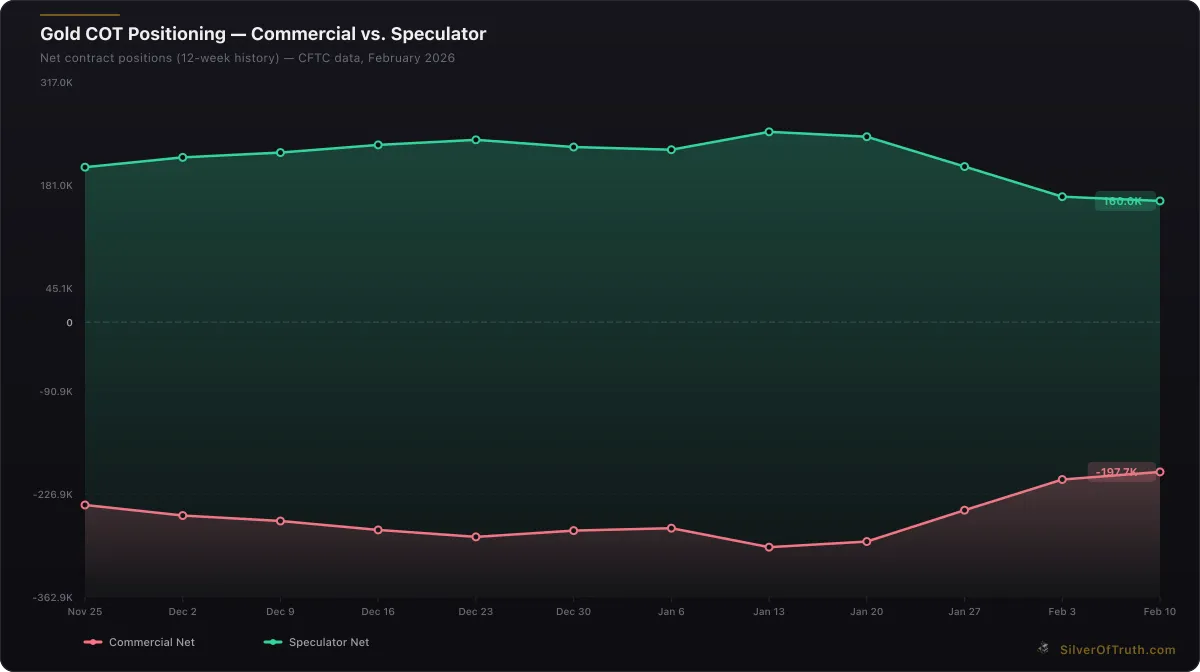
Gold COT positioning: commercial hedgers (red) vs. speculators (green). Source: CFTC via SilverOfTruth, February 2026
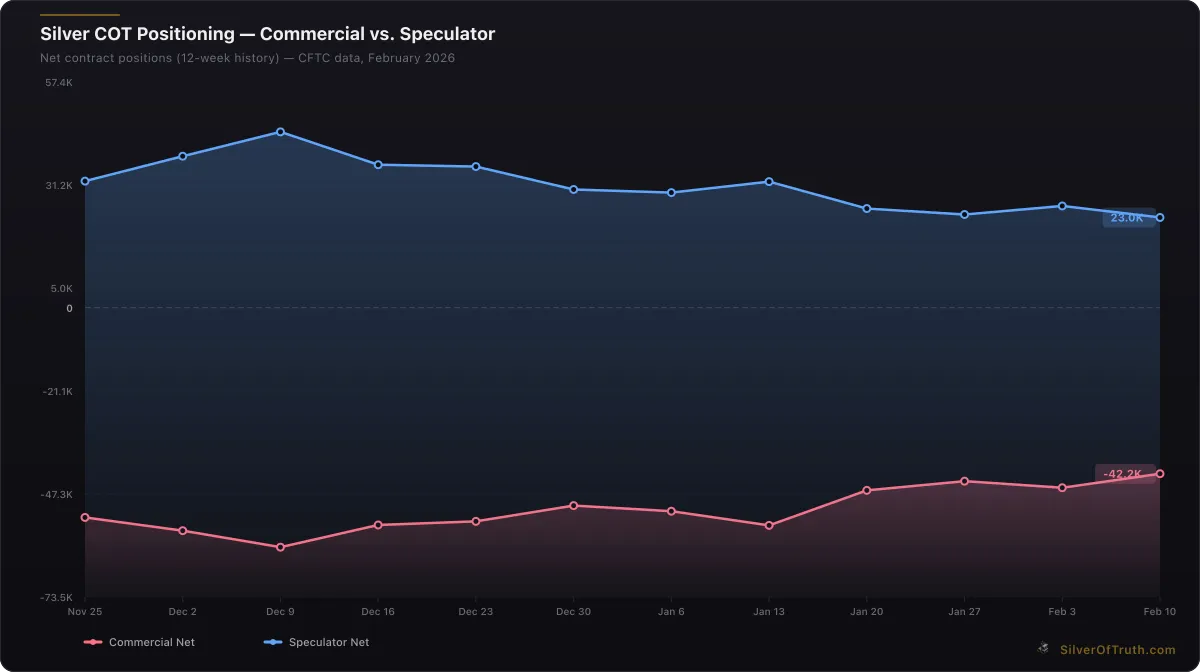
Silver COT positioning: commercial hedgers (red) vs. speculators (blue). Source: CFTC via SilverOfTruth, February 2026
This positioning structure represents a classic crowded trade scenario. When speculators control over half of all open interest on the long side, the market becomes vulnerable to cascading liquidation if sentiment shifts. The recent 39,792-contract reduction in speculative net longs signals this unwinding process has already begun.
Commercial positioning provides the counterbalance. These market participants—primarily miners, refiners, and industrial users—typically hedge future production or consumption needs. Their massive net short position of 207,778 contracts suggests expectations of adequate gold supply at current price levels.
Managed money positioning deserves particular scrutiny. With net longs of 92,072 contracts (down 26,087 weekly), this category shows the most aggressive position reduction. Hedge funds and commodity trading advisors often move in coordinated waves, amplifying price movements in both directions.
The concentration data adds another layer of concern. The top 4 short traders control 34.2% of all short positions, while the top 8 hold 53.8%. This concentration creates potential for rapid position adjustment if these large players shift strategies simultaneously.
How Should Investors Interpret Shanghai Premium Signals?
Shanghai Gold Exchange dynamics provide crucial East-West arbitrage insights that complement COMEX analysis. Current premiums and withdrawal patterns offer alternative perspectives on global gold demand that may differ from Western futures market signals.
Recent Shanghai Gold Exchange data shows physical gold withdrawals—a proxy for Chinese demand—maintaining steady levels despite Western market uncertainty. This divergence suggests regional demand patterns may support gold prices even as COMEX positioning unwinds.
Shanghai premiums over London spot gold provide real-time demand indicators from the world's largest gold consumer. When these premiums expand, they signal strong Eastern demand that can offset Western selling pressure. Current premium levels suggest balanced global supply distribution without extreme regional shortages.
The timing of Shanghai trading sessions creates arbitrage opportunities that sophisticated traders monitor closely. When COMEX inventory declines coincide with Shanghai premium expansion, they often signal genuine physical tightness rather than temporary positioning adjustments.
Currency dynamics add complexity to Shanghai analysis. A weakening yuan makes gold more expensive for Chinese buyers in local currency terms, potentially dampening demand regardless of dollar-denominated price levels. Recent yuan stability supports continued Chinese physical demand despite COMEX positioning concerns.
What Mining Sector Developments Impact Supply Outlook?
Gold mining sector fundamentals provide essential context for interpreting COMEX inventory changes. Production costs, mine development, and exploration activity all influence long-term supply availability that ultimately affects vault dynamics.
Current all-in sustaining costs (AISC) for major gold producers average approximately $1,200-1,400 per ounce according to recent company reports. With gold trading above $5,000 per ounce, miners enjoy exceptional profit margins that incentivize maximum production—potentially alleviating supply concerns reflected in inventory declines.
Our Mining Stock Analysis hub provides comprehensive coverage of sector developments affecting precious metals supply dynamics.
However, mine development timelines mean current high prices won't translate to increased production for 3-5 years. New discoveries require extensive permitting, financing, and construction phases before contributing to global supply. This lag effect means current inventory trends may persist longer than price signals alone suggest.
Exploration budgets have increased following gold's rally, but recent discoveries have been smaller and lower-grade than historical averages. This trend suggests long-term supply constraints may develop even if current inventory levels appear adequate.
Geopolitical factors affecting mining jurisdictions add another complexity layer. Recent tensions in key producing regions create supply chain risks that inventories must buffer against. COMEX vault levels provide crucial backup for Western market stability amid global supply uncertainties.
How Do Federal Reserve Policies Influence Precious Metals Strategies?
Federal Reserve monetary policy decisions create the macro backdrop against which all precious metals strategies must be evaluated. Current policy signals suggest a pause in the rate-cutting cycle that previously supported gold's advance, creating headwinds for continued price appreciation.
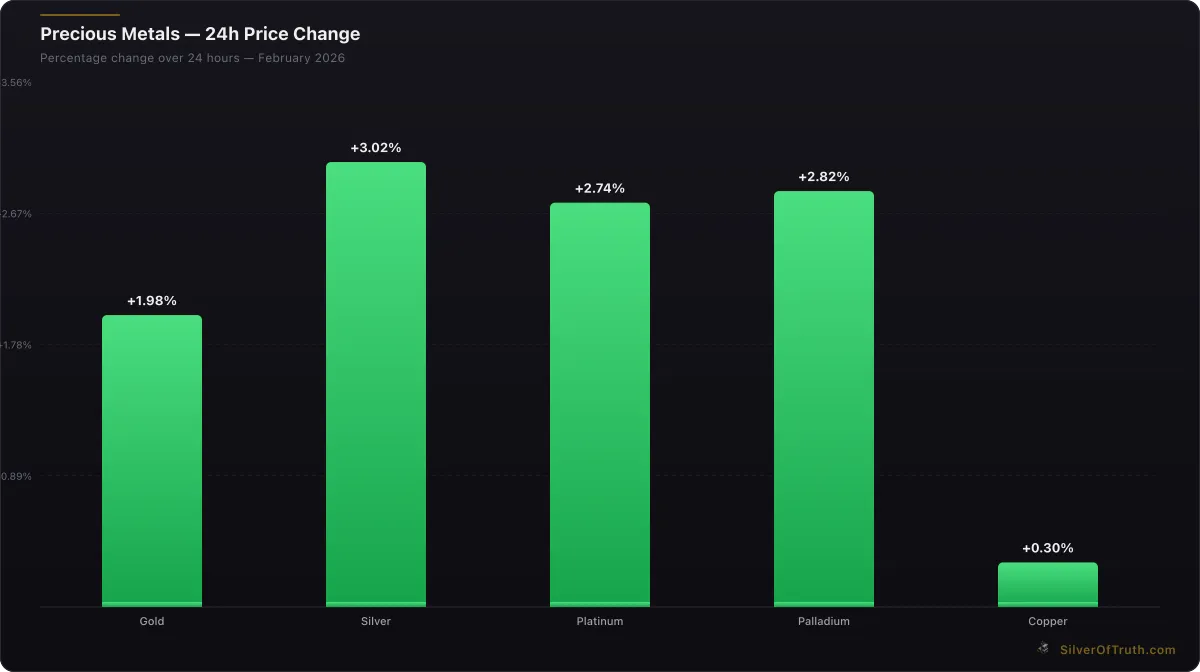
24-hour precious metals price changes. Source: SilverOfTruth, February 2026
Recent Federal Reserve communications indicate concern about persistent inflation pressures that may require extended restrictive policy. This stance reduces gold's appeal relative to yield-bearing alternatives like Treasury securities.
Interest rate expectations embedded in bond markets show traders anticipating fewer rate cuts than previously expected. This shift in rate expectations explains why sophisticated investors might reduce gold exposure despite physical market tightness indicated by inventory declines.
Quantitative tightening (QT) policies continue reducing Federal Reserve balance sheet size, removing dollar liquidity that previously supported asset prices including precious metals. This monetary headwind operates regardless of physical supply-demand fundamentals in gold markets.
Dollar strength resulting from hawkish Federal Reserve positioning creates additional precious metals headwinds. A stronger dollar makes gold more expensive for foreign buyers, potentially reducing international demand that might otherwise absorb declining COMEX inventory.
What Risk Management Strategies Address Current Market Conditions?
The combination of declining COMEX inventory and extreme speculative positioning creates a complex risk environment requiring nuanced portfolio strategies. Traditional approaches focusing solely on price direction may miss critical supply-demand dynamics emerging in physical markets.
Position sizing becomes crucial given the conflicting signals between physical tightness and speculative unwinding. Investors might consider maintaining core precious metals exposure while reducing short-term tactical positions until positioning extremes resolve.
Diversification across precious metals offers protection against gold-specific risks. Silver's different industrial demand profile and platinum's automotive applications provide alternative exposure to monetary metals themes while reducing concentration risk in any single metal.
Physical precious metals ownership provides insurance against COMEX delivery system stress that inventory declines might eventually trigger. While current coverage ratios suggest adequate delivery capacity, holding physical metal eliminates counterparty risks inherent in paper alternatives.
Use our Stack Calculator to optimize physical precious metals allocations based on current market conditions and risk tolerance.
Timing strategies must account for the disconnect between physical and paper markets. Dollar-cost averaging approaches may work better than attempting to time entry points during periods of unusual market structure like current conditions present.
What Does Technical Analysis Reveal About Price Trajectory?
Gold's price action at $5,056.40 per ounce (up 2.18% in 24 hours) appears disconnected from the bearish fundamentals suggested by positioning data and Federal Reserve policy shifts. This divergence often precedes significant price adjustments as technical and fundamental factors realign.
Recent price momentum shows gold testing the upper bounds of its trading range despite weakening fundamental support. Technical indicators suggest overbought conditions that align with the positioning extremes revealed in COT data.
Volume analysis supporting the recent price advance appears weak, with much of the movement occurring during lower-volume trading sessions. This pattern suggests institutional accumulation may be limited, supporting the positioning unwind narrative evident in open interest data.
Support levels established during gold's advance provide crucial downside targets if the speculative unwinding accelerates. Previous consolidation zones around $4,800-4,900 per ounce may attract buying interest if current technical levels fail to hold.
Volatility patterns show increasing intraday swings that typically accompany major position adjustments by large market participants. This volatility expansion often precedes significant directional moves as markets resolve conflicting fundamental and technical pressures.
How Should Portfolio Allocation Adapt to Current Dynamics?
Strategic precious metals allocation requires balancing the physical supply tightness indicated by inventory declines against the speculative excess revealed by positioning data. This complex environment demands flexible approaches that can adapt as conditions evolve.
Core portfolio allocations to precious metals might focus on physical ownership to capture potential supply constraints while avoiding the volatility inherent in leveraged futures positions. Physical metals provide exposure to long-term monetary trends without speculative positioning risks.
Tactical allocation adjustments could involve reducing exposure to gold-focused investments while maintaining broader precious metals diversification. Silver, platinum, and mining stocks offer alternative ways to participate in sector themes while avoiding gold's specific positioning challenges.
International diversification within precious metals strategies may help capture regional demand differences highlighted by Shanghai-COMEX arbitrage opportunities. Exchange-traded funds focused on different geographical markets provide exposure to these regional dynamics.
Rebalancing frequency might increase during periods of unusual market structure like current conditions. Monthly or quarterly rebalancing could help capture profit-taking opportunities while maintaining strategic precious metals exposure through volatile periods.
Conclusion
The 1.4% COMEX gold inventory decline creates a fascinating paradox when viewed alongside the massive speculative positioning unwind revealed by the 78,769-contract drop in open interest. While vault drawdowns suggest genuine physical demand, the futures market signals indicate a crowded speculative trade vulnerable to further liquidation.
For investors building robust precious metals strategies, this environment demands careful consideration of both physical supply dynamics and speculative positioning extremes. The disconnect between these factors may resolve through price adjustment as positioning normalizes.
Our comprehensive COMEX Explained hub provides additional insights into these complex market mechanisms that drive precious metals price discovery and investment opportunities.
Track real-time COMEX inventory changes and coverage ratios with SilverOfTruth for iOS, available on the App Store, to stay ahead of developing supply constraints in precious metals markets.
Sources
- CME Group COMEX Data: https://www.cmegroup.com/markets/metals.html
- CFTC Commitments of Traders Reports: https://www.cftc.gov/dea/futures/other_lf.htm
- Federal Reserve Policy Communications: https://www.federalreserve.gov/monetarypolicy/openmarket.htm
- Shanghai Gold Exchange Data: https://en.sge.com.cn
- World Gold Council Research: https://www.gold.org/goldhub/data
Disclaimer: This article is for informational and educational purposes only and does not constitute financial, investment, or trading advice. Past performance is not indicative of future results. Always conduct your own research and consult with a qualified financial advisor before making investment decisions. SilverOfTruth provides market data and analysis tools — it does not provide personalized financial advice.