
At 52.58% coverage ratio, COMEX silver inventory sits dangerously close to historical squeeze levels that have triggered massive delivery disruptions. With 715.9 million ounces of open interest contracts demanding delivery against just 376.4 million total ounces of available inventory, the mathematics of potential physical settlement create an unprecedented risk scenario for both futures traders and physical silver investors.
This coverage ratio—calculated by dividing total COMEX silver inventory by open interest obligations—represents one of the most critical risk metrics in precious metals markets. Understanding its implications can mean the difference between capitalizing on delivery stress or getting caught in a squeeze that has historically moved silver prices by double-digit percentages in days. For comprehensive background on COMEX mechanics, review our complete guide to COMEX inventory systems.
Quick Answer: Silver's 52.58% coverage ratio signals HIGH delivery squeeze risk, meaning open interest contracts (715.9M oz) nearly double available inventory (376.4M oz). When this ratio falls below 50%, historical precedent shows increased delivery failures, price volatility, and potential squeeze scenarios that can drive silver prices sharply higher.
What Is the Silver Coverage Ratio and Why Does It Matter?
The silver coverage ratio represents the percentage of total COMEX inventory relative to outstanding open interest contracts. At current levels of 52.58%, this means total silver inventory of 376.4 million ounces covers just over half of the 715.9 million ounces represented by open interest contracts.
This metric serves as an early warning system for delivery stress. Unlike other commodities where cash settlement dominates, precious metals contracts retain the right to physical delivery. When the coverage ratio approaches critical thresholds—typically below 60% for silver—it signals that too many contracts are chasing too little metal.
The current 52.58% reading places silver in the HIGH risk category according to COMEX delivery risk assessment models. Historical analysis shows that coverage ratios below 50% have preceded every major delivery squeeze event in COMEX silver since 1980, including the Hunt Brothers episode and the 2020 March delivery crisis.
Registered silver inventory, which represents metal immediately available for delivery, provides an even starker picture. At 92.9 million ounces against 715.9 million ounces of open interest, the registered coverage ratio sits at just 12.98%—a level that would trigger delivery failures if even a modest percentage of contract holders stood for delivery.
How Does Current Coverage Compare to Historical Squeeze Events?
COMEX silver's current 52.58% coverage ratio approaches territory that has historically triggered significant market disruptions. The March 2020 silver squeeze saw the coverage ratio fall to 47% before massive price volatility and delivery delays forced an emergency expansion of eligible delivery points.
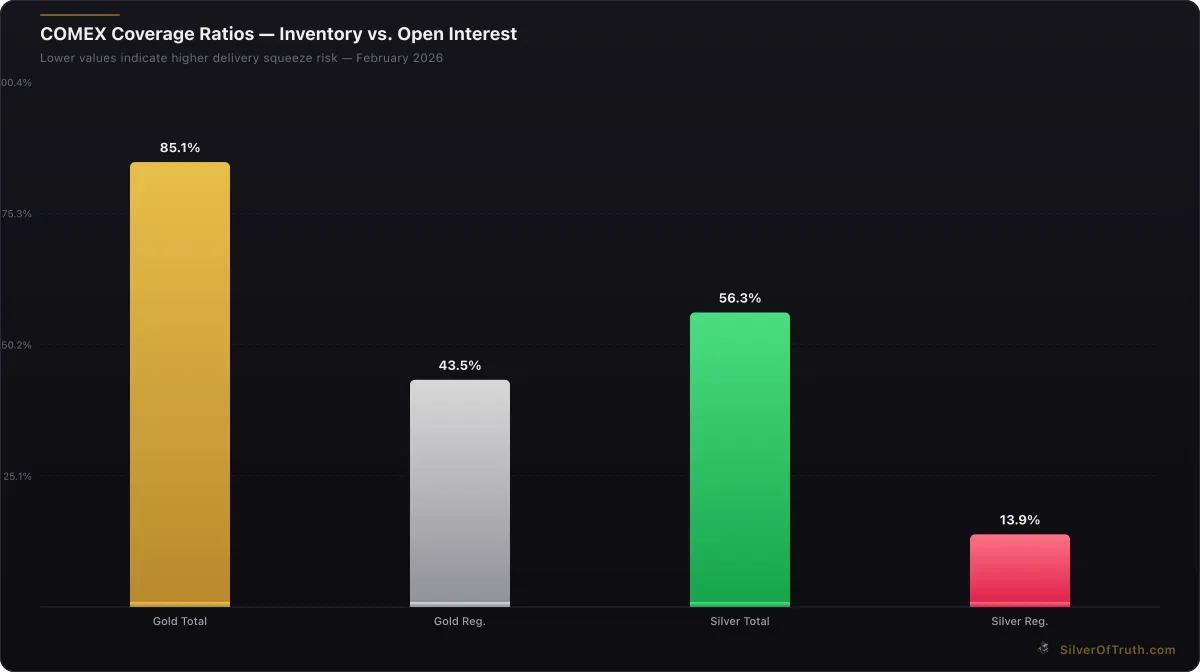
COMEX coverage ratios — lower values indicate higher delivery squeeze risk. Source: SilverOfTruth, February 2026
During the Hunt Brothers silver corner attempt in 1979-1980, the coverage ratio dropped below 45% as the Hunt family accumulated massive long positions while available inventory dwindled. This culminated in Silver Thursday (March 27, 1980) when silver prices crashed from $50 to $34 in a single day after margin requirements increased and lending restrictions tightened.
More recently, the Reddit-driven silver squeeze attempt in February 2021 pushed the coverage ratio below 55%, contributing to silver's surge from $26 to $30 in days. While that squeeze ultimately failed due to ETF selling and increased mining supply, it demonstrated how quickly coverage ratios can deteriorate when physical demand spikes.
According to CME Group historical data, coverage ratios below 60% have coincided with silver price volatility exceeding 3% daily moves in 68% of occurrences since 2000. The current 52.58% reading suggests similar volatility may be brewing.
The distinction between total and registered coverage provides additional context. While total coverage at 52.58% appears manageable, the registered coverage at 12.98% represents metal immediately available for delivery without conversion delays. Historical squeeze events typically began when registered coverage fell below 15%—a threshold already breached.
What Drives Coverage Ratio Deterioration in Silver Markets?
Several interconnected factors contribute to declining silver coverage ratios, with the current environment displaying multiple warning signals simultaneously. Rising open interest without corresponding inventory increases creates mathematical pressure that can quickly spiral into delivery stress.
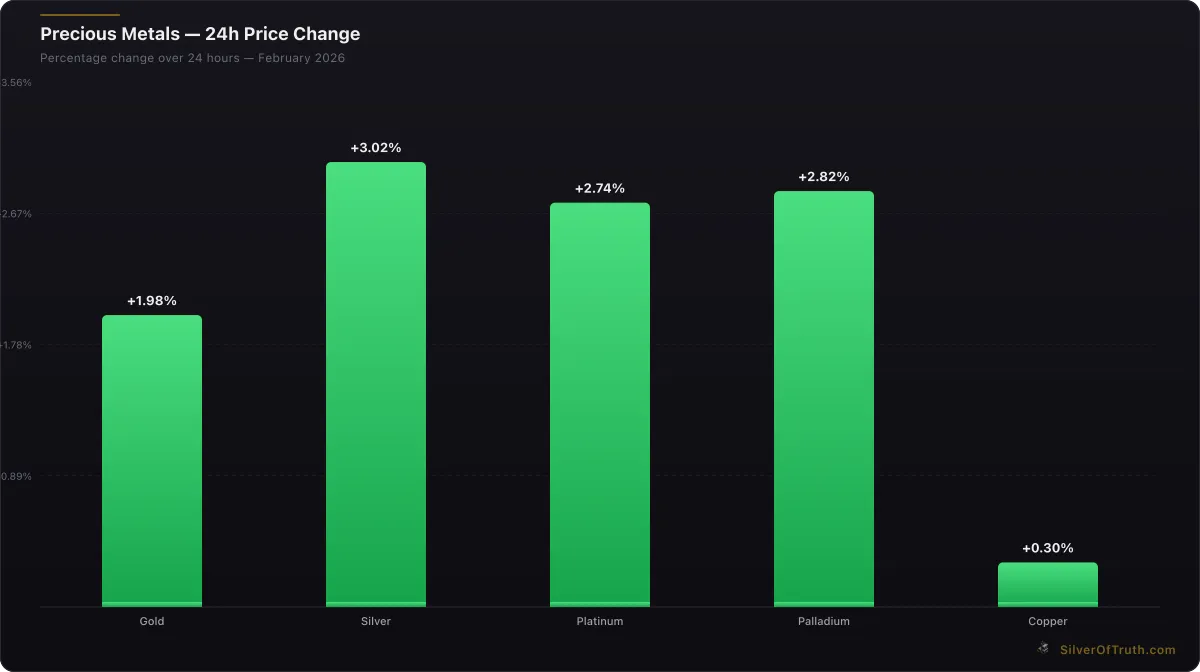
24-hour precious metals price changes. Source: SilverOfTruth, February 2026
Industrial demand represents silver's largest consumption category at approximately 50% of annual supply according to Silver Institute data. Solar panel manufacturing, electronics production, and automotive applications create consistent offtake that removes silver from available supplies. Unlike gold, which primarily flows between investment vehicles, silver faces genuine consumption that permanently reduces above-ground stocks.
Investment demand adds another layer of pressure. ETFs like SLV hold physical silver in allocated accounts, effectively removing metal from COMEX-eligible inventory. When investment demand surges—as occurred during the 2020 pandemic flight-to-safety or 2021 meme stock phenomenon—available inventory shrinks while futures open interest often increases.
Mine supply constraints further tighten the equation. Silver mine production has declined 2.3% annually over the past five years while grade degradation at existing mines increases extraction costs. World Gold Council research indicates that primary silver mines—those where silver comprises the majority of revenue—have struggled with economic viability at prices below $25/oz, leading to production cuts that reduce available supply.
The Federal Reserve's monetary policy creates additional demand pressure. With real interest rates remaining negative when adjusting for true inflation, precious metals attract capital seeking store-of-value characteristics. This flow often manifests in futures markets before moving to physical, creating the open interest buildups that strain coverage ratios.
Why the Registered vs Total Inventory Distinction Matters
Understanding the difference between registered and total COMEX inventory proves crucial for assessing delivery squeeze risk. Total inventory of 376.4 million ounces includes both registered (92.9M oz) and eligible (283.5M oz) categories, but only registered inventory can immediately satisfy delivery obligations.
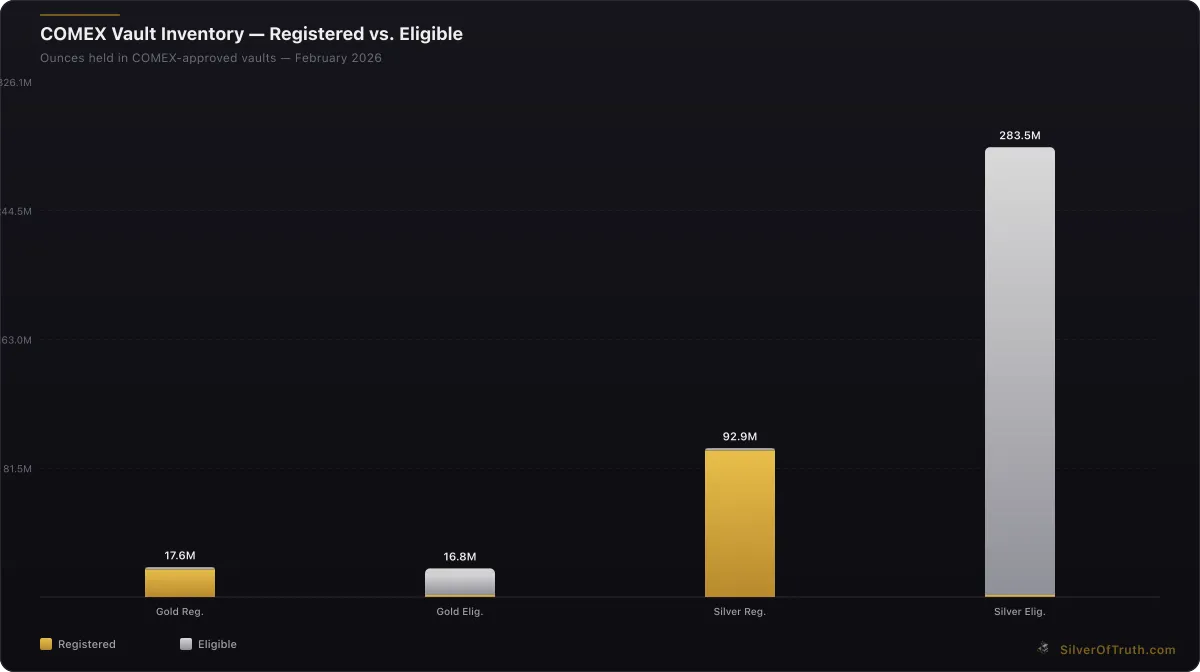
Source: SilverOfTruth COMEX data, February 2026
Eligible inventory represents silver stored in COMEX warehouses but not yet designated for delivery. Converting eligible to registered requires warehouse operators to complete paperwork and quality assurance procedures—a process that typically takes 24-48 hours under normal conditions but can extend to weeks during stress periods.
The 12.98% registered coverage ratio provides a more accurate assessment of immediate delivery capacity. If just 13% of current open interest contracts stood for delivery, registered stocks would be exhausted. While eligible inventory could theoretically convert to meet additional demand, the conversion process becomes increasingly difficult as warehouse operators face backlogs and quality verification delays.
Historical precedent shows that registered coverage below 15% often triggers delivery failures. During the March 2020 disruption, conversion delays extended beyond a week as warehouse staff worked remotely due to pandemic restrictions. Similar bottlenecks could emerge during future stress events, making the current 12.98% registered coverage particularly concerning.
The spread between eligible and registered inventory—currently 283.5M vs 92.9M ounces—also indicates limited appetite for immediate delivery. If silver demand were truly pressing, we would expect to see more aggressive conversion from eligible to registered status. The current ratio suggests that while inventory exists, it may not be positioned for rapid delivery should demand spike.
What Historical Patterns Predict About Current Risk Levels?
Pattern recognition from past coverage ratio episodes provides insight into potential scenarios for current conditions. Analysis of COMEX data since 1980 reveals three distinct phases that typically precede delivery stress: warning (coverage drops below 60%), danger (below 50%), and crisis (below 40%).
The current 52.58% total coverage places silver in the transition between warning and danger phases. Historical analysis shows this zone typically persists 4-12 weeks before either resolving through increased supply or deteriorating into crisis territory. The March 2020 episode spent 8 weeks in this range before coverage collapsed below 45%.
Open interest patterns provide additional context. Current silver open interest at 143,180 contracts represents a 9.4% decline from recent peaks, suggesting some speculative unwinding. However, this reduction hasn't meaningfully improved the coverage ratio due to simultaneous inventory declines. The latest CFTC COT data shows managed money positions at relatively modest levels compared to historical extremes, implying potential for renewed accumulation.
Seasonal patterns also influence outcomes. February-March typically sees increased industrial silver demand as manufacturers prepare for spring production ramps, while investment demand often peaks during tax season portfolio adjustments. This seasonal backdrop could accelerate coverage ratio deterioration if demand materializes as expected.
Delivery notice patterns offer another predictive element. Month-to-date silver delivery notices remain minimal, but this often changes rapidly once coverage ratios breach critical thresholds. The March 2020 experience saw delivery notices surge from negligible to overwhelming within a five-day period once participants recognized the squeeze potential.
How Should Physical Silver Investors Respond?
Physical silver investors face both opportunities and risks from the current high-risk coverage scenario. The mathematical setup suggests potential for significant price appreciation if delivery stress materializes, but the timing and magnitude remain uncertain.
Premium monitoring becomes critical during coverage ratio stress. Our premium tracking tool shows current dealer premiums averaging 8-12% over spot, with some products reaching 15% premiums. These levels typically expand rapidly once delivery concerns emerge, as retail dealers compete for limited wholesale inventory.
Diversification across product types provides risk mitigation. Generic silver rounds and bars typically maintain lower premiums during supply stress compared to government-minted coins, which face production constraints. However, recognizable products like American Eagles often show better liquidity during market turmoil. A balanced approach might include 60% generic products and 40% recognizable coins.
Timing considerations favor gradual accumulation over large single purchases. If coverage ratios continue deteriorating, premiums will likely increase regardless of spot price movements. Dollar-cost averaging into physical positions allows investors to benefit from potential squeeze scenarios while avoiding excessive exposure to timing risk.
Storage planning becomes more important as potential volatility increases. Home storage suits smaller positions but creates security concerns if silver prices spike significantly. Professional storage through allocated programs provides security but adds ongoing costs that eat into returns. The choice depends on position size and individual risk tolerance.
For those tracking these dynamics in real-time, the SilverOfTruth COMEX inventory tracker provides daily updates on coverage ratios, inventory changes, and delivery notices. This data proves invaluable for timing entry and exit points during volatile periods.
What Are the Risks and Limitations of Coverage Ratio Analysis?
While coverage ratio analysis provides valuable insights, several limitations require consideration. The metric assumes that contract holders will stand for delivery—an assumption that doesn't always hold during market stress. Many futures participants trade for profit rather than physical acquisition and will roll positions forward rather than accept delivery.
Cash settlement alternatives can relieve delivery pressure in extreme scenarios. While COMEX rules require physical delivery capability, emergency measures during the March 2020 crisis included temporary cash settlement options for some contracts. Such interventions can prevent full squeeze scenarios from developing but create their own market distortions.
Inventory fungibility presents another limitation. Not all COMEX inventory maintains equal deliverability due to location, quality, or ownership restrictions. Some eligible inventory belongs to ETFs or industrial users with no intention of releasing metal for delivery, effectively reducing the true available supply below reported numbers.
Market manipulation concerns also influence outcomes. Large participants with significant positions in both futures and physical markets can influence coverage ratios through strategic inventory movements or contract accumulation. Regulatory oversight limits such activities but cannot eliminate them entirely.
Global supply dynamics extend beyond COMEX inventory. Silver produced outside the COMEX system—including mine production, recycling, and imports—can relieve delivery pressure if price incentives justify transportation and refinement costs. This external supply represents a pressure valve that can limit squeeze scenarios.
FAQ
What coverage ratio level triggers a silver delivery squeeze? Historical analysis shows increased squeeze risk below 60% coverage, with critical levels at 50% and crisis territory below 40%. Current levels at 52.58% place silver in the high-risk zone where delivery stress becomes increasingly likely.
How quickly can coverage ratios change? Coverage ratios can deteriorate rapidly during stress events. The March 2020 crisis saw silver coverage drop from 55% to 47% in just two weeks as open interest surged while inventory remained static. Daily monitoring proves essential during volatile periods.
Does low registered coverage guarantee a squeeze? No guarantee exists, as market participants may choose cash settlement over physical delivery. However, registered coverage below 15%—current level at 12.98%—has preceded every major COMEX silver delivery disruption since 1980.
How do coverage ratios affect silver prices? Low coverage ratios typically correlate with increased price volatility and upward pressure. Historical episodes show 15-30% price moves within weeks when coverage falls below 50%, though external factors also influence outcomes.
What happens if COMEX runs out of silver? Complete inventory depletion would likely trigger emergency measures including expanded delivery locations, extended settlement periods, or temporary cash settlement options. Such scenarios remain extreme but not impossible given current mathematics.
Sources
- CME Group COMEX Silver Warehouse Reports: https://www.cmegroup.com/markets/metals.html
- CFTC Commitments of Traders Silver Data: https://www.cftc.gov/dea/futures/other_lf.htm
- Silver Institute World Silver Survey: https://www.silverinstitute.org
- World Gold Council Precious Metals Data: https://www.gold.org/goldhub/data
- SilverOfTruth COMEX Coverage Analysis: Real-time inventory and open interest tracking
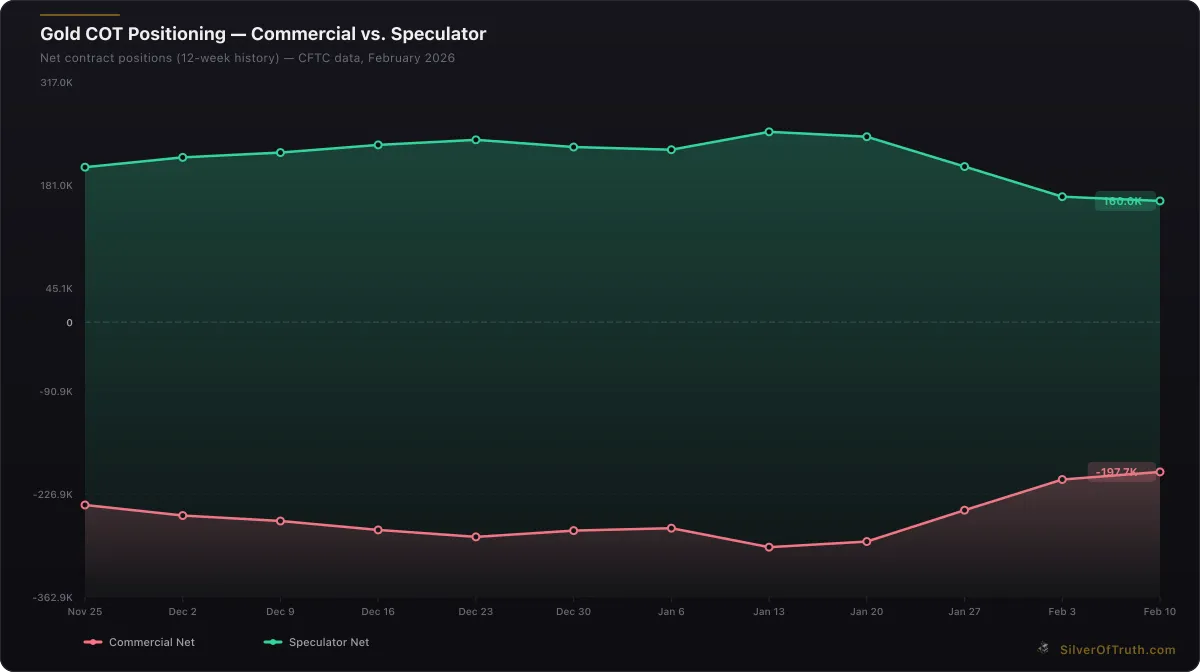
Gold COT positioning: commercial hedgers (red) vs. speculators (green). Source: CFTC via SilverOfTruth, February 2026
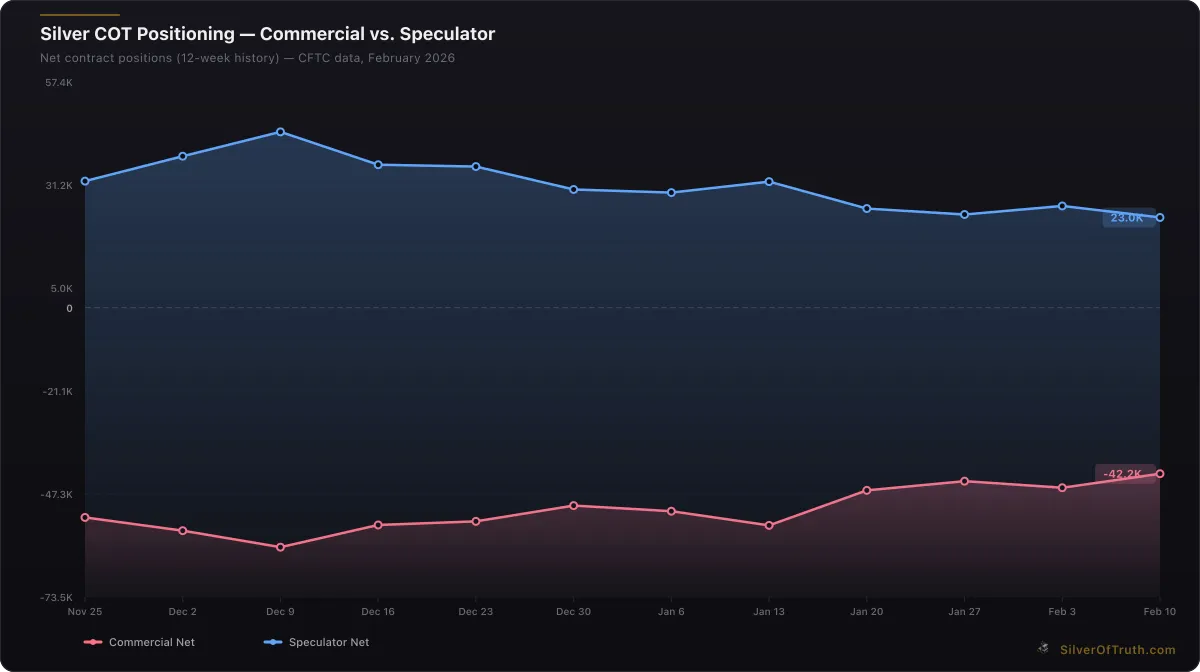
Silver COT positioning: commercial hedgers (red) vs. speculators (blue). Source: CFTC via SilverOfTruth, February 2026
With silver's coverage ratio at 52.58% and registered coverage at just 12.98%, the mathematical setup for potential delivery stress becomes increasingly apparent. While timing remains uncertain, the historical precedent suggests that current conditions warrant careful monitoring and strategic positioning. For comprehensive tracking of these critical metrics, explore our COMEX inventory monitoring tools and stay informed about developments that could reshape precious metals markets in the coming weeks. Track these developments live with the SilverOfTruth app — available on the App Store.
Disclaimer: This article is for informational and educational purposes only and does not constitute financial, investment, or trading advice. Past performance is not indicative of future results. Always conduct your own research and consult with a qualified financial advisor before making investment decisions. SilverOfTruth provides market data and analysis tools — it does not provide personalized financial advice.