
Silver's coverage ratio has reached a concerning 52.6% as COMEX inventory faces persistent pressure, creating what analysts classify as a "high-risk" scenario for potential delivery squeezes. With registered silver holdings at just 92.9 million ounces against 715.9 million ounces of open interest, investors are scrambling to understand what this metric means for their precious metals strategies and portfolio protection.
Understanding these inventory dynamics is crucial for anyone involved in silver investing, whether through physical stacking, mining stocks, or futures exposure. Our comprehensive COMEX Explained hub provides the foundational knowledge needed to navigate these complex market mechanics.
Quick Answer: A silver coverage ratio of 52.6% means COMEX total inventory can only satisfy about half of potential delivery demands if all futures contracts stood for delivery. This "high-risk" level historically precedes supply stress periods, making defensive positioning and physical silver accumulation increasingly important for portfolio protection.
What Is the Silver Coverage Ratio and Why Does 52.6% Matter?
The coverage ratio represents the relationship between COMEX silver inventory and outstanding futures contracts. Specifically, it measures how many times the total warehouse inventory could satisfy all open interest if every contract demanded physical delivery simultaneously.
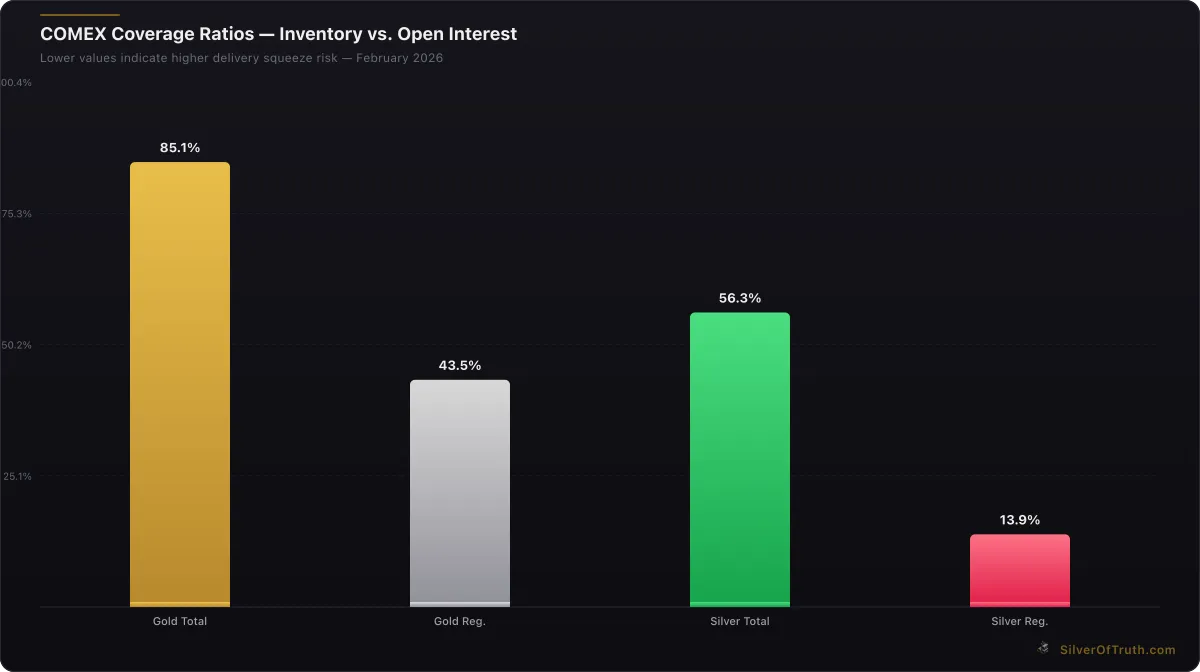
COMEX coverage ratios — lower values indicate higher delivery squeeze risk. Source: SilverOfTruth, February 2026
At 52.6%, COMEX silver faces a scenario where total inventory of 376.4 million ounces covers just over half of the 715.9 million ounces represented by 143,180 open contracts. This ratio has deteriorated significantly from levels above 60% seen in late 2025, according to CME Group warehouse data.
The classification system used by most analysts considers:
- Low Risk: Above 80% coverage
- Medium Risk: 60-80% coverage
- High Risk: 40-60% coverage
- Critical Risk: Below 40% coverage
Historical analysis shows that ratios below 55% have coincided with delivery stress periods, including the March 2020 silver squeeze when registered inventory plummeted and premiums spiked across the physical market. The current 52.6% reading places silver firmly in high-risk territory.
More concerning is the registered coverage ratio of just 12.98%, meaning only the 92.9 million ounces of registered (immediately deliverable) silver could satisfy less than 13% of open interest. This creates a potential powder keg if delivery demand increases significantly.
How Do COMEX Inventory Levels Create Delivery Risk?
COMEX silver inventory operates on a two-tier system that directly impacts delivery capability and market stability. The current breakdown reveals critical stress points that savvy investors must understand.
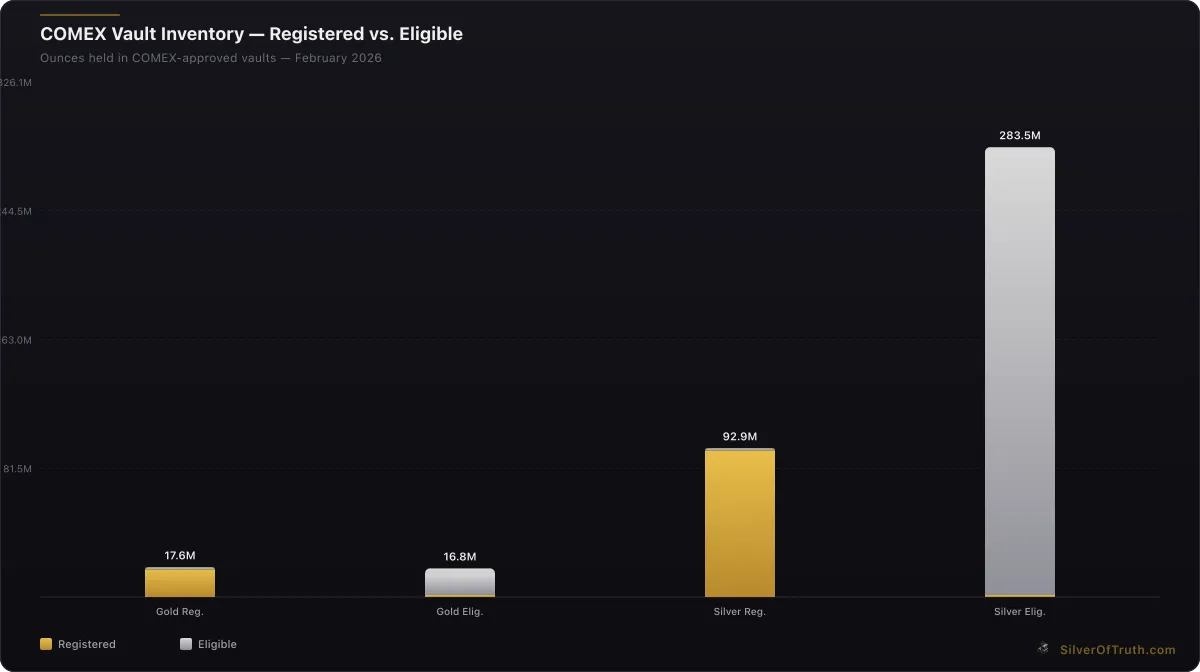
Source: SilverOfTruth COMEX data, February 2026
Eligible vs. Registered Dynamics
The 376.4 million total ounces split into 283.5 million eligible and 92.9 million registered creates an immediate bottleneck. Eligible silver sits in COMEX warehouses but cannot be delivered until converted to registered status—a process requiring warehouse operator consent and fee payment.
Recent inventory changes show total holdings declining 0.74% week-over-week, with registered stocks bearing the brunt of outflows. This pattern suggests active delivery activity or strategic repositioning by large holders, both of which tighten available supply.
Open Interest Concentration Effects
With 143,180 contracts outstanding (each representing 5,000 ounces), the silver futures market faces potential concentration risk. CFTC Commitments of Traders data reveals that the largest four traders hold 35.6% of short positions, creating scenarios where delivery pressure could force rapid inventory adjustments.
Commercial shorts at 80,973 contracts maintain heavy hedge positions, while managed money and other speculators hold significant long exposure. If fundamental conditions trigger increased delivery intentions, the current inventory base may prove insufficient without substantial premium increases to discourage physical offtake.
Historical Precedents and Warning Signs
The March 2020 episode provides a blueprint for how inventory stress manifests. Coverage ratios dropped below 45%, registered stocks fell to multi-year lows, and retail premiums exploded from $2-3 over spot to $8-12 over spot within weeks.
Current conditions show similar warning signs: declining total inventory, stressed registered levels, and persistent open interest despite recent reductions. The 52.6% coverage ratio sits uncomfortably close to levels that historically triggered supply chain disruptions.
What Are the Most Effective Portfolio Protection Strategies?
Smart investors are implementing multi-layered approaches to navigate the high-risk coverage environment while positioning for potential inventory-driven price moves.
Physical Silver Accumulation Strategy
The most direct protection involves increasing physical silver exposure before supply stress manifests in retail markets. Our physical silver investing guide outlines systematic accumulation approaches, but current conditions warrant accelerated timelines.
Priority should focus on readily available forms like American Eagles, Canadian Maples, and recognized 1,000-ounce bars. Avoid exotic products with wide bid-ask spreads that become difficult to liquidate during market stress. Dollar-cost averaging remains valid, but consider front-loading purchases if coverage ratios deteriorate further.
Storage considerations become critical as holdings increase. Bank safety deposit boxes, private vaults, and allocated storage programs offer different risk/cost profiles. The key is maintaining liquidity access while ensuring security—compromising either factor during inventory stress periods can prove costly.
Mining Stock Positioning for Supply Leverage
Silver mining equities provide leveraged exposure to price increases driven by supply constraints. Companies with low all-in sustaining costs (AISC) and substantial reserves benefit most from inventory-driven price spikes.
Focus on established producers with AISC below $18/ounce and proven reserve bases. Junior miners carry higher risk but offer explosive upside if silver prices gap higher on delivery stress. Geographic diversification across mining jurisdictions helps mitigate political risks.
ETFs like SIL and SILJ provide diversified mining exposure without individual stock selection risk. However, review holdings periodically as some miners hedge future production, limiting their leverage to silver price increases.
Futures and Options Defensive Positioning
Sophisticated investors can use derivatives markets to hedge portfolio exposure while maintaining upside participation. Long silver futures or call options benefit from delivery squeeze scenarios, but require active risk management.
Calendar spreads exploiting backwardation can capture storage premiums during tight inventory periods. Put spreads on silver miners protect against broader market selloffs while maintaining precious metals exposure.
Options strategies like protective puts on physical holdings or collar structures around mining positions provide downside protection while preserving upside potential. The key is matching derivative exposure to underlying physical and equity positions.
How Does Current COT Positioning Influence Risk Assessment?
The latest Commitments of Traders report from February 3rd reveals positioning dynamics that interact with inventory constraints to shape market behavior.
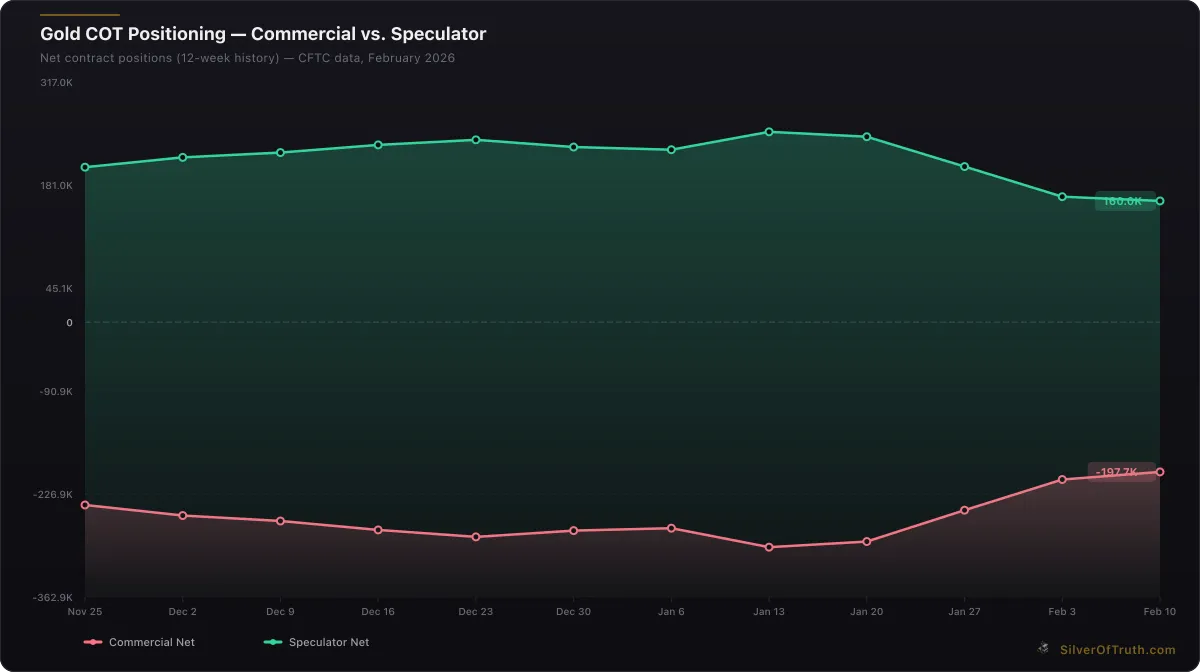
Gold COT positioning: commercial hedgers (red) vs. speculators (green). Source: CFTC via SilverOfTruth, February 2026
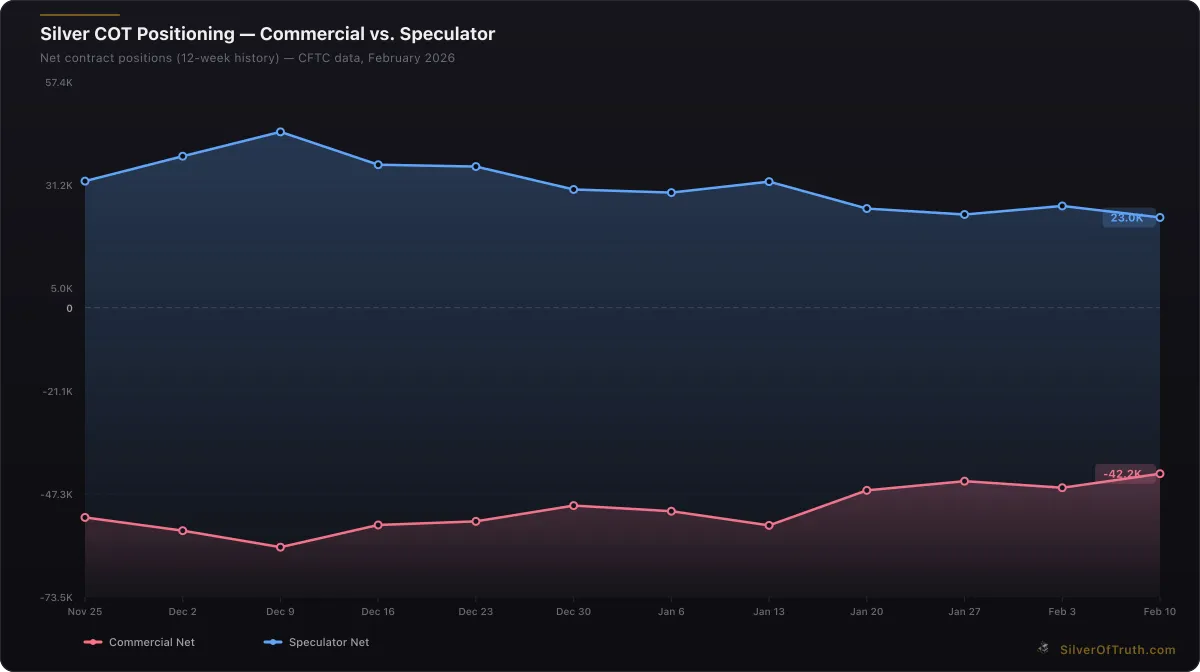
Silver COT positioning: commercial hedgers (red) vs. speculators (blue). Source: CFTC via SilverOfTruth, February 2026
Commercial Hedging Patterns
Commercial traders maintain a net short position of 45,725 contracts, representing their traditional hedging stance. However, this positioning has decreased from more extreme levels, suggesting reduced hedging pressure from miners and industrial users.
The commercial short position of 80,973 contracts concentrated among the largest four traders (35.6% of total shorts) creates potential volatility if inventory stress forces position adjustments. Commercial shorts typically add to positions on price rallies, but inventory constraints could limit their willingness to expand shorts if delivery risks increase.
Speculative Positioning Dynamics
Non-commercial traders hold a net long position of 25,877 contracts, relatively balanced compared to extreme positioning seen in previous cycles. This moderate speculative interest suggests room for additional buying if inventory concerns attract momentum traders.
Managed money positioning at net +4,983 contracts remains well below historically crowded levels. This positioning structure could support sustained moves higher if inventory metrics deteriorate further, as speculators aren't heavily committed to either direction.
Concentration Risk Implications
The top four traders control 35.6% of short positions compared to 22.6% of long positions, creating asymmetric concentration that could amplify moves if large shorts need to cover. Combined with inventory constraints, this positioning increases the likelihood of sharp price movements rather than gradual adjustments.
Recent weekly changes show both commercial and speculative interests reducing positions, suggesting uncertainty about near-term direction. However, if inventory continues declining while open interest stabilizes, positioning imbalances could rapidly develop.
What Economic Factors Could Trigger Inventory Crisis?
Multiple macroeconomic catalysts could transform the current high-risk coverage scenario into an active supply crisis, making defensive positioning increasingly urgent.
Federal Reserve Policy and Dollar Dynamics
Recent Fed communications suggest potential policy shifts that could weaken the dollar and increase precious metals demand. If real interest rates turn more negative due to persistent inflation or dovish policy pivots, silver could attract substantial investment flows.
The current gold-to-silver ratio of 64.99 sits near historical averages but could compress rapidly if industrial demand combines with investment buying. Silver's dual nature as both precious metal and industrial commodity creates multiple demand vectors during economic uncertainty.
Currency debasement concerns are rising globally as central banks maintain expansionary policies despite inflationary pressures. Silver's role as monetary metals could drive demand that exceeds current inventory capacity to supply without significant premium adjustments.
Industrial Demand Acceleration
Solar panel installations continue accelerating globally, with silver consumption per panel remaining stubbornly high despite efficiency improvements. The Silver Institute's latest data shows industrial demand growth outpacing mine supply increases.
Electric vehicle adoption and 5G infrastructure buildouts create additional industrial silver demand that competes with investment buying for available supply. These industrial users typically pay market prices without the price sensitivity of investment buyers, creating a floor under demand.
Supply chain disruptions affecting industrial silver delivery could force users to access COMEX inventories, directly impacting coverage ratios. Industrial demand operates on different timeframes than investment demand, creating sustained pressure rather than speculative spikes.
Geopolitical Supply Disruption Risks
Major silver producing regions face increasing geopolitical instability that could disrupt mine supply. Peru, Mexico, and Chile combined produce over 50% of global silver mine output, making supply vulnerable to political or social disruptions.
Trade tensions between major economies could affect silver flow patterns, potentially increasing demand for North American stored silver. COMEX inventories could become preferred supply sources if international shipping faces restrictions or delays.
Currency controls or export restrictions by producing nations could force buyers to access futures market delivery, directly pressuring COMEX inventories. These scenarios have precedent in other commodities and could develop rapidly during crisis periods.
How Can Investors Monitor and Respond to Coverage Changes?
Successful navigation of high-risk coverage periods requires systematic monitoring of key indicators and predetermined response protocols.
Essential Tracking Metrics
Weekly COMEX inventory reports provide the foundation for coverage analysis, but daily warehouse movements offer earlier warning signals. Track both absolute inventory changes and the eligible-to-registered conversion rates, as shifts between categories precede delivery stress.
Open interest changes relative to inventory movements reveal market participants' delivery intentions. Rising open interest with declining inventory creates increasingly stressed coverage, while falling open interest provides temporary relief.
Monitor retail premium indicators from major dealers as early warning systems. Physical premiums typically spike before futures markets fully reflect delivery stress, providing opportunities for proactive positioning adjustments.
Response Framework Development
Establish coverage ratio thresholds that trigger specific portfolio actions. Consider increasing physical allocation when coverage drops below 50%, and implementing full defensive strategies if ratios approach 40%.
Pre-arranged relationships with reputable dealers ensure allocation access during supply stress periods. Many dealers limit customer purchases during tight supply, making existing relationships valuable for inventory access.
Develop liquid position sizing that allows rapid strategy adjustments. Overcommitment to illiquid positions prevents tactical responses to changing inventory dynamics.
Track real-time coverage data using our COMEX inventory tracker to stay informed of developing conditions and make timely portfolio adjustments based on the latest warehouse reports.
What Are the Long-Term Implications for Silver Markets?
The current high-risk coverage environment reflects structural changes in silver markets that extend beyond temporary inventory adjustments.
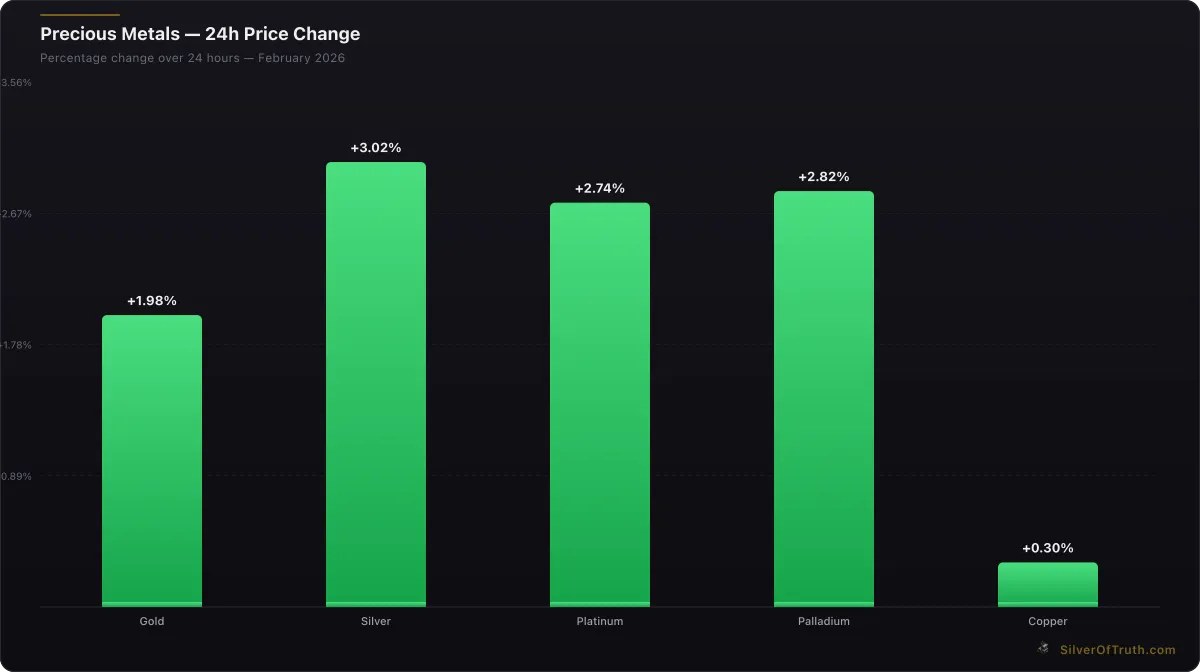
24-hour precious metals price changes. Source: SilverOfTruth, February 2026
Supply-Demand Fundamental Shifts
Mine production growth continues lagging consumption increases across both investment and industrial categories. The Silver Institute's World Silver Survey projects persistent deficits that must be satisfied through above-ground stock drawdowns.
COMEX inventory represents a significant portion of visible above-ground silver stocks, making warehouse levels critical barometers of global supply adequacy. Continued pressure on these inventories suggests broader supply tightness rather than temporary dislocations.
Investment demand patterns are shifting toward physical ownership rather than paper exposure, creating sustained pressure on deliverable stocks. This trend accelerates during periods of monetary uncertainty and could persist regardless of short-term price movements.
Market Structure Evolution
The concentration of silver storage in COMEX warehouses creates systemic vulnerabilities as markets globalize. Alternative storage and trading mechanisms may develop to reduce dependence on New York-based inventory.
Delivery mechanisms face increasing scrutiny as coverage ratios tighten. Reforms to registered/eligible systems or warehouse operations could emerge to improve market function, but implementation would likely follow rather than prevent crisis periods.
Price discovery mechanisms may shift away from futures markets toward physical markets if inventory constraints persist. This evolution would favor physical ownership over paper exposure, reinforcing current defensive strategies.
FAQ
What happens if the silver coverage ratio drops below 40%?
Coverage ratios below 40% typically trigger critical supply stress, leading to delivery delays, cash settlements, or force majeure declarations. Physical premiums often spike 300-500% above spot prices as retail markets compete for limited supply. Historical precedents include temporary futures market disruptions and emergency policy interventions.
Should I convert paper silver positions to physical silver now?
Converting paper positions to physical depends on your risk tolerance and storage capabilities. High coverage risk favors physical ownership, but consider transaction costs, storage security, and liquidity needs. A balanced approach might involve increasing physical allocation while maintaining some liquid paper positions for tactical trading.
How quickly can COMEX inventory levels change?
COMEX inventory can change rapidly during crisis periods. Daily movements of 1-2 million ounces are common during stressed conditions, while normal periods see changes of 100,000-500,000 ounces daily. Large deliveries or warehouse movements can create million-ounce daily swings that quickly impact coverage ratios.
Do other precious metals show similar coverage stress?
Gold maintains a healthier 84% coverage ratio with lower delivery risk currently. Platinum and palladium trade on different exchanges with different inventory structures. Silver's unique position reflects its dual monetary and industrial nature, creating more complex supply-demand dynamics than other precious metals.
What early warning signs indicate worsening inventory stress?
Watch for accelerating registered inventory declines, rising backwardation in futures curves, widening retail premiums, increased delivery notices, and warehouse warrant withdrawals. These indicators often precede sharp coverage ratio deterioration and provide opportunities for defensive positioning before crisis conditions develop.
Understanding and responding to silver's high-risk coverage environment requires systematic monitoring and proactive strategies. Our COMEX Explained educational hub provides deeper insights into these critical market mechanics, while practical tools help track developments in real-time.
As inventory pressures mount and coverage ratios remain stressed, defensive positioning becomes increasingly prudent. Whether through physical accumulation, mining equity exposure, or derivatives hedging, investors with systematic approaches to inventory risk management will be better positioned to navigate potential supply disruptions and capitalize on resulting price movements.
Sources
- CME Group COMEX Warehouse Reports: https://www.cmegroup.com/markets/metals.html
- CFTC Commitments of Traders Reports: https://www.cftc.gov/dea/futures/other_lf.htm
- Silver Institute World Silver Survey: https://www.silverinstitute.org
- Federal Reserve Economic Data: https://fred.stlouisfed.org
- U.S. Bureau of Labor Statistics: https://www.bls.gov
Disclaimer: This article is for informational and educational purposes only and does not constitute financial, investment, or trading advice. Past performance is not indicative of future results. Always conduct your own research and consult with a qualified financial advisor before making investment decisions. SilverOfTruth provides market data and analysis tools — it does not provide personalized financial advice.