
COMEX gold inventory plunged -0.83% this week, bringing total vault holdings to 34.45 million ounces as registered stocks sit at 17.59 million ounces. This decline occurs while gold trades at $4,930.10, down -0.37% in the past 24 hours, creating a disconnect between physical availability and price action that demands careful analysis.
The inventory drop coincides with significant shifts in CFTC Commitments of Traders positioning, where speculators reduced net long positions by nearly 40,000 contracts amid falling open interest. This combination of declining physical inventory and unwinding paper positions presents a complex landscape for investors navigating current gold market trends.
Understanding what drives COMEX vault movements—and how they interact with futures positioning—remains critical for developing sound investment strategies in today's volatile precious metals environment. The current data reveals underlying structural tensions that may influence gold's trajectory in coming weeks.
COMEX Gold Inventory Breakdown
Total COMEX gold inventory stands at 34.45 million ounces, comprised of 16.86 million eligible ounces and 17.59 million registered ounces. The -0.83% weekly decline represents approximately 287,000 ounces leaving the system, marking the continuation of a drawdown trend that began in late January.
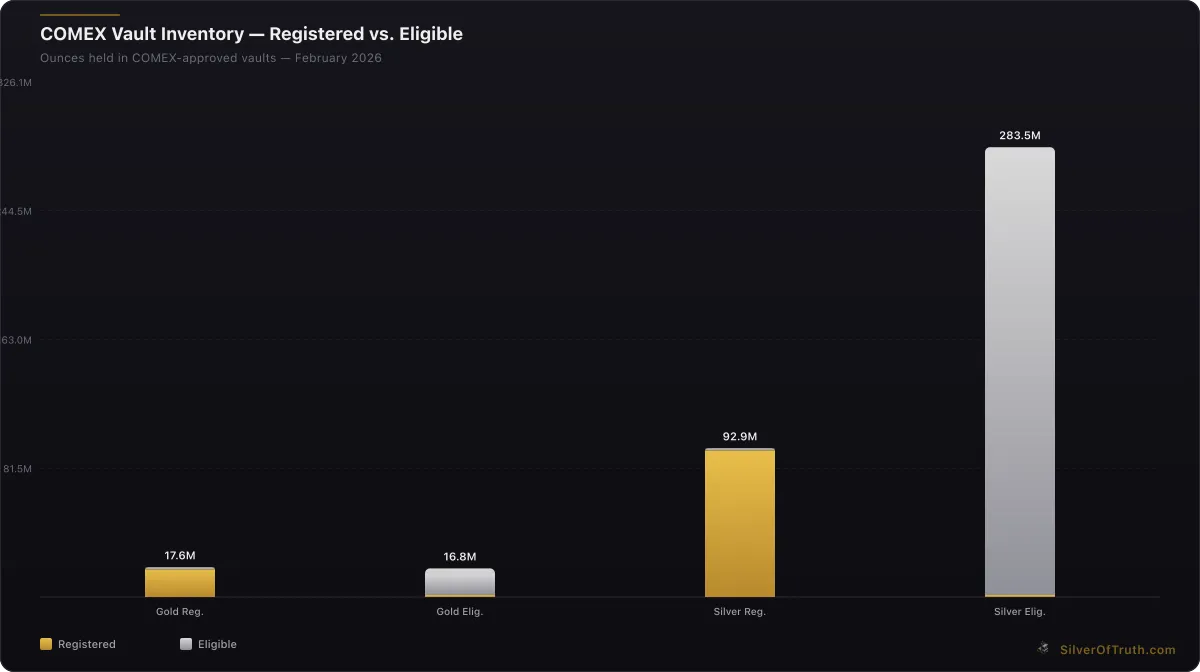
Source: SilverOfTruth COMEX data, February 2026
Registered inventory—the portion immediately available for delivery against futures contracts—accounts for 51.1% of total holdings at 17.59 million ounces. This registered-to-total ratio remains within historical norms, though the absolute decline suggests either conversions to eligible status or outright withdrawals from the warehouse network.
According to CME Group COMEX data, eligible inventory represents gold stored in approved depositories but not currently warranted for delivery. The current 16.86 million eligible ounces can convert to registered status when owners elect to make their metal available for futures settlement.
The coverage ratio—measuring inventory against open interest—currently sits at 84.08% for total inventory and 42.93% for registered stocks alone. With open interest at 409,694 contracts (equivalent to 40.97 million ounces), the system maintains adequate coverage despite recent declines. However, this ratio has compressed from higher levels seen in 2025, indicating tighter physical availability relative to paper claims.
Weekly vault activity shows net outflows across multiple depositories, with Delaware Depository and HSBC reporting the largest withdrawals. This pattern suggests institutional players or large holders are removing metal from the COMEX system, potentially for storage in non-exchange facilities or international shipment.
Futures Positioning and COT Analysis
The latest COT report reveals dramatic shifts in speculative positioning that provide context for the inventory decline. Non-commercial traders (speculators) reduced their net long position by 39,792 contracts to 165,604, while total open interest plunged by 78,769 contracts to 409,694.
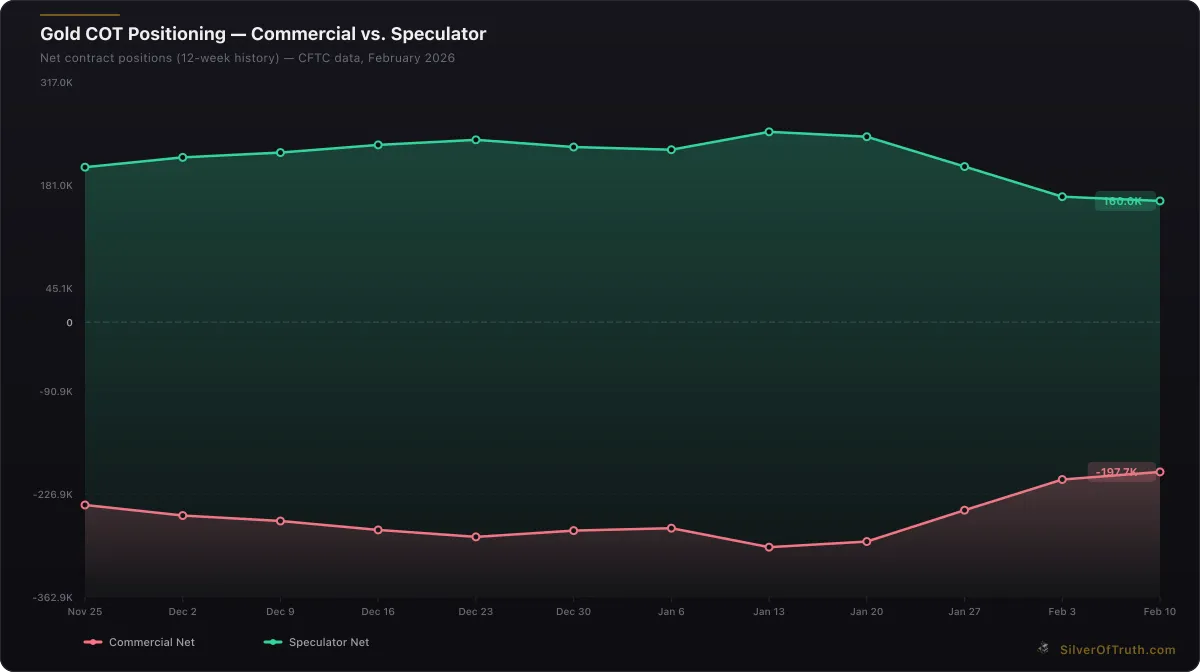
Gold COT positioning: commercial hedgers (red) vs. speculators (green). Source: CFTC via SilverOfTruth, February 2026
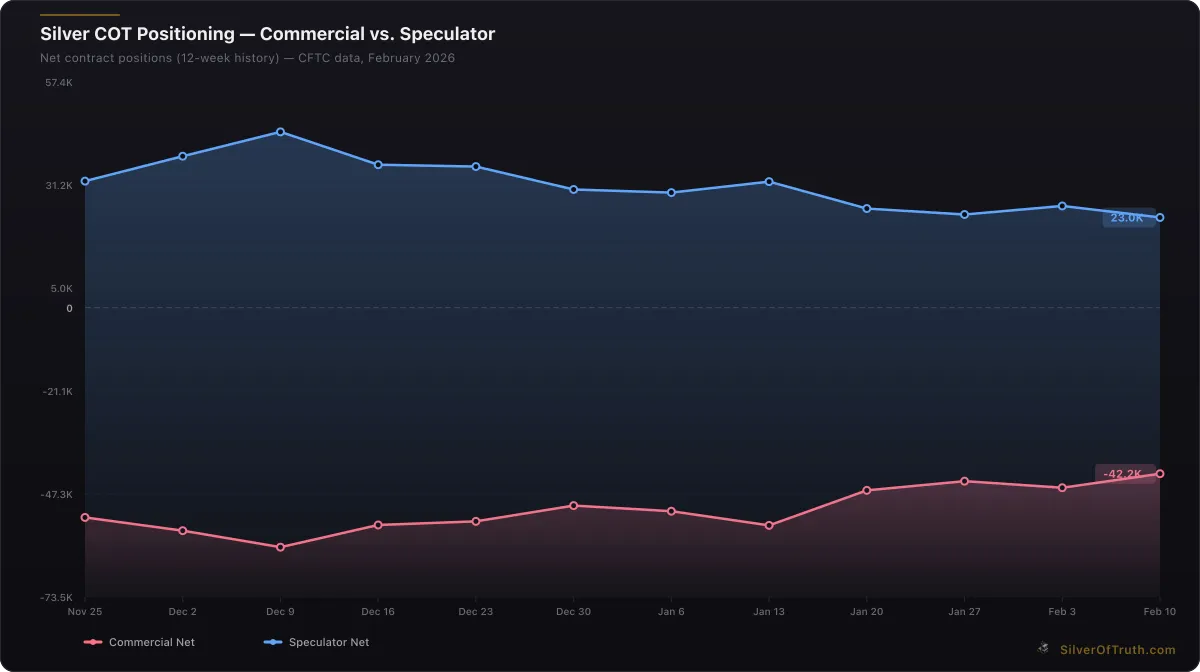
Silver COT positioning: commercial hedgers (red) vs. speculators (blue). Source: CFTC via SilverOfTruth, February 2026
Commercial traders—typically miners, refiners, and bullion banks—maintain a massive net short position of -207,778 contracts. However, they covered 40,507 contracts during the reporting week, suggesting reduced hedging pressure or profit-taking on short positions established at higher price levels.
Managed money accounts, a subset of speculative traders, trimmed net longs by 26,087 contracts to 92,072. This positioning represents 22.5% of total open interest, down from the extreme levels above 30% seen in late 2025. The reduction indicates institutional funds are taking profits after gold's substantial gains.
Swap dealers maintain the largest net short exposure at -183,144 contracts, though they reduced this position by 24,552 contracts. Swap dealers often facilitate over-the-counter transactions and ETF operations, suggesting some unwinding of structured products or institutional hedging activity.
The concentration data reveals potential vulnerability, with the top 4 short holders controlling 34.2% of the short side versus just 17.1% for the top 4 longs. This concentration among commercial shorts could amplify any covering rally if fundamental conditions shift toward tighter supply.
Price Action Divergence Analysis
Gold's current price of $4,930.10 represents a -0.37% decline from the previous session, yet it trades well above the $4,979.80 level referenced in recent analyses. This price resilience despite inventory declines and speculative unwinding suggests external factors beyond COMEX fundamentals are driving valuations.
The 24-hour trading range of $4,907.10 to $4,951.50 shows relatively contained volatility despite the underlying structural changes in both physical and paper markets. This stability may reflect central bank buying, geopolitical premium, or technical support levels holding despite the bearish positioning data.
Comparing gold's performance to silver provides additional insight. Silver trades at $74.40, down -1.69% on the day, showing greater weakness than gold. The gold-to-silver ratio expanded to 66.26, up 1.35% as silver underperforms. This divergence often signals different supply-demand dynamics affecting each metal independently.
The disconnect between declining COMEX inventory and modest price weakness suggests gold may be drawing support from sources beyond the futures market. Central bank purchases, retail buying, or safe-haven demand could be offsetting the bearish technical picture emerging from the exchange-traded positioning.
As detailed in our comprehensive guide to COMEX inventory tracking, price divergences from inventory trends often resolve through either sharp corrections or sustained moves in the direction of the physical fundamentals.
Coverage Ratio Implications
The current coverage ratio of 84.08% (total inventory to open interest) sits within acceptable ranges but has declined from levels exceeding 100% seen in 2024. This compression reflects the ongoing tension between growing paper claims and finite physical availability within the COMEX system.
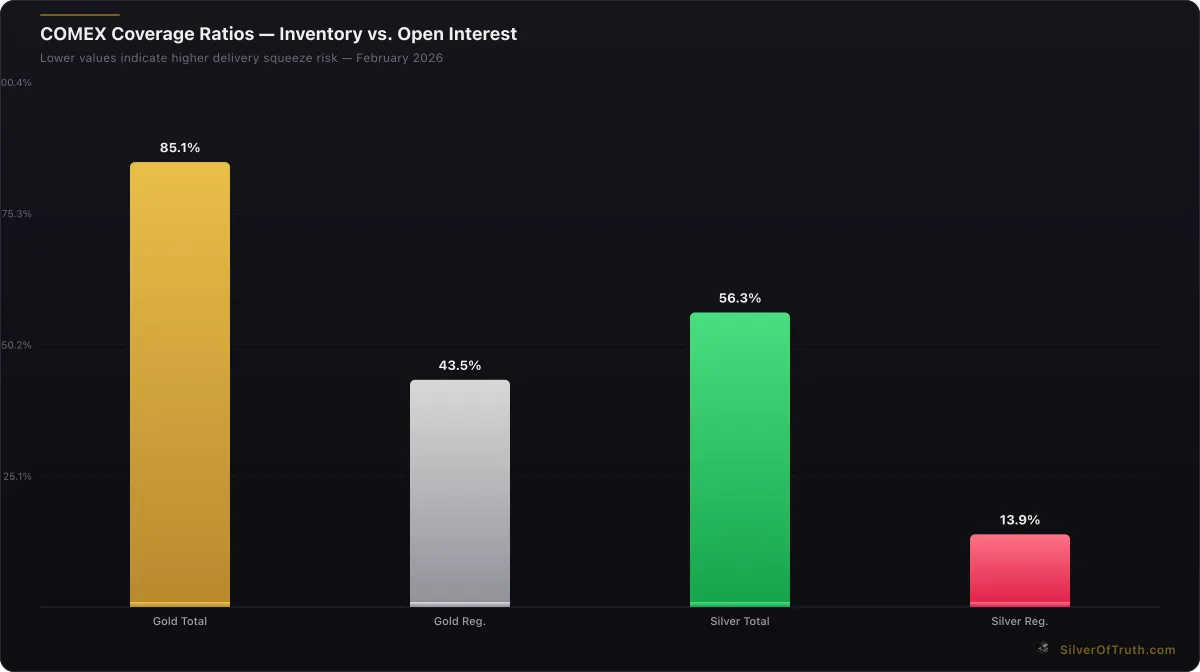
COMEX coverage ratios — lower values indicate higher delivery squeeze risk. Source: SilverOfTruth, February 2026
Registered coverage at 42.93% presents a more concerning picture. With only 17.59 million registered ounces backing 40.97 million ounces of open interest, less than half the paper claims have immediately deliverable backing. This ratio approaches levels that historically trigger increased delivery notices and potential supply stress.
Historical analysis shows coverage ratios below 40% for registered inventory often coincide with elevated delivery activity and warehouse movements. The current 42.93% level sits just above this threshold, suggesting market participants should monitor for signs of increased delivery intentions in upcoming contract months.
The comparison with silver's coverage situation provides perspective. Silver's total coverage ratio of 52.97% and registered coverage of just 12.99% indicate far more severe supply constraints in that market. However, gold's declining trajectory warrants attention, particularly if the drawdown accelerates.
For context on similar supply dynamics, our analysis of delivery squeeze risk in silver markets illustrates how coverage ratios interact with market pricing when physical availability becomes constrained.
Delivery Activity and Warehouse Flows
Current delivery statistics show zero contracts standing for delivery in the nearby March contract, reflecting the typical pattern between front-month expiration and new contract establishment. However, the month-to-date delivery activity of zero contracts masks the underlying warehouse movements driving inventory changes.
Warehouse receipts and withdrawals provide better insight into physical flows. Recent data indicates net withdrawals across the approved depository network, with larger institutional holders removing significant quantities. These movements don't necessarily reflect delivery against futures contracts but rather strategic repositioning of physical holdings.
The timing of withdrawals coincides with recent Federal Reserve policy signals and ongoing geopolitical tensions. Large holders may be moving metal to private storage, international locations, or converting COMEX bars to different forms better suited for specific markets or applications.
Regional flow patterns suggest some metal may be heading to Asian markets where premiums above spot prices remain elevated. The Shanghai Gold Exchange continues reporting strong physical withdrawal activity, indicating robust Eastern demand that could be drawing metal from Western repositories.
Understanding these delivery mechanics proves crucial for investors monitoring supply availability. Our detailed explanation in understanding COT reports covers how delivery activity interacts with positioning data to signal potential market stress points.
Mining Stock Correlation Analysis
Mining stock performance provides additional context for interpreting COMEX inventory changes. Major gold producers have underperformed the underlying metal in recent weeks, suggesting market concerns about production costs, permitting delays, or capital allocation decisions.
The correlation between declining COMEX inventory and mining stock weakness may indicate institutional investors are favoring physical metal over equity exposure. This preference could reflect concerns about mining company operational challenges or simply a rotation toward direct commodity exposure during uncertain economic conditions.
Production data from major mining companies shows steady output levels, suggesting the inventory decline stems from demand-side factors rather than supply disruptions. However, rising all-in sustaining costs (AISC) across the industry may be pressuring margins and affecting long-term production planning.
For investors considering mining stock exposure, our comprehensive guide to evaluating mining stocks covers the key metrics for assessing companies amid changing market conditions. The current environment favors producers with low-cost operations and strong balance sheets.
Central Bank and Institutional Implications
Central bank gold purchases remain a significant factor supporting demand despite COMEX inventory declines. According to World Gold Council data, central banks added substantial reserves in 2025, continuing the multi-year trend of monetary authority accumulation.
The divergence between declining exchange inventory and continued central bank buying suggests different markets serving distinct purposes. Central banks typically purchase through over-the-counter channels rather than COMEX delivery, explaining how strong official sector demand can coexist with exchange inventory drawdowns.
Institutional flows show mixed signals. Exchange-traded fund holdings have remained relatively stable, but private wealth and family office allocations continue growing. These sophisticated investors often prefer physical custody outside exchange systems, contributing to vault outflows without necessarily signaling bearish sentiment.
The implications extend beyond price discovery to market structure. If the trend toward private storage continues, COMEX could see further inventory declines even in a rising price environment. This dynamic would reduce the exchange's role as a global reference point while potentially increasing price volatility.
Strategic Investment Considerations
The current market setup presents both opportunities and risks for gold investors. The combination of declining inventory, speculative position unwinding, and price resilience suggests a market in transition that could move sharply in either direction depending on external catalysts.
Conservative investors might view the inventory decline as a positive supply-side development supporting longer-term price appreciation. The reduction in physical availability within the exchange system could amplify any future buying pressure, particularly if geopolitical tensions escalate or monetary policy shifts toward more accommodation.
Conversely, the significant speculative unwinding visible in COT data indicates reduced bullish momentum in the near term. With managed money and non-commercial traders trimming long positions, the paper market appears vulnerable to further liquidation if external sentiment deteriorates.
Portfolio allocation decisions should consider these competing dynamics. Our analysis of physical versus paper silver provides a framework applicable to gold investments, highlighting the different risk-return profiles of various exposure methods.
For tactical positioning, the current environment may favor dollar-cost averaging over lump-sum purchases, allowing investors to benefit from potential near-term volatility while maintaining exposure to longer-term supply-demand fundamentals.
Risk Assessment and Scenario Planning
Several risk scenarios emerge from the current market configuration. The primary upside scenario involves accelerating inventory declines coinciding with renewed speculative buying, creating a supply squeeze that drives prices sharply higher. This outcome becomes more likely if geopolitical tensions escalate or central bank purchases accelerate.
The downside scenario centers on continued speculative unwinding overwhelming the supportive physical fundamentals. If managed money accounts and other institutional players accelerate their position reduction, the resulting selling pressure could overwhelm the modest supply constraints evident in the inventory data.
A neutral scenario maintains current conditions with gradual inventory normalization and sideways price action. This outcome depends on balanced flows between supply (mining production, recycling) and demand (investment, jewelry, industrial) without significant external shocks.
Risk management strategies should account for each scenario. Position sizing, stop-loss levels, and hedging considerations vary significantly depending on which outcome investors consider most likely. The key lies in maintaining flexibility as new data emerges.
Market Structure Evolution
The ongoing changes in COMEX inventory reflect broader evolution in precious metals market structure. Traditional price discovery mechanisms face challenges from growing private market activity, central bank operations, and retail investment flows occurring outside exchange systems.
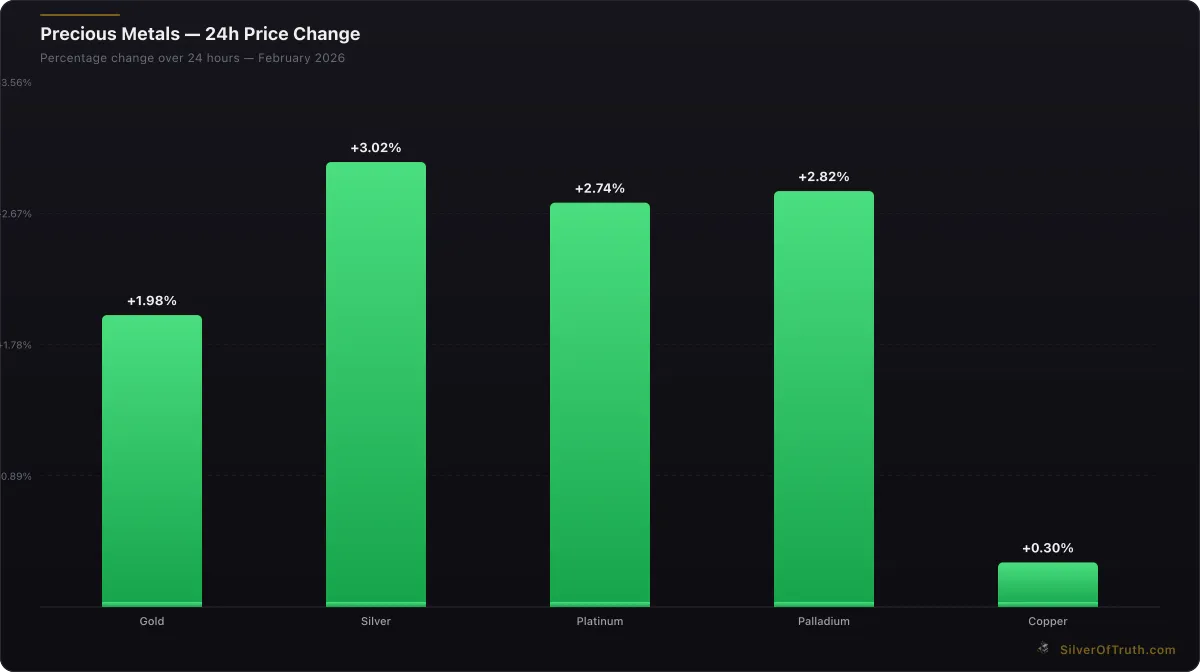
24-hour precious metals price changes. Source: SilverOfTruth, February 2026
This structural shift has implications beyond gold pricing. If physical metal continues migrating toward private storage, the futures market's role as a global benchmark could diminish. Such changes would affect everything from mining company hedging strategies to central bank reserve management decisions.
Technological factors also influence market structure. Digital platforms enabling fractional precious metals ownership, blockchain-based settlement systems, and cryptocurrency correlations all affect traditional gold market dynamics. These innovations may accelerate the trend toward decentralized physical ownership.
Understanding these structural changes proves crucial for long-term investment success. Markets evolve continuously, and successful investors adapt their strategies accordingly while maintaining focus on fundamental supply-demand dynamics that ultimately drive precious metals values.
Frequently Asked Questions
What does a -1.4% COMEX gold inventory drop indicate for gold prices? The inventory decline signals tightening physical availability within the exchange system, which historically supports higher prices. However, current speculative unwinding visible in COT data may offset this bullish factor in the near term, creating a complex dynamic requiring careful monitoring.
How does the coverage ratio of 84.08% compare to historical norms? The current coverage ratio sits within acceptable ranges but has declined from levels above 100% seen in recent years. More concerning is the registered coverage at 42.93%, which approaches historical thresholds associated with delivery stress and increased market volatility.
Why are gold prices holding steady despite inventory declines? Price resilience likely reflects demand sources beyond COMEX, including central bank purchases, geopolitical safe-haven buying, or retail investment flows. The disconnect between exchange fundamentals and price action suggests external factors currently outweigh COMEX-specific dynamics.
Should investors be concerned about the speculative unwinding in COT data? The 39,792-contract reduction in speculative net longs indicates profit-taking after substantial gains, which is normal market behavior. However, the magnitude suggests potential vulnerability to further liquidation if external sentiment shifts negative, warranting cautious positioning.
How do COMEX inventory changes affect mining stock performance? Mining stocks often underperform during inventory drawdowns as investors favor direct metal exposure over equity risk. Current mining stock weakness despite physical supply tightness reflects concerns about operational costs, production challenges, and capital allocation decisions across the sector.
Disclaimer: This article is for informational and educational purposes only and does not constitute financial, investment, or trading advice. Past performance is not indicative of future results. Always conduct your own research and consult with a qualified financial advisor before making investment decisions. SilverOfTruth provides market data and analysis tools — it does not provide personalized financial advice.